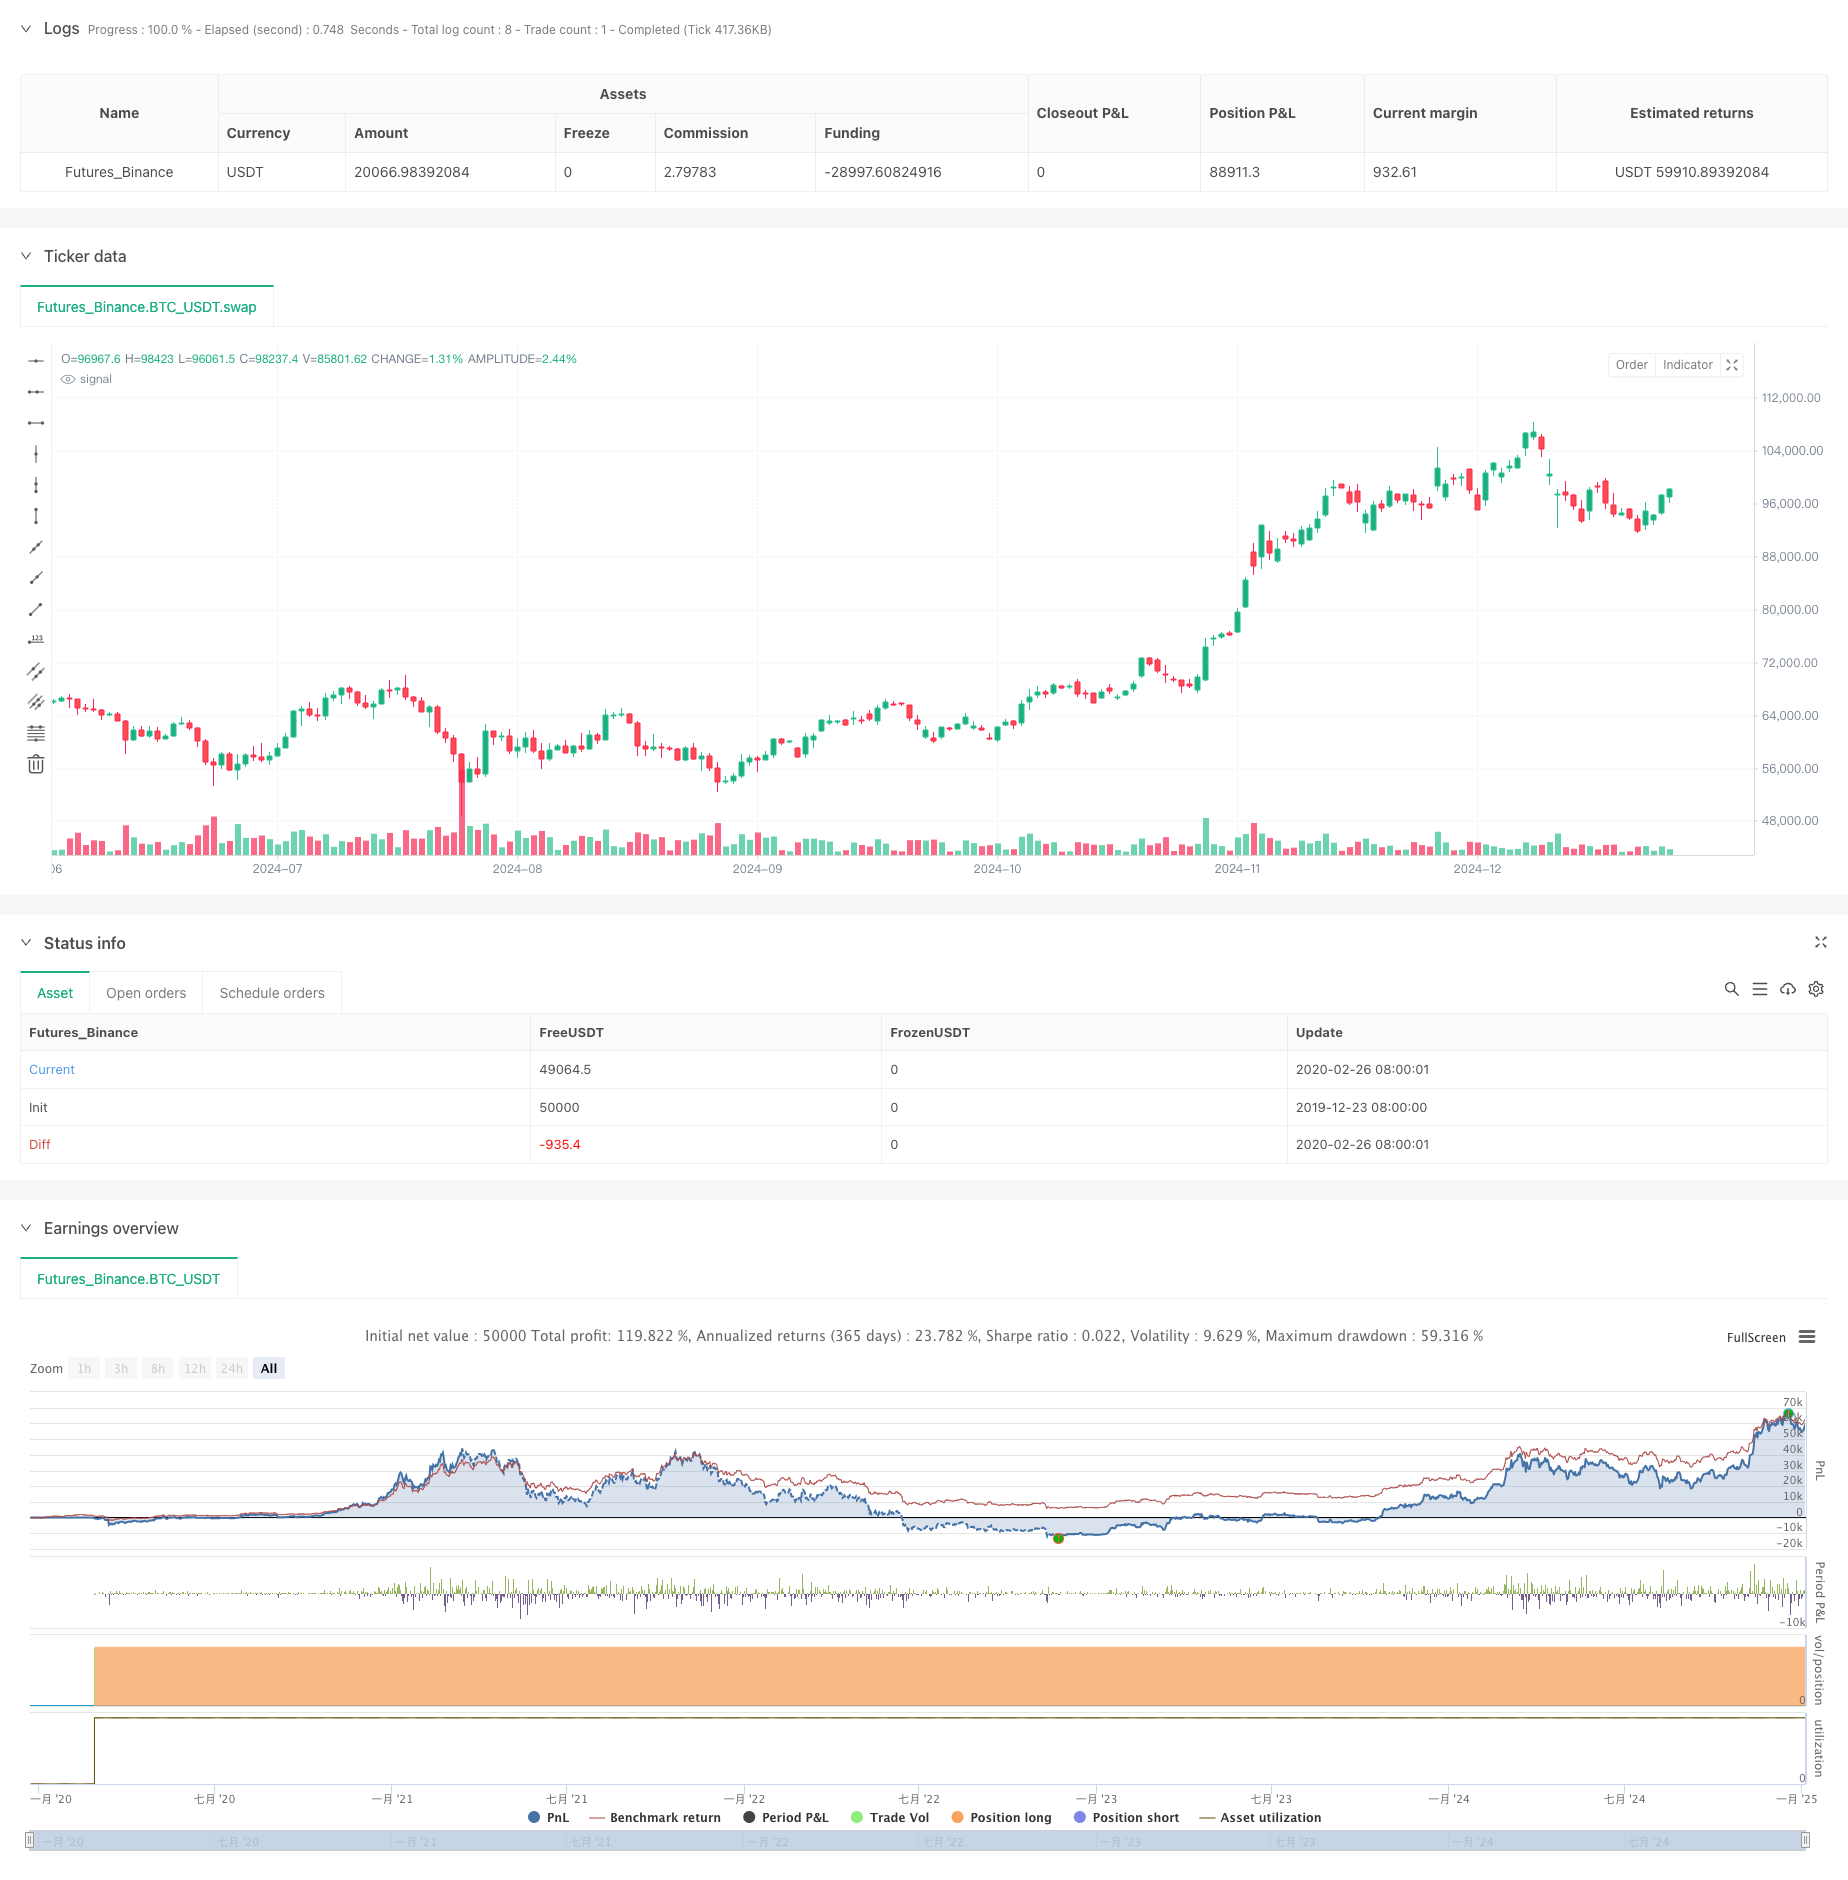
概要
この戦略は、サポートとレジスタンスのレベルと、動的なトレンド チャネルおよびリスク管理機能を組み合わせた高度な取引システムです。この戦略は、特定のルックバック期間内の価格変動の最高点と最低点を分析することで主要なサポートレベルとレジスタンスレベルを特定し、チャネル幅パラメータを使用して動的な取引範囲を構築し、トレーダーに市場構造の明確な見通しと正確な取引シグナルを提供します。
戦略原則
戦略の中核となるロジックには、次の重要な要素が含まれます。
- サポートレベルとレジスタンスレベルは、ユーザーが定義した期間の最低価格と最高価格に基づいて計算されます。
- パーセンテージパラメータを使用して動的チャネル幅を設定し、サポートレベルとレジスタンスレベルに基づいて上部チャネルと下部チャネルを構築します。
- 価格がサポートレベル(サポートレベルの1%以内)に近づくと、買いシグナルが発動されます。
- システムは、ユーザーが設定したパーセンテージに基づいて、ストップロスとテイクプロフィットのレベルを自動的に計算します。
- 取引は指定されたバックテスト期間内にのみ実行されます
- リスクとリターンの比率をリアルタイムで計算して表示し、トレーダーが各取引の潜在的な利益とリスクを評価できるようにします。
戦略的優位性
- 強力な適応性:サポートレベルとレジスタンスレベルは、市場の変化に応じて動的に調整され、さまざまな市場環境に適応します。
- リスク管理の改善:ストップロス、テイクプロフィット、リスクリターン比率の統合計算と視覚化
- 明確な取引シグナル: 主観的な判断の影響を軽減するために明確なエントリーシグナルを提供します
- 優れた視覚化: 異なる価格レベルが、異なる色の線とラベルを通じて直感的に表示されます。
- 柔軟で調整可能なパラメータ: ユーザーは個人の取引スタイルや市場特性に応じてさまざまなパラメータを調整できます。
戦略リスク
- 市場のボラティリティリスク: ボラティリティの高い市場では、取引シグナルが多すぎる可能性があります。
- 偽のブレイクアウトリスク:価格がサポートレベルに近づくと、偽のブレイクアウトが発生し、偽のシグナルが発生する可能性があります。
- パラメータ感度: ルックバック期間とチャネル幅の設定は、戦略のパフォーマンスに大きな影響を与えます。
- 一方的な取引制限:現在の戦略はロング取引のみをサポートしており、ショートの機会を逃す可能性があります。
- 時間依存性: 戦略のパフォーマンスは指定されたバックテスト時間範囲に制限されます
戦略最適化の方向性
- トレンドフィルターの追加: 移動平均またはモメンタムインジケーターを導入して、逆トレンドシグナルを除外します。
- 取引の方向性を改善:空売り取引ロジックを追加して戦略の包括性を向上させる
- シグナル生成の最適化: ボリューム指標による価格ブレイクアウトの有効性の検証
- ダイナミックストップロス設定: ATRまたはボラティリティに基づいてストップロス距離を動的に調整します
- ポジション管理の強化: リスクとリターンの比率と市場のボラティリティに基づいてポジションサイズを動的に調整します。
要約する
この戦略は、テクニカル分析の主要概念(サポートとレジスタンスのレベル、トレンド チャネル)を組み合わせて、厳密なロジックと制御可能なリスクを備えた取引システムを構築します。この戦略の利点は、適応性と健全なリスク管理にありますが、それでもトレーダーは市場の状況と個人のリスク許容度に応じてパラメータを慎重に調整する必要があります。提案された最適化の方向性を通じて、戦略をさらに改善し、より包括的で堅牢な取引システムに開発することができます。
ストラテジーソースコード
/*backtest
start: 2019-12-23 08:00:00
end: 2025-01-04 08:00:00
period: 1d
basePeriod: 1d
exchanges: [{"eid":"Futures_Binance","currency":"BTC_USDT"}]
*/

//@version=5
strategy("Support and Resistance with Trend Lines and Channels", overlay=true)

// Inputs
lookback = input.int(20, title="Lookback Period for Support/Resistance", minval=1)
channelWidth = input.float(0.01, title="Channel Width (%)", minval=0.001) / 100
startDate = input(timestamp("2023-01-01 00:00"), title="Backtesting Start Date")
endDate = input(timestamp("2023-12-31 23:59"), title="Backtesting End Date")

// Check if the current bar is within the testing range
inTestingRange = true

// Support and Resistance Levels
supportLevel = ta.lowest(low, lookback)  // Swing low (support)
resistanceLevel = ta.highest(high, lookback)  // Swing high (resistance)

// Trend Lines and Channels
var line supportLine = na
var line resistanceLine = na
var line upperChannelLine = na
var line lowerChannelLine = na

// Calculate channel levels
upperChannel = resistanceLevel * (1 + channelWidth)  // Upper edge of channel
lowerChannel = supportLevel * (1 - channelWidth)  // Lower edge of channel

// Create or update the support trend line
// if na(supportLine)
//     supportLine := line.new(bar_index, supportLevel, bar_index + 1, supportLevel, color=color.green, width=2, extend=extend.right)
// else
//     line.set_y1(supportLine, supportLevel)
//     line.set_y2(supportLine, supportLevel)

// // Create or update the resistance trend line
// if na(resistanceLine)
//     resistanceLine := line.new(bar_index, resistanceLevel, bar_index + 1, resistanceLevel, color=color.red, width=2, extend=extend.right)
// else
//     line.set_y1(resistanceLine, resistanceLevel)
//     line.set_y2(resistanceLine, resistanceLevel)

// // Create or update the upper channel line
// if na(upperChannelLine)
//     upperChannelLine := line.new(bar_index, upperChannel, bar_index + 1, upperChannel, color=color.blue, width=1, style=line.style_dashed, extend=extend.right)
// else
//     line.set_y1(upperChannelLine, upperChannel)
//     line.set_y2(upperChannelLine, upperChannel)

// // Create or update the lower channel line
// if na(lowerChannelLine)
//     lowerChannelLine := line.new(bar_index, lowerChannel, bar_index + 1, lowerChannel, color=color.purple, width=1, style=line.style_dashed, extend=extend.right)
// else
//     line.set_y1(lowerChannelLine, lowerChannel)
//     line.set_y2(lowerChannelLine, lowerChannel)

// Buy Condition: When price is near support level
buyCondition = close <= supportLevel * 1.01 and inTestingRange
if buyCondition
    strategy.entry("Buy", strategy.long)

// Stop Loss and Take Profit
stopLossPercentage = input.float(1.5, title="Stop Loss Percentage", minval=0.0) / 100
takeProfitPercentage = input.float(3.0, title="Take Profit Percentage", minval=0.0) / 100

var float longStopLoss = na
var float longTakeProfit = na
if strategy.position_size > 0
    longStopLoss := strategy.position_avg_price * (1 - stopLossPercentage)
    longTakeProfit := strategy.position_avg_price * (1 + takeProfitPercentage)
    strategy.exit("Exit Buy", "Buy", stop=longStopLoss, limit=longTakeProfit)

// Visualize Entry, Stop Loss, and Take Profit Levels
var float entryPrice = na
if buyCondition
    entryPrice := close
if not na(entryPrice)
    label.new(bar_index, entryPrice, text="Entry: " + str.tostring(entryPrice, "#.##"), style=label.style_label_up, color=color.green, textcolor=color.white)

if strategy.position_size > 0
    line.new(bar_index, longStopLoss, bar_index + 1, longStopLoss, color=color.red, width=1, extend=extend.right)
    line.new(bar_index, longTakeProfit, bar_index + 1, longTakeProfit, color=color.blue, width=1, extend=extend.right)

// Risk-to-Reward Ratio (Optional)
if not na(entryPrice) and not na(longStopLoss) and not na(longTakeProfit)
    riskToReward = (longTakeProfit - entryPrice) / (entryPrice - longStopLoss)
    label.new(bar_index, entryPrice, text="R:R " + str.tostring(riskToReward, "#.##"), style=label.style_label_up, color=color.yellow, textcolor=color.black, size=size.small)