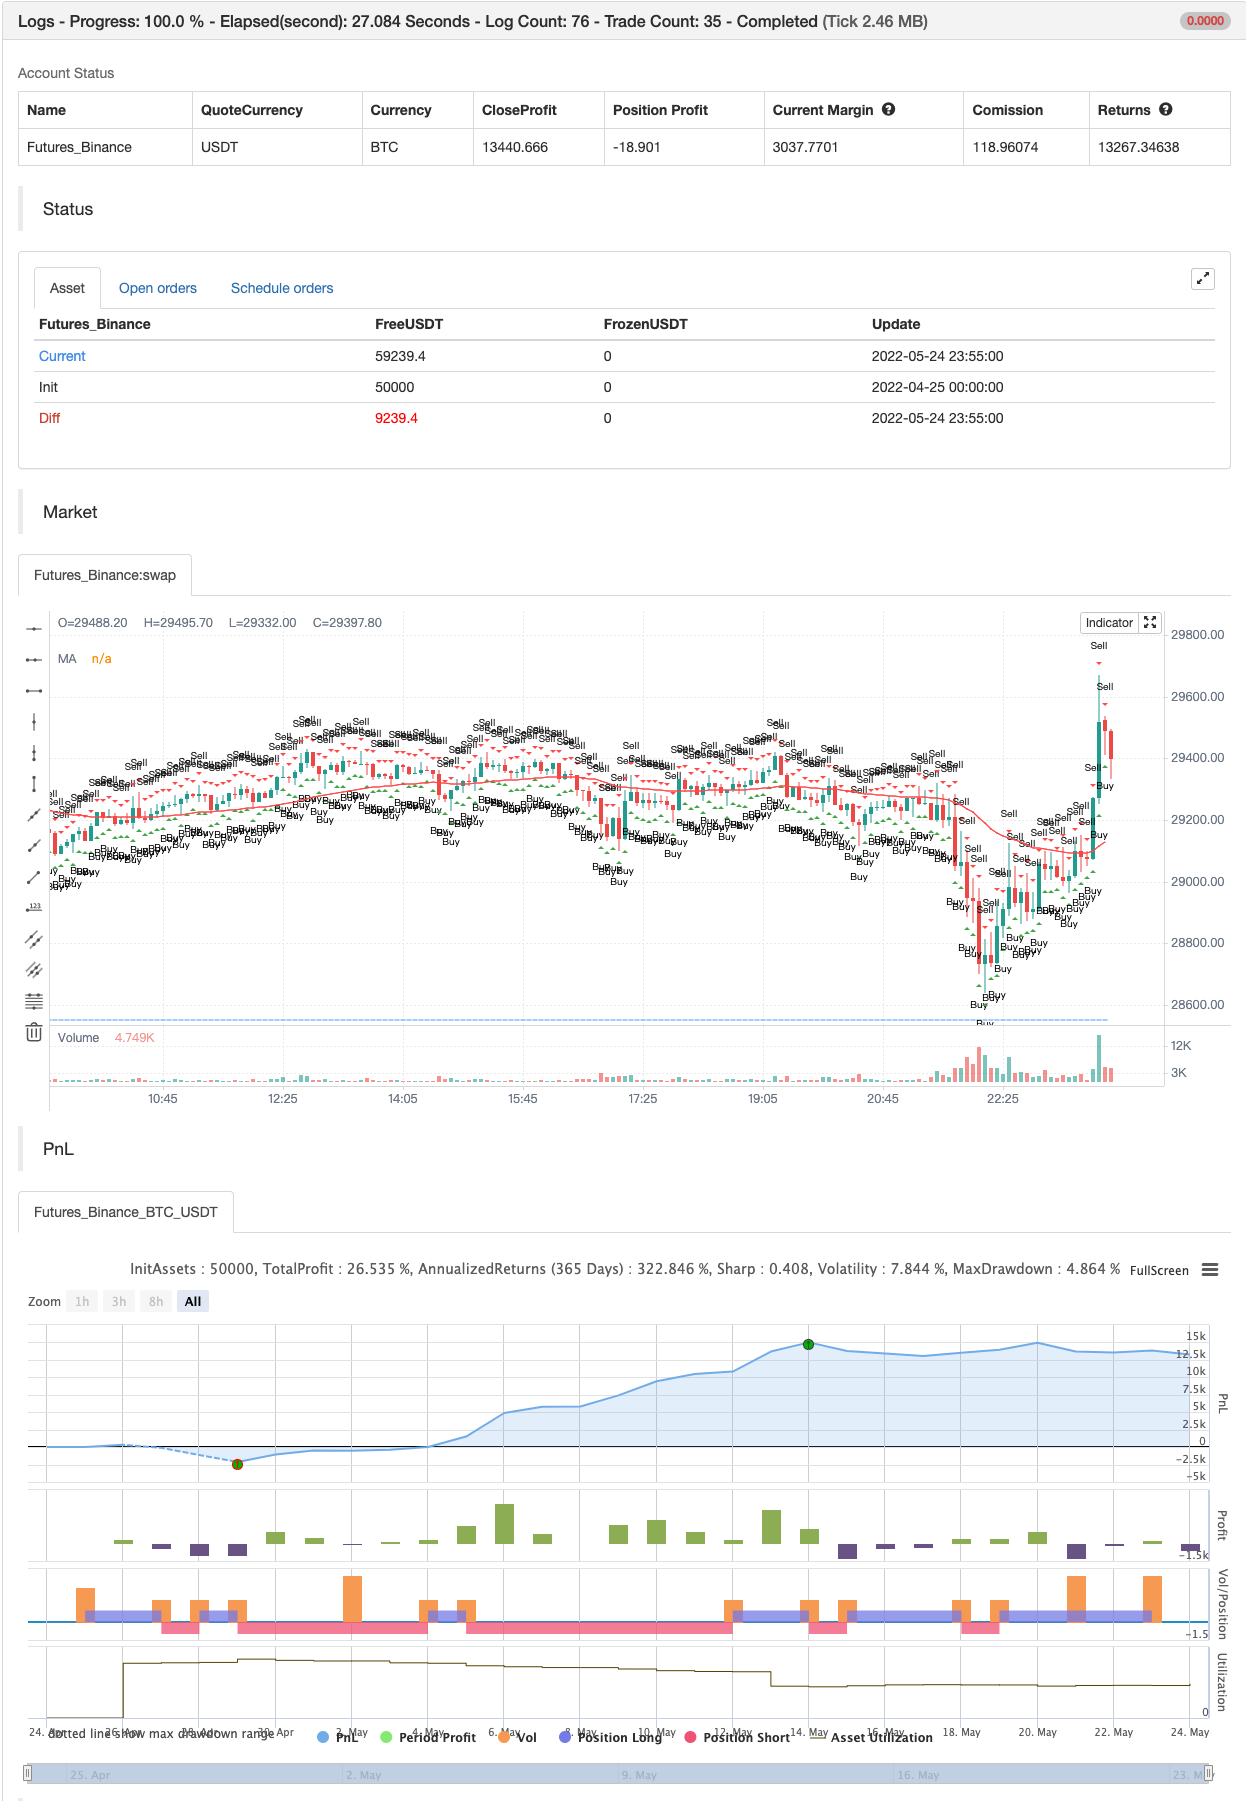
구매/판매로 EMA ADX RSI를 스칼핑
저자:차오장, 날짜: 2022-05-26 17:11:01태그:ADXRMARSIEMASMAWMA
이것은 유튜브 채널 중 하나에서 보이는 전략에 대한 항목을 보여주는 연구 지표입니다. 그래서 그것은 나에게 속하지 않습니다. 광고하는 것이 하우스 규칙에 어긋나기 때문에 누가인지 알 수 없지만 유튜브에서 검색하면 알 수 있습니다. 제안 된 대로 조정 된 오시레이터와 ema의 기본 값. 그는 5 분 시간 프레임에서 최고의 결과를 얻었다고 말하지만 가능한 한 변경 가능한 것들을 만들려고 노력했습니다. 설정에 혼란을 일으키고 원하는 경우 다른 시간 프레임에 대한 자신의 전략을 만들 수 있습니다. 촛불 차트와 함께 사용하는 것이 좋습니다. 아래의 파란색 선은 ADX가 설정된 선택 한계 이상으로 표시됩니다.
진입 전략 자체는 꽤 간단합니다. 입력 규칙은 다음과 같습니다. 스크립트는 자동으로 이 모든 것을 확인하고 사거나 판매 신호를 제공합니다. 권장 시간: 5분
긴 출입:
- 가격이 설정된 EMA보다 높는지 확인하세요 (설정을 통해 이 규칙을 비활성화 할 수 있습니다.)
- RSI는 과잉 판매입니다.
- ADX는 설정된
트렌드 준비 문턱 이상입니다 (트렌드가 진행되고 있다는 의미) - 가격은 이전 촛불의 경향을 승인해야 합니다. 이것은 구매 입시에 상승하고 판매 입시에 하락합니다.
- 마지막 스윙 최저보다 낮은 스톱 로스로 들어가 1:1 또는 1.5:1의 수익률을 취합니다.
짧은 문장:
- 가격이 설정된 EMA 이하인지 확인하세요 (설정을 통해 원하는 경우 이 규칙을 비활성화할 수 있습니다)
- RSI는 과잉 매입입니다
- ADX는 설정된
트렌드 준비 문턱 이상입니다 (트렌드가 진행되고 있다는 의미) - 가격은 이전 촛불의 경향을 승인해야 합니다. 이것은 구매 입시에 상승하고 판매 입시에 하락합니다.
- 마지막 스윙 최고보다 높은 스톱 로스로 들어가 1:1 또는 1.5:1의 수익률을 취합니다.
이것은 제 첫 번째 지표입니다. 업데이트가 필요하다면 알려주세요. 모든 것을 추가할 수 있는지 확신하지 못합니다. 하지만 그래도 노력하겠습니다.
변경: 신호는 신호를 표시하기 위해 RSI가 설정된 값보다 낮거나 높으면 2 개의 촛불까지 확인합니다. 이것은 입력 신호가 맞지만 응답이 약간 늦어질 수 있기 때문입니다.
백테스트

/*backtest
start: 2022-04-25 00:00:00
end: 2022-05-24 23:59:00
period: 5m
basePeriod: 1m
exchanges: [{"eid":"Futures_Binance","currency":"BTC_USDT"}]
*/

//@version=5
indicator(title='EMA RSI ADX Scalping Alerts', shorttitle="ERA Scalper", overlay=true)

//Define MA Inputs and group them
maType = input.string(title="MA Type", options=["EMA", "SMA", "WMA", "VWMA", "HMA", "RMA", "DEMA", "TEMA", "LSMA", "ZLSMA"], defval="EMA", group='MA Settings')
emaSource = input.source(title='MA Source', defval=close, group='MA Settings')
emaLength = input.int(title='MA Length', defval=50, minval=1, maxval=999, group='MA Settings')

//Other Moving Avarage Calculations
e1 = ta.ema(emaSource, emaLength)
e2 = ta.ema(e1, emaLength)
dema = 2 * e1 - e2

ema1 = ta.ema(emaSource, emaLength)
ema2 = ta.ema(ema1, emaLength)
ema3 = ta.ema(ema2, emaLength)
tema = 3 * (ema1 - ema2) + ema3

lsmaOffset = input.int(title="LSMA Offset", defval=0, minval=0, maxval=100, tooltip='Only used if you choose the LSMA and ZLSMA(Zero Lag LSMA) Option between MA Types', group='MA Settings')
lsma = ta.linreg(emaSource, emaLength, lsmaOffset)
lsma2 = ta.linreg(lsma, emaLength, lsmaOffset)
eq = lsma-lsma2
zlsma = lsma+eq

// Switch between different MA Types
emaValue = switch maType
    "EMA" => ta.ema(emaSource, emaLength)
    "SMA" => ta.sma(emaSource, emaLength)
    "WMA" => ta.wma(emaSource, emaLength)
    "VWMA" => ta.vwma(emaSource, emaLength)
    "HMA" => ta.hma(emaSource, emaLength)
    "RMA" => ta.rma(emaSource, emaLength)
    "DEMA" => dema
    "TEMA" => tema
    "LSMA" => lsma
    "ZLSMA" => zlsma
    =>
        runtime.error("No matching MA type found.")
        float(na)

//Define RSI inputs and group them
rsiSource = input.source(title='RSI Source', defval=close, group='RSI Settings')
rsiLength = input.int(title='RSI Length', defval=3, minval=0, maxval=100, group='RSI Settings')
rsiValuee = ta.rsi(rsiSource, rsiLength)
rsiOverbought = input.int(title='RSI Overbought Level', defval=80, group='RSI Settings')
rsiOversold = input.int(title='RSI Oversold Level', defval=20, group='RSI Settings')

//Define overbought and oversold conditions
isRsiOB = rsiValuee >= rsiOverbought
isRsiOS = rsiValuee <= rsiOversold

//ADX Inputs and calculation of the value
adxlen = input.int(5, title='ADX Smoothing', group='ADX Settings')
dilen = input.int(5, title='DI Length', group='ADX Settings')
dirmov(len) =>
    up = ta.change(high)
    down = -ta.change(low)
    plusDM = na(up) ? na : up > down and up > 0 ? up : 0
    minusDM = na(down) ? na : down > up and down > 0 ? down : 0
    truerange = ta.rma(ta.tr, len)
    plus = fixnan(100 * ta.rma(plusDM, len) / truerange)
    minus = fixnan(100 * ta.rma(minusDM, len) / truerange)
    [plus, minus]
adx(dilen, adxlen) =>
    [plus, minus] = dirmov(dilen)
    sum = plus + minus
    adx = 100 * ta.rma(math.abs(plus - minus) / (sum == 0 ? 1 : sum), adxlen)
    adx
sig = adx(dilen, adxlen)

//Define the input and value where it is considered that there is a trend going on
adxLimit = input.int(title='Trend Ready Limit', defval=30, minval=0, maxval=100, group='ADX Settings')
trendReady = sig > adxLimit

//Draw trend ready at the bottom of the chart for better viewing so that you can change the value based on what you see easier
plotADX = input(title='Draw Trend Ready On Chart', defval=false)
readyFold = plotADX and sig > adxLimit
plotchar(series=readyFold, title='Trend Ready', location=location.bottom, color=color.new(color.blue, 0), size=size.small, char='_')

//Plot the EMA on chart
enableEmaRule = input(title='Enable MA Rule', defval=true)

//Define the signal conditions and choice to add or leave out MA Rule if you wish so
alertLong = enableEmaRule ? low > emaValue and (rsiValuee <= rsiOversold or rsiValuee[1] <= rsiOversold or rsiValuee[2] <= rsiOversold) and sig > adxLimit and close > high[1] : (rsiValuee <= rsiOversold or rsiValuee[1] <= rsiOversold or rsiValuee[2] <= rsiOversold) and sig > adxLimit and close > high[1]
alertShort = enableEmaRule ? high < emaValue and (rsiValuee >= rsiOverbought or rsiValuee[1] >= rsiOverbought or rsiValuee[2] >= rsiOverbought) and sig > adxLimit and close < low[1] : (rsiValuee >= rsiOverbought or rsiValuee[1] >= rsiOverbought or rsiValuee[2] >= rsiOverbought) and sig > adxLimit and close < low[1]
plot(enableEmaRule ? emaValue : na, color=color.new(color.red, 0), title='MA')

//Buy and Sell Shapes on Chart
plotshape(alertLong, title='Buy', location=location.belowbar, color=color.new(color.green, 0), size=size.small, style=shape.triangleup, text='Buy')
plotshape(alertShort, title='Sell', location=location.abovebar, color=color.new(color.red, 0), size=size.small, style=shape.triangledown, text='Sell')

//Alerts
alertcondition(title='Buy Alert', condition=alertLong, message='Long Conditions are Met')
alertcondition(title='Sell Alert', condition=alertShort, message='Short Conditions are Met')
alertcondition(title='Buy / Sell Alert', condition=alertLong or alertShort, message='Conditions Met for Buy or Short')

if alertLong
    strategy.entry("Enter Long", strategy.long)
else if alertShort
    strategy.entry("Enter Short", strategy.short)
관련
- 슈퍼 스칼퍼 - 5분 15분
- 동적 RSI 스마트 타이밍 스윙 거래 전략
- VWMA-ADX 모멘텀 및 트렌드 기반 비트코인 장기 전략
- 레인보우 오시레이터
- 적응형 다중 이동 평균 크로스오버 동적 거래 전략
- 슈퍼 점프 턴 백 볼링거 밴드
- 슈퍼 스칼퍼
- ESSMA
- 동적 포지션 사이징 단기 외환 거래 전략
- 더 똑똑한 MACD
더 많은