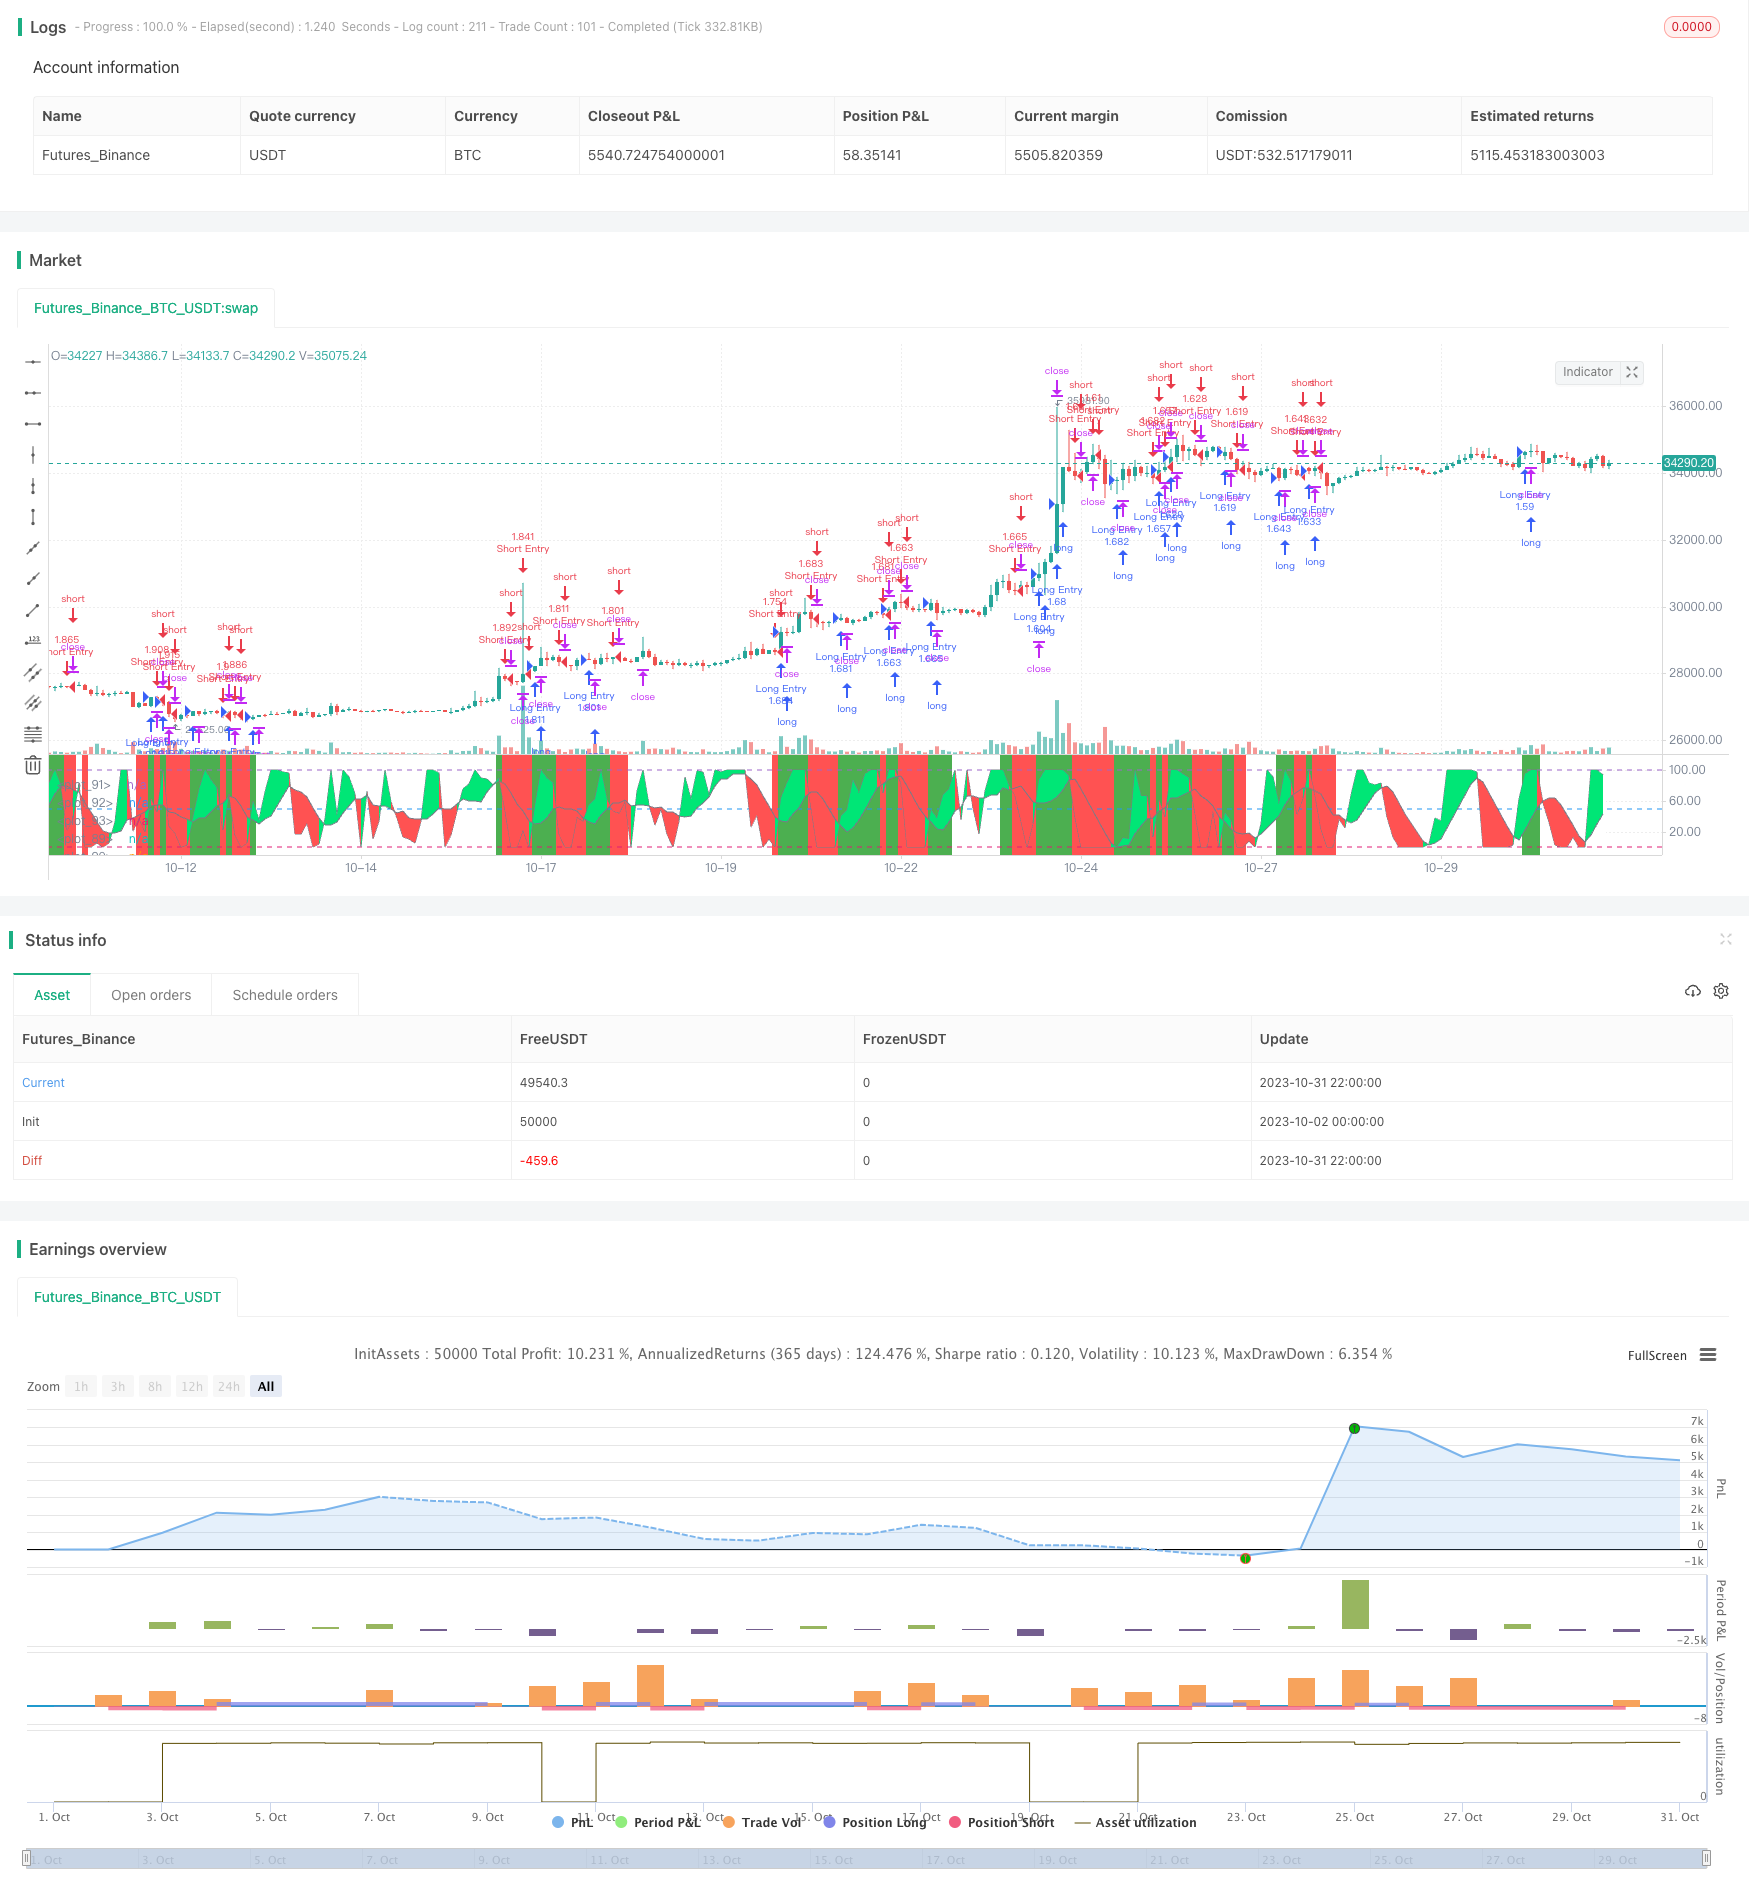
개요
이 전략은 Stochastic RSI와 가격 변화율 지표를 사용하여, 트렌드 방향을 식별하여 다중 공명으로 들어가고, 좌표 슬라이드 스톱로스 방법을 사용하여 위험을 관리한다.
전략 원칙
우선, 전략은 길이 5의 RSI 지표와 길이 7의 스토카스틱 지표를 사용하여 스토카스틱 RSI를 계산합니다. 스토카스틱 RSI의 K 값이 D 값보다 높을 때 상향 신호이며, K 값이 D 값보다 낮을 때 하향 신호입니다.
두 번째로, 전략은 가격의 변화율 지표 EMA ROC를 계산한다. EMA ROC가 절감값의 반 이상 또는 절감값의 마이너스 반 이하일 때, 가격이 활발하게 변하는 것으로 간주한다.
다음으로, 스토카스틱 RSI의 다공이 신호와 가격 변화율 지표와 결합하여 트렌드 방향을 식별할 수 있습니다. 스토카스틱 RSI가 부진하고 가격이 활발하게 변할 때, 더 많이; 스토카스틱 RSI가 하락하고 가격이 활발하게 변할 때, 더 많이 니다.
마지막으로, 이 전략은 좌표 슬라이딩 스톱 방식을 사용하여 위험을 관리한다. 포지션을 열고 나서, 최고 가격이나 최저 가격을 계속 업데이트하고, 최고 가격이나 최저 가격에서 일정 비율로 멀리 떨어져있는 스톱 포지션이다.
우위 분석
이 전략은 다음과 같은 장점을 가지고 있습니다.
스토카스틱 RSI 지표를 사용하면 트렌드 및 오버 바이 오버 소드를 효과적으로 식별 할 수 있습니다.
가격 변동률 지표는 시장의 불안정한 평가를 필터링하여 잘못된 신호를 방지할 수 있습니다.
좌표 슬라이딩 스톱로스는 수익을 최대한 고정시키면서 동시에 위험을 조절할 수 있다.
정책 파라미터를 최적화할 수 있는 공간이 넓고, 다양한 품종에 맞게 조정할 수 있다.
전략은 간단하고 명확하며, 실행을 이해하기 쉽습니다.
위험 분석
이 전략에는 몇 가지 위험도 있습니다.
스토카스틱 RSI는 가짜 신호를 생성할 수 있으며, 다른 요소와 함께 확인해야 한다.
좌표 미끄러짐은 너무 급진적일 수 있으며, 밤새 틈을 뚫어 질 수 있다.
단기 반전으로 인해 정지 손실이 발생할 수 있습니다.
정책 파라미터는 다양한 품종에 대해 최적화해야 합니다. 그렇지 않으면 효과가 좋지 않을 수 있습니다.
거래 비용은 전략의 수익성에 영향을 미치므로 합리적인 거래 빈도를 고려해야합니다.
최적화 방향
이 전략은 다음과 같은 부분에서 최적화될 수 있습니다.
스토카스틱 RSI 파라미터를 최적화하여 가짜 신호율을 감소시킨다. 다양한 K값과 D값 파라미터를 테스트할 수 있다.
가격 변동률 지표 매개 변수를 최적화하여 필터링 효과를 향상시킵니다. 다양한 창 기간과 변동률 값을 테스트 할 수 있습니다.
트렌드를 판단하는 지표와 결합하여 역전 손실을 피하십시오. 이동 평균을 추가하는 것과 같은 지표
손해배상 비율을 최적화하여, 피지배 위험을 줄인다. 다양한 손해배상 폭을 테스트할 수 있다.
포지션 수를 관리하고, 단위 리스크를 제어한다. 예를 들어, 고정된 스톱 로드 금액, 또는 계정 잔액에 따라 포지션을 동적으로 조정한다.
다양한 품종의 변수를 테스트하여 적응력을 향상시킵니다. 여러 시장에서 여러 시간 주기 검증을 선호합니다.
요약하다
이 전략의 전체적인 아이디어는 명확하고 간단하며, Stochastic RSI를 사용하여 트렌드 방향을 식별하고, 가격 변화율 지표 필터링 신호와 함께, 중장선 트렌드 기회를 효과적으로 포착할 수 있습니다. 좌표 미끄러짐 스톱 손실 방법은 수익을 고정하면서 위험을 제어 할 수 있습니다. 이 전략은 추가적으로 최적화하면 매우 실용적인 트렌드 추적 전략이 될 수 있습니다.
/*backtest
start: 2023-10-02 00:00:00
end: 2023-11-01 00:00:00
period: 2h
basePeriod: 15m
exchanges: [{"eid":"Futures_Binance","currency":"BTC_USDT"}]
*/

//@version=4
strategy("Sto2", overlay=false, initial_capital=10000, default_qty_type=strategy.percent_of_equity, default_qty_value=100, commission_type=strategy.commission.percent, commission_value=0.0)

/////////////// Time Frame ///////////////
testStartYear = input(2017, "Backtest Start Year")
testStartMonth = input(1, "Backtest Start Month")
testStartDay = input(1, "Backtest Start Day")
testPeriodStart = timestamp(testStartYear,testStartMonth,testStartDay, 0, 0)

testStopYear = input(2019, "Backtest Stop Year")
testStopMonth = input(12, "Backtest Stop Month")
testStopDay = input(31, "Backtest Stop Day")
testPeriodStop = timestamp(testStopYear,testStopMonth,testStopDay, 0, 0)

testPeriod() => true

///////////// Stochastic calc /////////////
smoothK = input(1, minval=1)
smoothD = input(7, minval=1)
lengthRSI = input(5, minval=1)
lengthStoch = input(7, minval=1)
src = input(close, title="RSI Source")

up = sma(max(change(src), 0), lengthRSI)
down = sma(-min(change(src), 0), lengthRSI)
rsi1 = down == 0 ? 100 : up == 0 ? 0 : 100 - (100 / (1 + up / down))

k = sma(stoch(rsi1, rsi1, rsi1, lengthStoch), smoothK)
d = sma(k, smoothD)

///////////// Rate Of Change /////////////
source = close, roclength = input(14, minval=1), pcntChange = input(2, minval=1)
roc = 100 * (source - source[roclength]) / source[roclength]
emaroc = ema(roc, roclength / 2)
isMoving() => emaroc > (pcntChange / 2) or emaroc < (0 - (pcntChange / 2))

/////////////// STRATEGY ///////////////
long = k > d and isMoving()
short = k < d and isMoving()

last_long = 0.0
last_short = 0.0
last_long := long ? time : nz(last_long[1])
last_short := short ? time : nz(last_short[1])

long_signal = crossover(last_long, last_short)
short_signal = crossover(last_short, last_long)

last_open_long_signal = 0.0
last_open_short_signal = 0.0
last_open_long_signal := long_signal ? open : nz(last_open_long_signal[1])
last_open_short_signal := short_signal ? open : nz(last_open_short_signal[1])

last_long_signal = 0.0
last_short_signal = 0.0
last_long_signal := long_signal ? time : nz(last_long_signal[1])
last_short_signal := short_signal ? time : nz(last_short_signal[1])

in_long_signal = last_long_signal > last_short_signal
in_short_signal = last_short_signal > last_long_signal

last_high = 0.0
last_low = 0.0
last_high := not in_long_signal ? na : in_long_signal and (na(last_high[1]) or high > nz(last_high[1])) ? high : nz(last_high[1])
last_low := not in_short_signal ? na : in_short_signal and (na(last_low[1]) or low < nz(last_low[1])) ? low : nz(last_low[1])
sl_inp = input(2.0, title='Stop Loss %') / 100
tp_inp = input(9.0, title='Take Profit %') / 100

take_level_l = strategy.position_avg_price * (1 + tp_inp)
take_level_s = strategy.position_avg_price * (1 - tp_inp)

since_longEntry = barssince(last_open_long_signal != last_open_long_signal[1]) // LONG SL
since_shortEntry = barssince(last_open_short_signal != last_open_short_signal[1]) // SHORT SL

slLong = in_long_signal ? strategy.position_avg_price * (1 - sl_inp) : na
slShort = strategy.position_avg_price * (1 + sl_inp)
long_sl = in_long_signal ? slLong : na
short_sl = in_short_signal ? slShort : na

// Strategy
if testPeriod()
    strategy.entry("Long Entry",  strategy.long, when=long)
    strategy.entry("Short Entry", strategy.short, when=short)
    strategy.exit("Long Ex", "Long Entry", stop=long_sl, limit=take_level_l, when=since_longEntry > 0)
    strategy.exit("Short Ex", "Short Entry", stop=short_sl, limit=take_level_s, when=since_shortEntry > 0)

///////////// Plotting /////////////
bgcolor(isMoving() ? long ? color.green : short ? color.red : na : color.white, transp=80)
p1 = plot(k, color=color.gray, linewidth=0)
p2 = plot(d, color=color.gray, linewidth=0)
h0 = hline(100)
h1 = hline(50)
h3 = hline(0)
fill(p1, p2, color = k > d ? color.lime : color.red, transp=70)