동적 이동 평균 트렌드 거래 전략
저자:차오장, 날짜: 2023년 11월 15일 17:45:13태그:

전반적인 설명
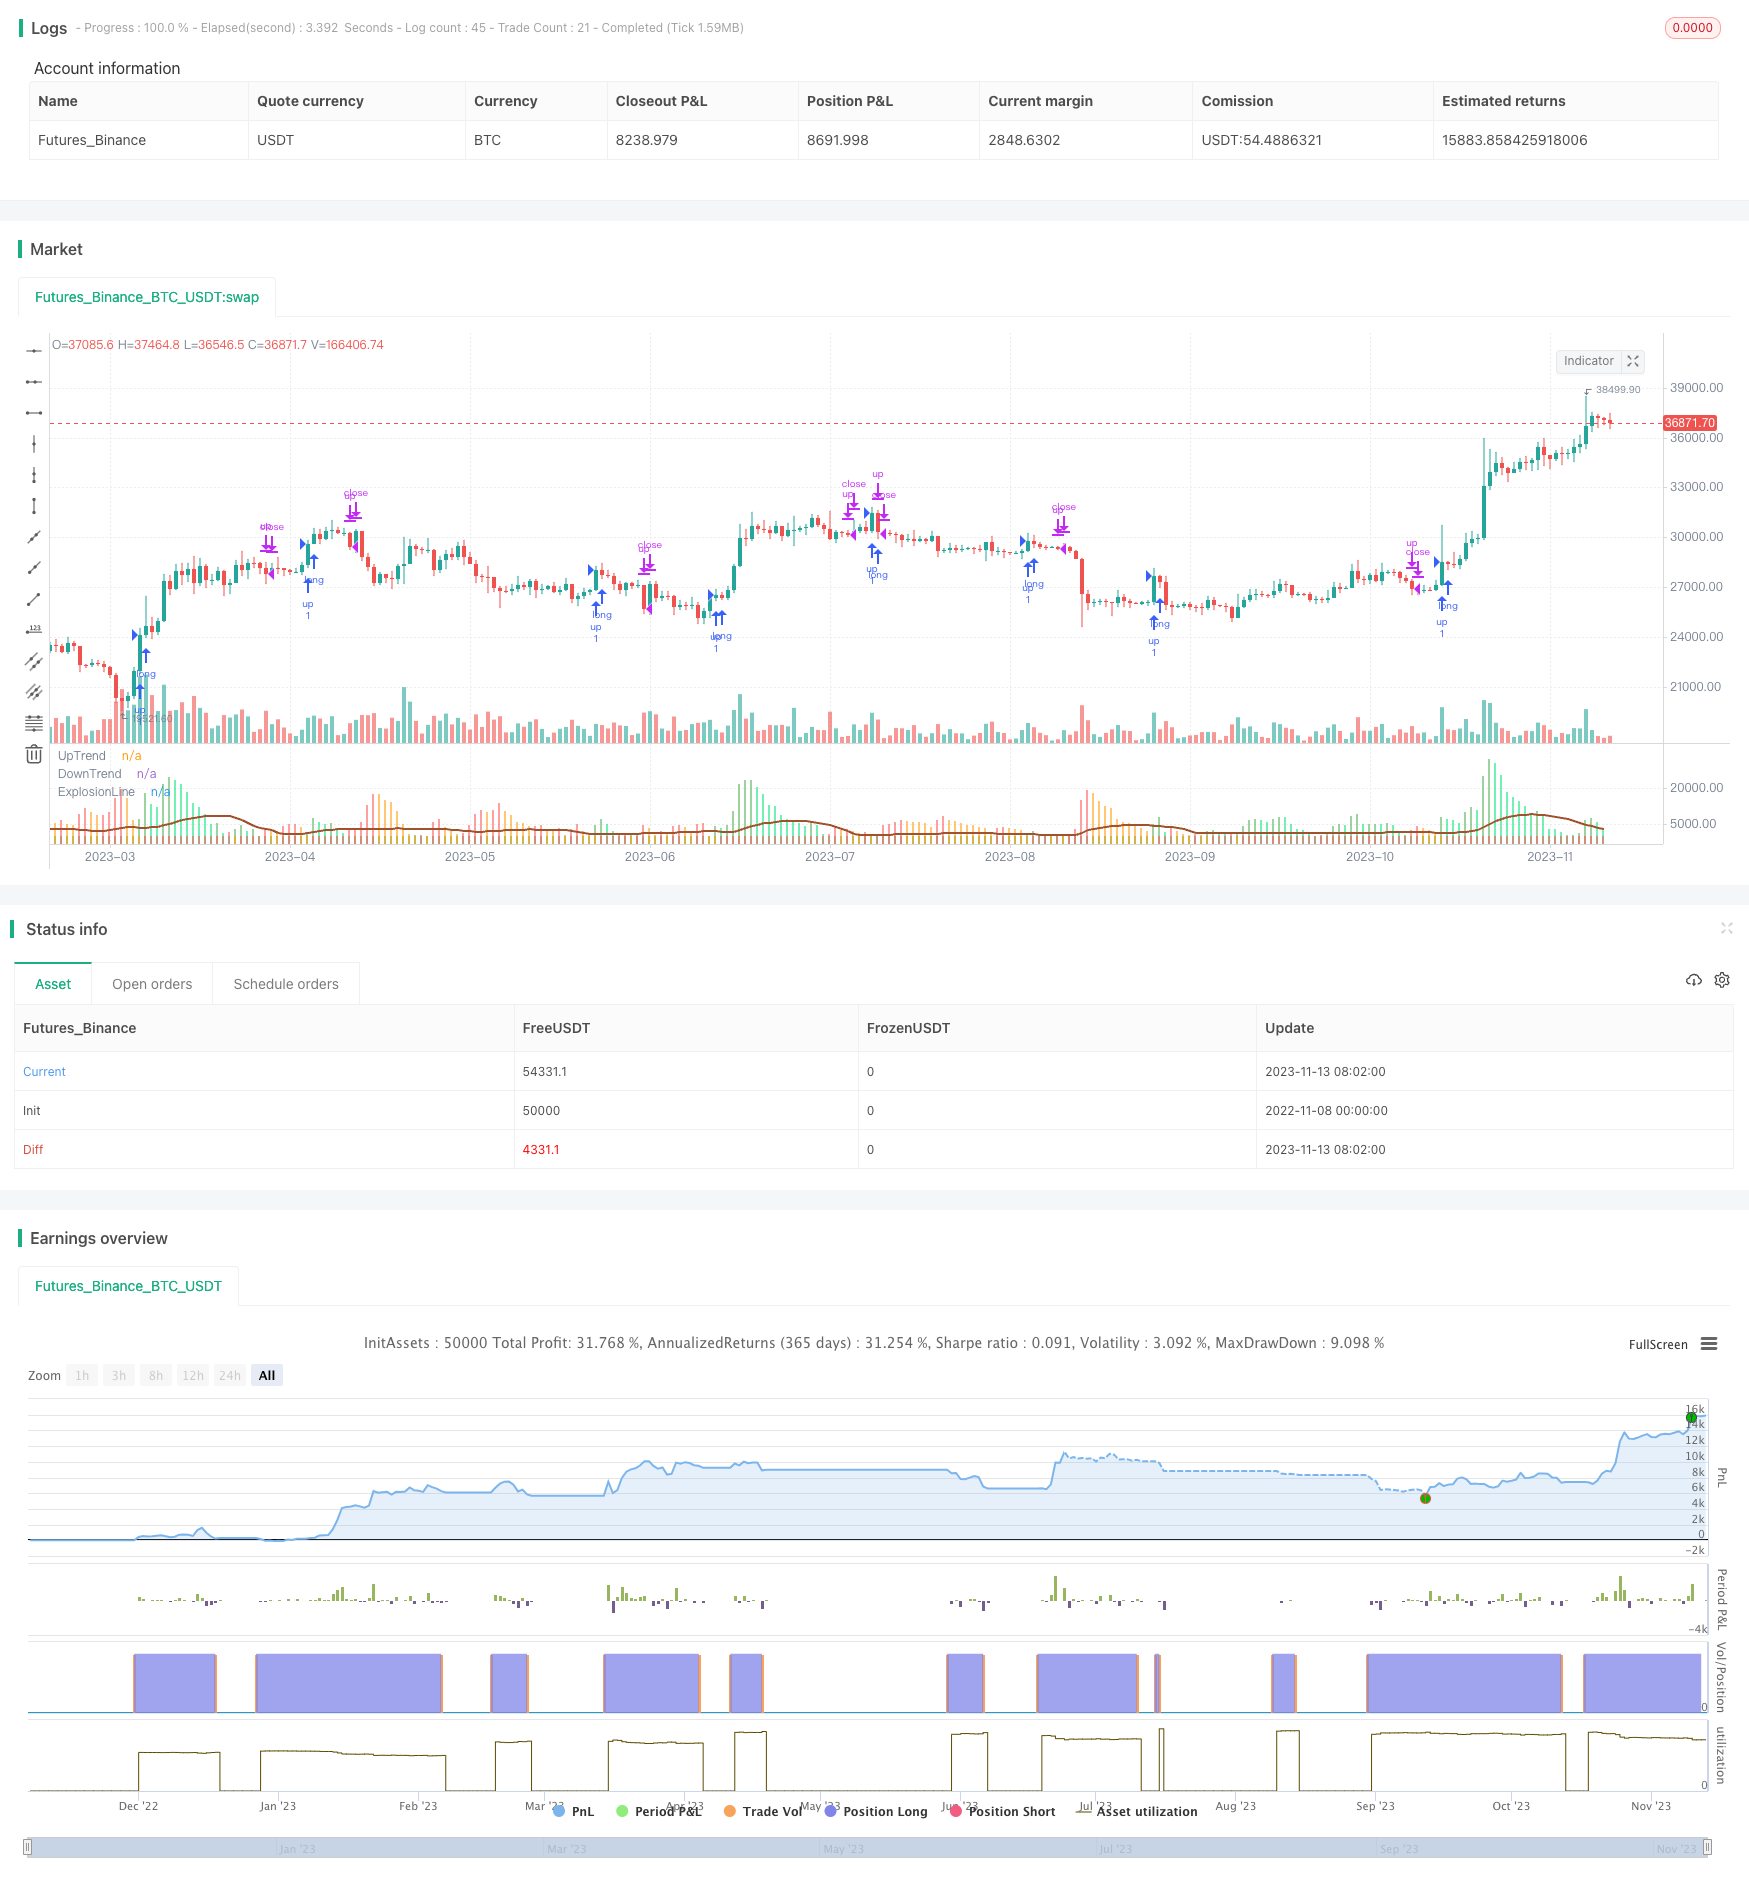
이 전략은 무역 신호 필터링을 위해 볼링거 밴드 (Bollinger Bands) 와 RSI (RSI) 를 결합한 동적 이동 평균 지표 (Dynamic Moving Average) 를 기반으로 합니다. 이 전략은 긴 단 전략에 따른 트렌드를 구현합니다. 이 전략은 하이켄 아시 (Heiken Ashi) 폐쇄 가격 동적 이동 평균의 변화를 계산하여 트렌드를 추적하기 위한 트렌드 폭발 지점을 효과적으로 식별할 수 있습니다.
전략 논리
이 전략의 핵심은 하이켄 아시 폐쇄 가격 동적 이동 평균의 변화를 계산하는 것입니다. 구체적으로, 현재 바
이 변화 값은 볼링거 밴드 상단과 하단 사이의 차이와 비교된다. MA 변화가 BB 차이보다 크다면, 그것은
또한 이 전략은 RSI 필터를 가지고 있으며, RSI가 한 임계보다 높을 때만 긴 신호를 허용하여 트렌드 역전 위험을 피합니다.
장점
- 동적 MA는 트렌드 변화를 효과적으로 추적합니다.
- 동적 지표 BB와 MA를 결합하여 더 나은 트렌드 폭발 식별
- RSI 필터는 낮은 리바운드에서 잘못된 신호를 피합니다.
- 장기간 지속적 인 황소 시장에만 적합합니다.
- 다양한 제품 및 시간 프레임에 대한 유연한 조정 가능한 매개 변수
위험성
- 단 단장만 하락 추세에서 이익을 얻을 수 없습니다
- 다른 제품과 시간 프레임에 대한 매개 변수 최적화에 과도하게 의존합니다.
- 트렌드 반전을 효과적으로 포착하지 못하면 큰 손실이 발생할 수 있습니다.
- 잘못된 RSI 필터 설정은 거래 기회를 놓칠 수 있습니다.
- 높은 감수성이 시끄러운 거래를 일으킬 수 있습니다.
위험 통제 방법은: 안정성을 위한 적절한 매개 변수 조정, 추세 반전을 판단하기 위해 다른 지표를 결합, 명확한 장기 추세에서만 사용 등입니다.
최적화 방향
더 많은 최적화를 할 수 있습니다.
-
더 나은 평형화를 위해 폐쇄, 이동 평균 등과 같은 다른 가격 소스를 시도
-
다른 제품에서 최적화를 위해 MA 및 BB 기간 매개 변수를 조정합니다.
-
더 직관적인 지표 값을 위해 민감도 계수 대신 비율 관계를 시도
-
신호 품질을 향상시키기 위해 트렌드 라인, 볼륨 등과 같은 다른 필터를 추가
-
지표 패턴에 기반한 단기 전략을 개발
-
더 나은 리스크 통제를 위해 스톱 로스 메커니즘을 포함합니다.
결론
전체적으로 이것은 트렌드를 따르는 전략으로 비교적 안정적인 트렌드입니다. 트렌드 방향을 결정하기 위해 동적 이동 평균, 폭발적인 지점을 식별하기 위해 BB, 잘못된 신호를 필터하기 위해 RSI를 사용하여 긴 트렌드 시스템을 실현합니다. 그러나 다른 제품과 시간 프레임에 대한 매개 변수 조정이 필요하며 하락 트렌드에서 이익을 얻을 수 없다는 몇 가지 위험도 있습니다. 더 나은 성능을 달성하기 위해 신호 품질을 향상시키고, 단기 전략을 개발하고, 스톱 로스를 추가하는 등 추가 개선이 가능합니다.
/*backtest
start: 2022-11-08 00:00:00
end: 2023-11-14 00:00:00
period: 1d
basePeriod: 1h
exchanges: [{"eid":"Futures_Binance","currency":"BTC_USDT"}]
*/

//@version=5

///////////Original Script Courtesy of Lazy_Bear.... Absolute Legend\\\\\\\\\\\\\\\

strategy('SmoothedWaddah', overlay=false, initial_capital=1)
sensitivity = input(150, title='Sensitivity')
fastLength = input(20, title='MacD FastEMA Length')
slowLength = input(40, title='MacD SlowEMA Length')
channelLength = input(20, title='BB Channel Length')
mult = input(1.5, title='BB Stdev Multiplier')
RSI14filter = input(40, title='RSI Value trade filter')

////////////MacD Calculation of price//////////////////////////////
calc_macd(source, fastLength, slowLength) =>
    fastMA = ta.ema(source, fastLength)
    slowMA = ta.ema(source, slowLength)
    fastMA - slowMA

/////////BolingerBand Calculation of Price///////////////////////
calc_BBUpper(source, length, mult) =>
    basis = ta.sma(source, length)
    dev = mult * ta.stdev(source, length)
    basis + dev

calc_BBLower(source, length, mult) =>
    basis = ta.sma(source, length)
    dev = mult * ta.stdev(source, length)
    basis - dev

//////heinkenashi chart call for closing price "smoothing mechanism"\\\\\\\\\\\\\\\\\\\\\\\\\\\
point = request.security(ticker.heikinashi(syminfo.tickerid), timeframe.period, close)

////////////////////T1 is change in MacD current  candle from previous candle Sensitivy amplifies calculation/////////////////////
t1 = (calc_macd(point, fastLength, slowLength) - calc_macd(point[1], fastLength, slowLength)) * sensitivity
//////////////////////T2 is  T1 from two candles prior\\\\\\\\\\\\\\\\\\\\\\\\\\\
t2 = (calc_macd(point[2], fastLength, slowLength) - calc_macd(point[3], fastLength, slowLength)) * sensitivity

////////////////E1 is difference in bolinger band upper and lower...E2 is E1 from one candle prior not needed//////////////
e1 = calc_BBUpper(ohlc4, channelLength, mult) - calc_BBLower(ohlc4, channelLength, mult)
//e2 = (calc_BBUpper(close[1], channelLength, mult) - calc_BBLower(close[1], channelLength, mult))

//////signal bar printing.. Up if MacD positive .. Down if MacD negative//////////
trendUp = t1 >= 0 ? t1 : 0
trendDown = t1 < 0 ? -1 * t1 : 0

///////plots difference in macD*Sensitivity, color change if increasing or decreasing.
//////color is green/lime if explosion is up \ color is red/orange if explosion is down/////////
plot(trendUp, style=plot.style_columns, linewidth=1, color=trendUp < trendUp[1] ? color.new(color.lime,45) : color.new(color.green,45), title='UpTrend')
plot(trendDown, style=plot.style_columns, linewidth=1, color=trendDown < trendDown[1] ? color.new(color.orange,45) : color.new(color.red,45), title='DownTrend')
plot(e1, style=plot.style_line, linewidth=2, color=color.new(#A0522D, 0), title='ExplosionLine')


////////////Entry conditions and Concept/////////////////////
////////////Long Only System. T1 is measuring the distance between MACD EMA's. This is Multiplied
////////////by the sensitivity so that it can be compared to the difference between BollingerBand.
/////////////{this could have been a ratio maybe i will work with that in a different script.}
/////////////I found that 135-175 sensitivy allows for values to be compared on most charts.....
////////////If the (difference between the EMA)*(Sensitivity) is greater than (BB upper line- BB lower line)
////////////it is considered an explosion in either the downside or the upside.The indicator will print
///////////a bar higher than the trigger line either green or red (up or down respectively)//////////////////

longCondition = trendUp > e1 and ta.rsi(close, 14) > RSI14filter
if longCondition
    strategy.entry('up', strategy.long)

strategy.close('up', trendDown > e1)
- 멀티 트렌드 전략
- 손익분기 가격 전략
- 단기 거래 전략의 추세
- BB21_SMA200 트렌드 다음 전략
- 모멘텀 이치모쿠 클라우드 거래 전략
- 주말 변동성 거래 전략
- 동력 분출 평균 역전 전략
- 변경된 OBV 및 MACD 양적 거래 전략
- 양량 흐름 지표 기반 트렌드 전략
- 높고 낮은 TEMA 평균의 오스실레이션 전략
- 평균 역전 동력 전략
- 에너지 지표 거래 전략의 추세
- 성장 생산자 - 전략에 따른 두 가지 RSI 트렌드
- 크로스 타임프레임 더블 브레이크업 레벨 전략
- 회전 회전 추후 트렌드를 따르는 전략
- MACD 트렌드 전략
- 이중 이동 평균 스토카스틱 지표 바이너리 옵션 거래 전략
- CCI의 강력한 돌파구 전략
- 이중 이동 평균 크로스오버 내일 선물 거래 전략
- 트렌드 브레이크 - 긴 그림자 전략