개요
이 전략은 다양한 지표를 사용하여 트렌드 방향을 파악하고, 트렌드 추적 방법을 사용하여 중간과 짧은 라인에서 트렌드 기회를 잡습니다. 전략은 트렌드를 추적하기 위해 특별히 설계되었으며, 승률을 높이고, 회귀를 줄이기 위해 고안되었습니다.
전략 원칙
WVAP를 사용하여 가격 비율을 결정합니다.
RSI 지표는 다공동성을 판단합니다.
QQE 지표는 가격 돌파구를 식별합니다.
ADX는 트렌드 강도를 판단합니다.
코랄 트렌드 인디케이터 (Coral Trend Indicator) 는 기초적인 움직임을 판단합니다.
LSMA 지표는 추세를 판단하는데 도움을 줍니다.
여러 지표 신호를 결합하여 거래 신호를 냅니다.
이 전략은 주로 RSI, QQE, ADX와 같은 여러 지표에 의존하여 트렌드 방향과 강도를 판단하고, Coral Trend Indicator의 곡선을 기본 트렌드 판단 기준으로 사용합니다. RSI와 같은 지표가 구매 신호를 발산 할 때, Coral Trend Indicator도 상승 곡선을 표시하면 상승 추세와 일치하는 확률이 높습니다.
전략적 이점
다중 지표 포지션은 판단의 정확성을 향상시킵니다.
트렌드 추적을 강조하고 수익률을 높여라.
트레이딩 레인지 시장에 대한 획기적인 분석을 통해
기본 지표와 결합하여 역전 거래를 피하십시오.
거래시간과 시계가 합리적으로 설정되어 위험을 줄여줍니다.
전략이 명확하고, 이해하기 쉽고, 최적화하기 쉽습니다.
이 전략의 가장 큰 장점은 여러 지표의 조합 판단으로, 단일 지표의 잘못된 판단의 확률을 어느 정도 줄일 수 있으며 판단의 정확도를 높일 수 있다. 또한, 트렌드 추적과 돌파구 아이디어를 강조하고, 근간에서 단선 기회를어내는 데 도움이 된다. 또한, 전략은 기본 지표를 추가하여 역경 조작을 피할 수 있다. 이러한 디자인은 전략의 안정성과 수익률을 높인다.
전략적 위험
“이런 일이 벌어진다면, 우리는 더 나은 기회를 얻을 수 있을 것이다.
철수 통제가 완벽하지 않아 철수 위험이 높습니다.
그리고 이 전략은 기본이 변할 때 신호를 놓칠 수 있습니다.
거래 비용을 고려하지 않고 실제 적용 시 수익률이 떨어질 위험이 있습니다.
이 전략의 가장 큰 위험은 다중 지표 조합 판단에 지연이 있을 수 있고, 이로 인해 최적의 입문 시기를 놓치게 되어 수익을 창출하는 공간을 영향을 미치게 된다. 또한, 전략의 회수 제어는 이상적이지 않으며, 회수 위험이 더 크다. 시장의 기본이 변하고 지표가 반영되지 않은 경우에도 손실이 발생할 수 있다. 실제 적용 시 거래 비용도 수익에 영향을 미칠 수 있다.
전략 최적화 방향
“이런 일이 벌어진다면, 우리는 더 많은 돈을 벌 수 있을 것이다.
지표 지연을 줄이기 위해 매개 변수 설정을 최적화합니다.
기초 지표의 사용과 정확성을 높여주기 위해
기계 학습 알고리즘과 결합하여 동적 변수 최적화를 구현한다.
이 전략의 최적화 초점은 회수 제어를 고려해야하며, 이동식 중지 손실 전략을 추가하여 수익을 잠금하고 회수를 줄일 수 있습니다. 동시에 매개 변수 설정을 최적화하여 지표 지연을 줄이고 시장 변화에 대한 전략의 민감성을 향상시킬 수 있습니다. 또한, 기본 판단 지표를 추가하여 정확성을 향상시킬 수 있습니다. 기계 학습 방법을 적용하면 매개 변수 동적 최적화를 구현할 수 있다면 전략 안정성도 크게 향상됩니다.
요약하다
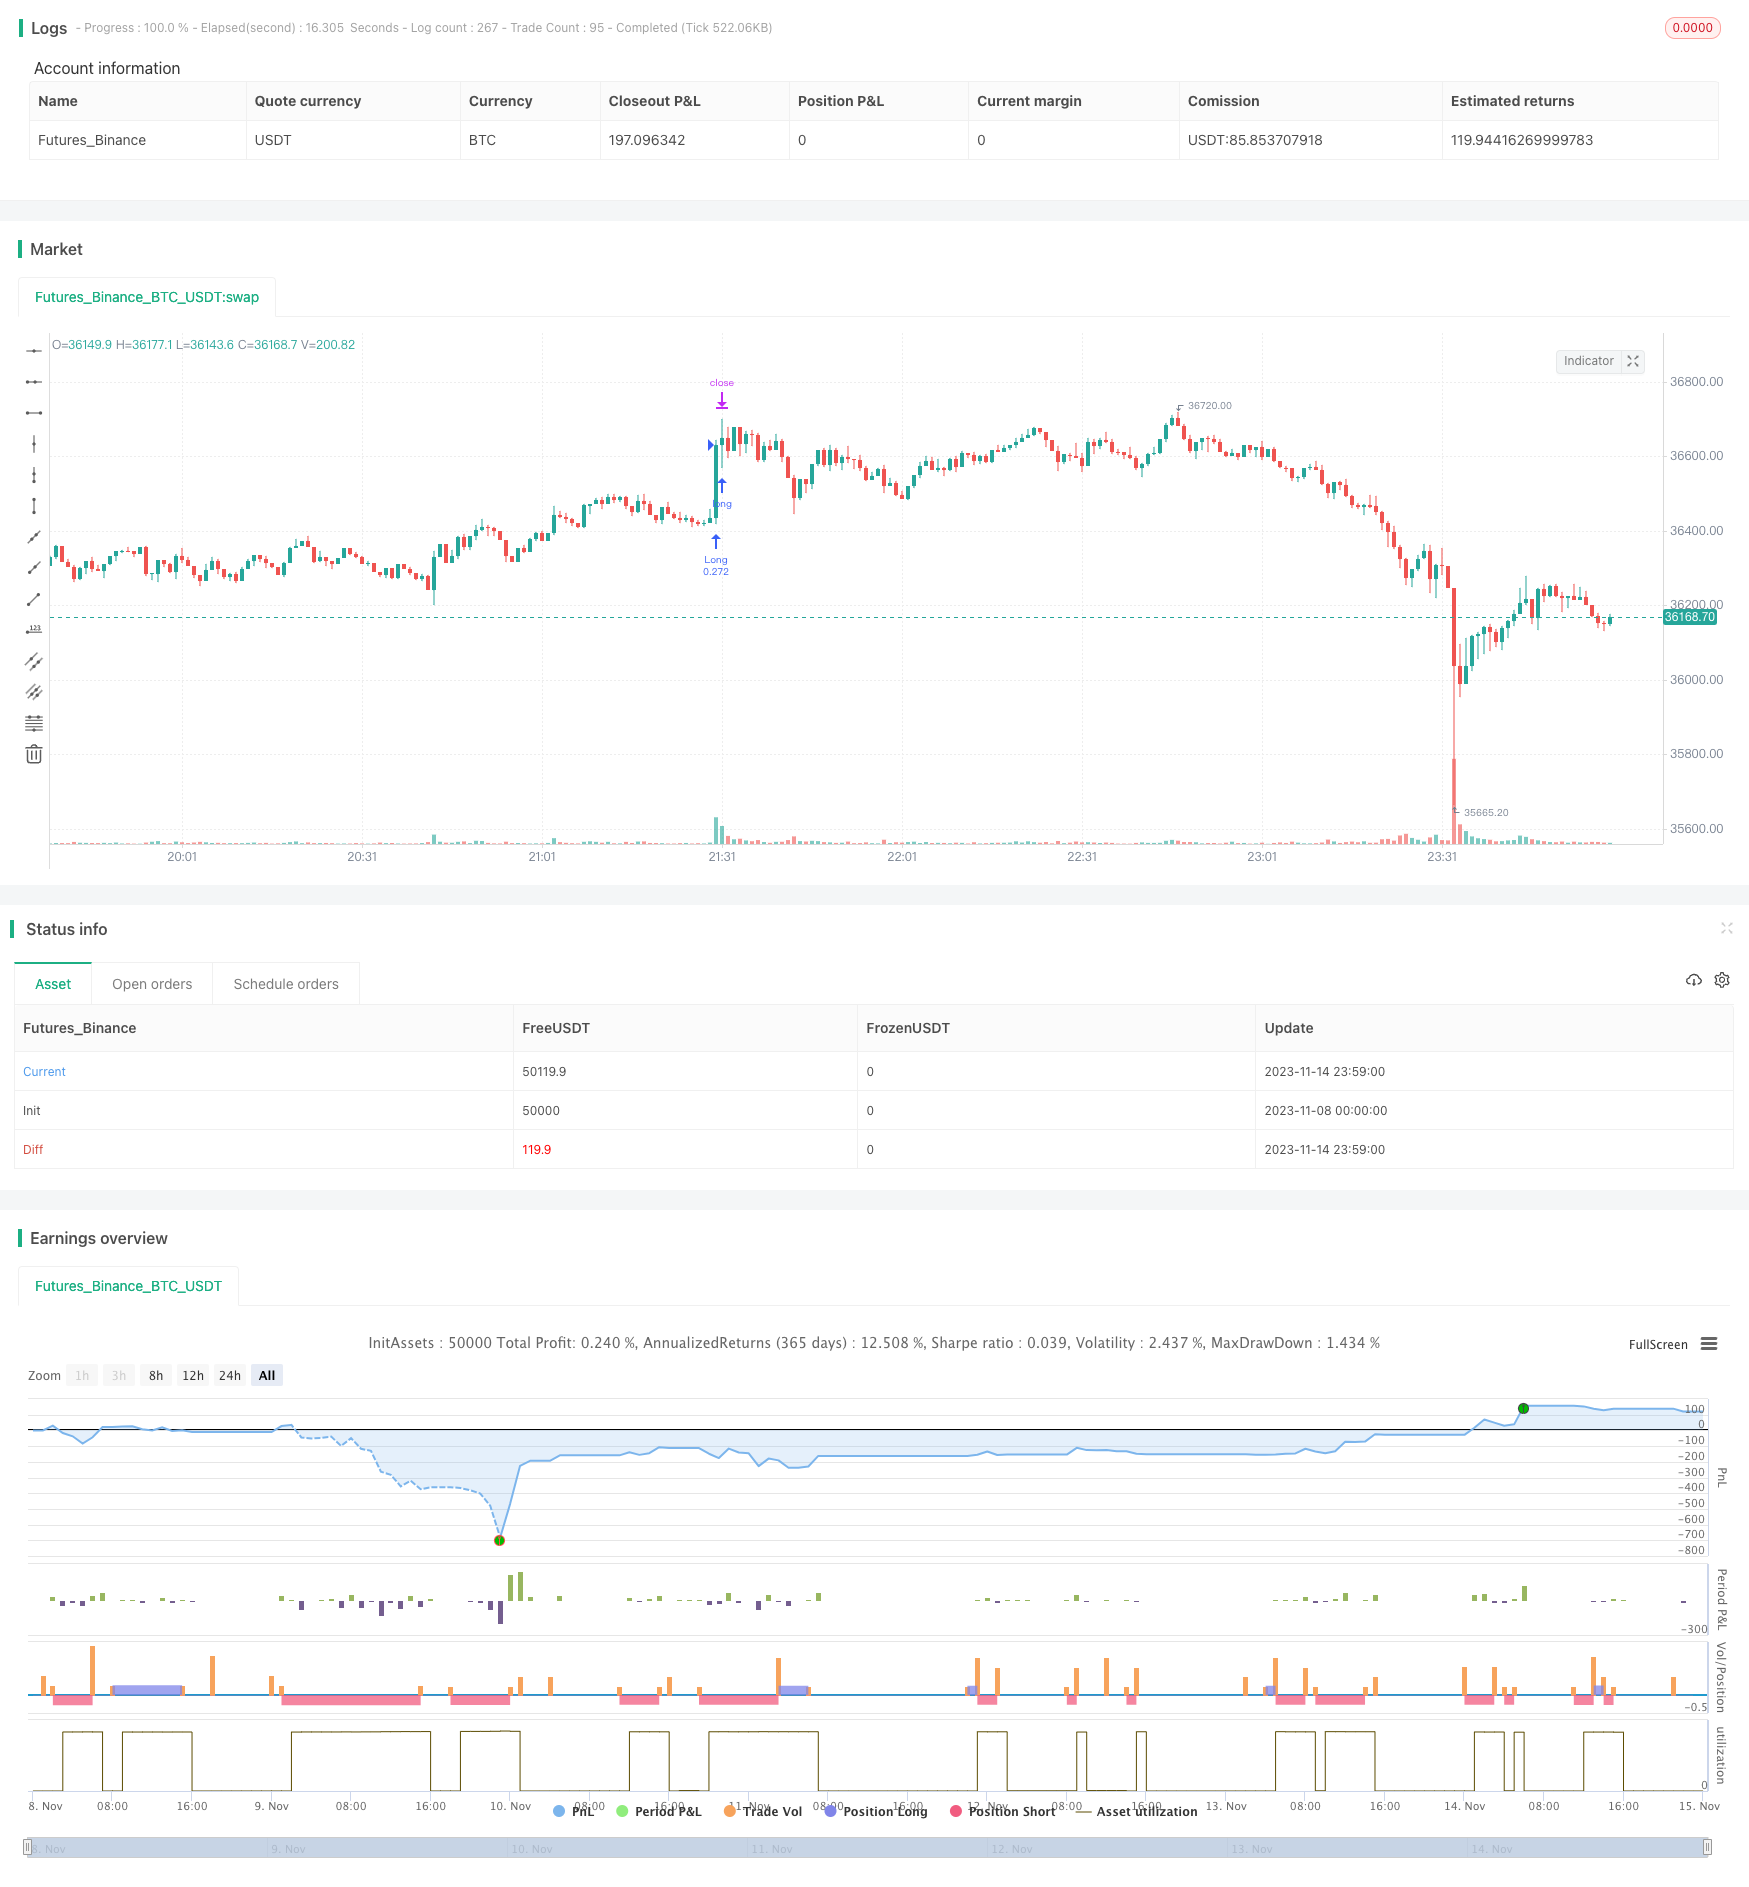
이 전략은 여러 지표들을 통합하여 트렌드 방향을 판단하고, 트렌드 추적 사고방식을 적용하여 판단의 정확도를 높이고, 수익률을 높이기 위한 목적으로 설계되었다. 전략은 지표 조합 판단, 트렌드 추적을 강조하고, 기본 요소를 결합하는 장점이 있지만, 잘못된 판단 시간 지연, 회수 제어 부족 등의 문제가 있다. 미래에는 최적화 매개 변수를 설정하고, 손해 방지 전략을 개선하고, 기본 지표를 추가하는 등의 방법으로 개선할 수 있으며, 전략은 실제 응용에서 더 나은 효과를 얻을 수 있다.
/*backtest
start: 2023-11-08 00:00:00
end: 2023-11-15 00:00:00
period: 1m
basePeriod: 1m
exchanges: [{"eid":"Futures_Binance","currency":"BTC_USDT"}]
*/

// This source code is subject to the terms of the Mozilla Public License 2.0 at https://mozilla.org/MPL/2.0/
// © RolandoSantos

//@version=4
strategy(title = "VWAP Candles Strategy", overlay=true, shorttitle = "VWAP Cndl",  default_qty_type=strategy.cash, default_qty_value=10000, initial_capital=10000)

//Make inputs that set the take profit %
longProfitPerc = input(title="Take Long Profit % ", minval=0.0, step=0.1, defval=0.3) / 100
shortProfitPerc = input(title="Take Short Profit % ", minval=0.0, step=0.1, defval=0.95) / 100

tp = input(100, "Take Profit % QTY (How much profit you want to take after take profit target is triggered)")

// Figure out take profit price
longExitPrice  = strategy.position_avg_price * (1 + longProfitPerc)
shortExitPrice  = strategy.position_avg_price * (1 - shortProfitPerc)

//Use NYSE for Copp Curve entries and exits//
security = input("", title="Change this if you want to see Copp Curve calculated for current ticker. All Copp Curve calculations are base on NYSE Composite")
ticker = security(security,"", close)

///Copp Curve////

period_ = input(21, title="Length", minval=1)
isCentered = input(false, title="Centered")
barsback = period_/2 + 1
ma = sma(close, period_)
dpo = isCentered ? close[barsback] - ma : close - ma[barsback]


instructions =input(title="Standard Copp settings are (10, 14, 11) however, DOUBLE these lengths as alternate settings to (20,28,22) and you will find it may produce better results, but less trades", defval="-")
wmaLength = input(title="WMA Length (Experiment changing this to longer lengths for less trades, but higher win %)", type=input.integer, defval=20)
longRoCLength = input(title="Long RoC Length", type=input.integer, defval=28)
shortRoCLength = input(title="Short RoC Length", type=input.integer, defval=22)
source = ticker
curve = wma(roc(source, longRoCLength) + roc(source, shortRoCLength), wmaLength)

//////////// QQE////////////QQE///////////////////QQE////////////////////////

// This source code is subject to the terms of the Mozilla Public License 2.0 at https://mozilla.org/MPL/2.0/
// © KivancOzbilgic

//@version=4
src=input(close)
length = input(25,"RSI Length", minval=1)
SSF=input(9, "SF RSI SMoothing Factor", minval=1)
showsignals = input(title="Show Crossing Signals?", type=input.bool, defval=true)
highlighting = input(title="Highlighter On/Off ?", type=input.bool, defval=true)
RSII=ema(rsi(src,length),SSF)
TR=abs(RSII-RSII[1])
wwalpha = 1/ length
WWMA = 0.0
WWMA := wwalpha*TR + (1-wwalpha)*nz(WWMA[1])
ATRRSI=0.0
ATRRSI := wwalpha*WWMA + (1-wwalpha)*nz(ATRRSI[1])
QQEF=ema(rsi(src,length),SSF)
QUP=QQEF+ATRRSI*4.236
QDN=QQEF-ATRRSI*4.236
QQES=0.0
QQES:=QUP<nz(QQES[1]) ? QUP : QQEF>nz(QQES[1]) and QQEF[1]<nz(QQES[1]) ? QDN :  QDN>nz(QQES[1]) ? QDN : QQEF<nz(QQES[1]) and QQEF[1]>nz(QQES[1]) ? QUP : nz(QQES[1])
//QQF=plot(QQEF,"FAST",color.maroon,2)
//QQS=plot(QQES,"SLOW",color=color.blue, linewidth=1)
buySignalr = crossover(QQEF, QQES)
sellSignalr = crossunder(QQEF, QQES)
buyr = QQEF > QQES


////QQE////////////////QQE/////////////////QQE/////////////////

//////////////LSMA//////////////////////////


//  LSMA 1 Settings & Plot
lsma1Length = input(100, minval=1, title="LSMA 1")
lsma1Offset = input(title="LSMA 1 Offset", type=input.integer, defval=0)
lsma1Source = input(close, title="LSMA 1 Source")
lsma1 = linreg(lsma1Source, lsma1Length, lsma1Offset)
lsma1_std_dev = stdev(abs(lsma1[1] - lsma1), lsma1Length)
//plot(lsma1, color=(lsma1 > lsma1[1] ? color.yellow : color.blue), title="LSMA 1", linewidth=2, transp=0)

////////////LSMA///////////////////


//////////////////ADX////////////////////

len = input(14)
th = input(20)

TrueRange = max(max(high-low, abs(high-nz(close[1]))), abs(low-nz(close[1])))
DirectionalMovementPlus = high-nz(high[1]) > nz(low[1])-low ? max(high-nz(high[1]), 0): 0
DirectionalMovementMinus = nz(low[1])-low > high-nz(high[1]) ? max(nz(low[1])-low, 0): 0

SmoothedTrueRange = 0.0
SmoothedTrueRange := nz(SmoothedTrueRange[1]) - (nz(SmoothedTrueRange[1])/len) + TrueRange

SmoothedDirectionalMovementPlus = 0.0
SmoothedDirectionalMovementPlus := nz(SmoothedDirectionalMovementPlus[1]) - (nz(SmoothedDirectionalMovementPlus[1])/len) + DirectionalMovementPlus

SmoothedDirectionalMovementMinus = 0.0
SmoothedDirectionalMovementMinus := nz(SmoothedDirectionalMovementMinus[1]) - (nz(SmoothedDirectionalMovementMinus[1])/len) + DirectionalMovementMinus

DIPlus = SmoothedDirectionalMovementPlus / SmoothedTrueRange * 100
DIMinus = SmoothedDirectionalMovementMinus / SmoothedTrueRange * 100
DX = abs(DIPlus-DIMinus) / (DIPlus+DIMinus)*100
ADX = sma(DX, len)

///////////////////ADX/////////////////////


/////////////sqz momentum/////////////////////////

//
// @author LazyBear & ChrisMoody complied by GIS_ABC
//
lengthBB = input(20, title="BB Length")
mult = input(2.0,title="BB MultFactor")
lengthKC=input(20, title="KC Length")
multKC = input(1.5, title="KC MultFactor")

useTrueRange = input(true, title="Use TrueRange (KC)")

// Calculate BB
sourceBB = close
basis = sma(sourceBB, lengthBB)
dev = multKC * stdev(source, lengthBB)
upperBB = basis + dev
lowerBB = basis - dev

// Calculate KC
maKC = sma(sourceBB, lengthKC)
rangeKC = useTrueRange ? tr : (high - low)
rangema = sma(rangeKC, lengthKC)
upperKC = maKC + rangema * multKC
lowerKC = maKC - rangema * multKC

sqzOn  = (lowerBB > lowerKC) and (upperBB < upperKC)
sqzOff = (lowerBB < lowerKC) and (upperBB > upperKC)
noSqz  = (sqzOn == false) and (sqzOff == false)

val = linreg(source  -  avg(avg(highest(high, lengthKC), lowest(low, lengthKC)),sma(close,lengthKC)),lengthKC,0)


////////////////////////////

/////// RSI on EMA/////////////////

lenrsi = input(13, minval=1, title="Length")
srcrsi = linreg(hlc3,100,0)
up = rma(max(change(srcrsi), 0), lenrsi)
down = rma(-min(change(srcrsi), 0), lenrsi)
rsi = down == 0 ? 100 : up == 0 ? 0 : 100 - (100 / (1 + up / down))
rsicolor = rsi > rsi[1] ? color.green : color.red
//plot(rsi,color = rsicolor)
//hline(20,color=color.green)
//hline(80,color=color.red)
vwaprsi = rsi(vwap(hlc3),13)
vwaprsicolor = vwaprsi > vwaprsi[1] ? color.blue : color.yellow
emarsi = ema(rsi,13)
emarsicolor = emarsi > emarsi[1] ? color.green : color.red
//plot(emarsi,color=emarsicolor)
//plot(vwaprsi,color=vwaprsicolor)

/////// RSI on VWMA/////////////////

lenrsiv = input(23, minval=1, title="Length RSI VWMA")
srcrsiv = vwma(linreg(close,23,0),23)
upv = rma(max(change(srcrsiv), 0), lenrsiv)
downv = rma(-min(change(srcrsiv), 0), lenrsiv)
rsiv = downv == 0 ? 100 : upv == 0 ? 0 : 100 - (100 / (1 + upv / downv))
rsicolorv = rsiv > rsiv[1] ? color.green : color.red

/////////////////////////////////////

/////////////////////////////////////

////////////////coral trend////////////////////
//
// @author LazyBear
// List of all my indicators:
// https://docs.google.com/document/d/15AGCufJZ8CIUvwFJ9W-IKns88gkWOKBCvByMEvm5MLo/edit?usp=sharing
//
//study(title="Coral Trend Indicator [LazyBear]", shorttitle="CTI_LB", overlay=true)
srcCT=close
i1 = 1.0
i2 = 1.0
i3 = 1.0
i4 = 1.0
i5 = 1.0
i6 = 1.0

sm =input(21, title="Smoothing Period")
cd = input(0.4, title="Constant D")
ebc=input(false, title="Color Bars")
ribm=input(false, title="Ribbon Mode")
di = (sm - 1.0) / 2.0 + 1.0
c1 = 2 / (di + 1.0)
c2 = 1 - c1
c3 = 3.0 * (cd * cd + cd * cd * cd)
c4 = -3.0 * (2.0 * cd * cd + cd + cd * cd * cd)
c5 = 3.0 * cd + 1.0 + cd * cd * cd + 3.0 * cd * cd
i1 := c1*srcCT + c2*nz(i1[1])
i2 := c1*i1 + c2*nz(i2[1])
i3 := c1*i2 + c2*nz(i3[1])
i4 := c1*i3 + c2*nz(i4[1])
i5 := c1*i4 + c2*nz(i5[1])
i6 := c1*i5 + c2*nz(i6[1])

bfr = -cd*cd*cd*i6 + c3*(i5) + c4*(i4) + c5*(i3)
// --------------------------------------------------------------------------
// For the Pinescript coders: Determining trend based on the mintick step.
// --------------------------------------------------------------------------
//bfrC = bfr - nz(bfr[1]) > syminfo.mintick ? green : bfr - nz(bfr[1]) < syminfo.mintick ? red : blue
//bfrC = bfr > nz(bfr[1]) ? green : bfr < nz(bfr[1])  ? red : blue
//tc=ebc?gray:bfrC
//plot(ribm?na:bfr, title="Trend", linewidth=3)
//bgcolor(ribm?bfrC:na, transp=50)
//barcolor(ebc?bfrC:na)
////////////////////////////////////////////////////////////////

///////////////////VWAP///////////////////


//------------------------------------------------

//------------------------------------------------
NormalVwap=vwap(hlc3)
H = vwap(high)
L = vwap(low)
O = vwap(open)
C = vwap(close)

left = 30

left_low = lowest(left)
left_high = highest(left)
newlow = low <= left_low
newhigh = high >= left_high

q = barssince(newlow)
w = barssince(newhigh)
col2 = q < w ?  #8B3A3A : #9CBA7F
col2b=O > C?color.red:color.lime


AVGHL=avg(H,L)
AVGOC=avg(O,C)
col=AVGHL>AVGOC?color.lime:color.red
col3=open > AVGOC?color.lime:color.red
//plotcandle(O,H,L,C,color=col2b)
//plot(H, title="VWAP", color=red)
//plot(L, title="VWAP", color=lime)
//plot(O, title="VWAP", color=blue)
//plot(C, title="VWAP", color=black)

//plot(NormalVwap, color=col2b)


/////////////////////////////////////////////////////////////////////////////


///Trade Conditions///
t = time(timeframe.period, "0930-1500")

long = vwaprsi > vwaprsi[1] and rsi>rsi[1] and vwaprsi < 20 //vwaprsi > 98 and rsi > 50 and rsi[1] < rsi and rsi[1] < rsi[2] //crossover(rsi,20)//O<C  and O > linreg(hlc3,100,0) and linreg(hlc3,100,0) > linreg(hlc3,100,0)[1] and AVGHL>AVGOC and t //O < C  and close > vwap(hlc3) and ADX > ADX[1]  //and val > nz(val[1]) and close > vwap(hlc3) and open > sma(close,23) and close > vwap(hlc3)  and t  //and rsi > rsi[1] and open > ema(close,13) and open > bfr and bfr > bfr[1]
close_long = crossover(vwaprsi,99.8)  //C < O // linreg(hlc3,100,0) and linreg(hlc3,100,0) < linreg(hlc3,100,0)[1] //O > C and val < nz(val[1]) // and close < vwap(hlc3)
close_short = rsiv > rsiv[1] and rsiv[2] > rsiv[1]//vwaprsi > vwaprsi[1] or rsi > rsi[1] // vwaprsi > 99 and rsi > 99 and rsi > rsi[1] and vwaprsi > vwaprsi[1]//vwaprsi > vwaprsi[1] and rsi>rsi[1] and vwaprsi < 20 //vwaprsi > 98 and rsi > 50 and rsi[1] < rsi and rsi[1] < rsi[2] //crossover(rsi,20)//O<C  and O > linreg(hlc3,100,0) and linreg(hlc3,100,0) > linreg(hlc3,100,0)[1] and AVGHL>AVGOC and t //O < C  and close > vwap(hlc3) and ADX > ADX[1]  //and val > nz(val[1]) and close > vwap(hlc3) and open > sma(close,23) and close > vwap(hlc3)  and t  //and rsi > rsi[1] and open > ema(close,13) and open > bfr and bfr > bfr[1]
short = rsiv > 95 and rsiv < rsiv[1] and rsiv[2] < rsiv[1] //vwaprsi < 1 and rsi < 1 and rsi < rsi[1] and vwaprsi < vwaprsi[1] and t //crossover(vwaprsi,99.8)  //C < O // linreg(hlc3,100,0) and linreg(hlc3,100,0) < linreg(hlc3,100,0)[1] //O > C and val < nz(val[1]) // and close < vwap(hlc3)

//long = vwaprsi > vwaprsi[1] and emarsi > emarsi[1] and emarsi[2] > emarsi[1] and ADX > 25//O<C  and O > linreg(hlc3,100,0) and linreg(hlc3,100,0) > linreg(hlc3,100,0)[1] and AVGHL>AVGOC and t //O < C  and close > vwap(hlc3) and ADX > ADX[1]  //and val > nz(val[1]) and close > vwap(hlc3) and open > sma(close,23) and close > vwap(hlc3)  and t  //and rsi > rsi[1] and open > ema(close,13) and open > bfr and bfr > bfr[1]
//close_long = vwaprsi < vwaprsi[1] or emarsi < emarsi[1]//C < O // linreg(hlc3,100,0) and linreg(hlc3,100,0) < linreg(hlc3,100,0)[1] //O > C and val < nz(val[1]) // and close < vwap(hlc3)
//close_long = O>C  or lsma1 < H  //  or O > linreg(hlc3,100,0) //and linreg(hlc3,100,0) > linreg(hlc3,100,0)[1] and AVGHL>AVGOC and t //O < C  and close > vwap(hlc3) and ADX > ADX[1]  //and val > nz(val[1]) and close > vwap(hlc3) and open > sma(close,23) and close > vwap(hlc3)  and t  //and rsi > rsi[1] and open > ema(close,13) and open > bfr and bfr > bfr[1]
//long = rsi > rsi[1] and rsi[1] >rsi[2] and lsma1 > lsma1[1] and bfr > bfr[1] and O<C and lsma1 > L  and close > close[1] and ADX > ADX[1] and ADX[1] > ADX[2] and ADX > 20 and rsi > rsi[1] and t   // linreg(hlc3,100,0) and linreg(hlc3,100,0) < linreg(hlc3,100,0)[1] //O > C and val < nz(val[1]) // and close < vwap(hlc3)

//close_short = O<C  or lsma1 > H  //  or O > linreg(hlc3,100,0) //and linreg(hlc3,100,0) > linreg(hlc3,100,0)[1] and AVGHL>AVGOC and t //O < C  and close > vwap(hlc3) and ADX > ADX[1]  //and val > nz(val[1]) and close > vwap(hlc3) and open > sma(close,23) and close > vwap(hlc3)  and t  //and rsi > rsi[1] and open > ema(close,13) and open > bfr and bfr > bfr[1]
//short = rsi < rsi[1] and rsi[1] <rsi[2] and lsma1 < lsma1[1] and bfr < bfr[1] and O>C and lsma1 < L  and close < close[1] and ADX > ADX[1] and ADX[1] > ADX[2] and ADX > 20 and rsi < rsi[1] and t   // linreg(hlc3,100,0) and linreg(hlc3,100,0) < linreg(hlc3,100,0)[1] //O > C and val < nz(val[1]) // and close < vwap(hlc3)


/// Start date
startDate = input(title="Start Date", defval=1, minval=1, maxval=31)
startMonth = input(title="Start Month", defval=1, minval=1, maxval=12)
startYear = input(title="Start Year", defval=2021, minval=1800, maxval=2100)


// See if this bar's time happened on/after start date
afterStartDate = true


///Entries and Exits//
if (long and afterStartDate)
    strategy.entry("Long", strategy.long, comment = "Open Long")
//    strategy.close("Short", strategy.short,qty_percent=100, comment = "close Short")
if (short and afterStartDate)
    strategy.entry("Short", strategy.short, comment = "Open Short")


if (close_long and afterStartDate  )
    strategy.close("Long", strategy.long, qty_percent=100, comment="close Long")
//    strategy.entry("Short", strategy.short, comment="Open Short")

if (close_short and afterStartDate  )
    strategy.close("Short", strategy.short, qty_percent=100, comment="close Long")

if ( hour(time) == 15 and minute(time) > 15 )
    strategy.close_all()


//Submit exit orders based on take profit price
if (strategy.position_size > 0 and afterStartDate)
    strategy.exit(id="Long", qty_percent=tp, limit=longExitPrice)

if (strategy.position_size < 0 and afterStartDate)
    strategy.exit(id="Short", qty_percent=tp, limit=shortExitPrice)