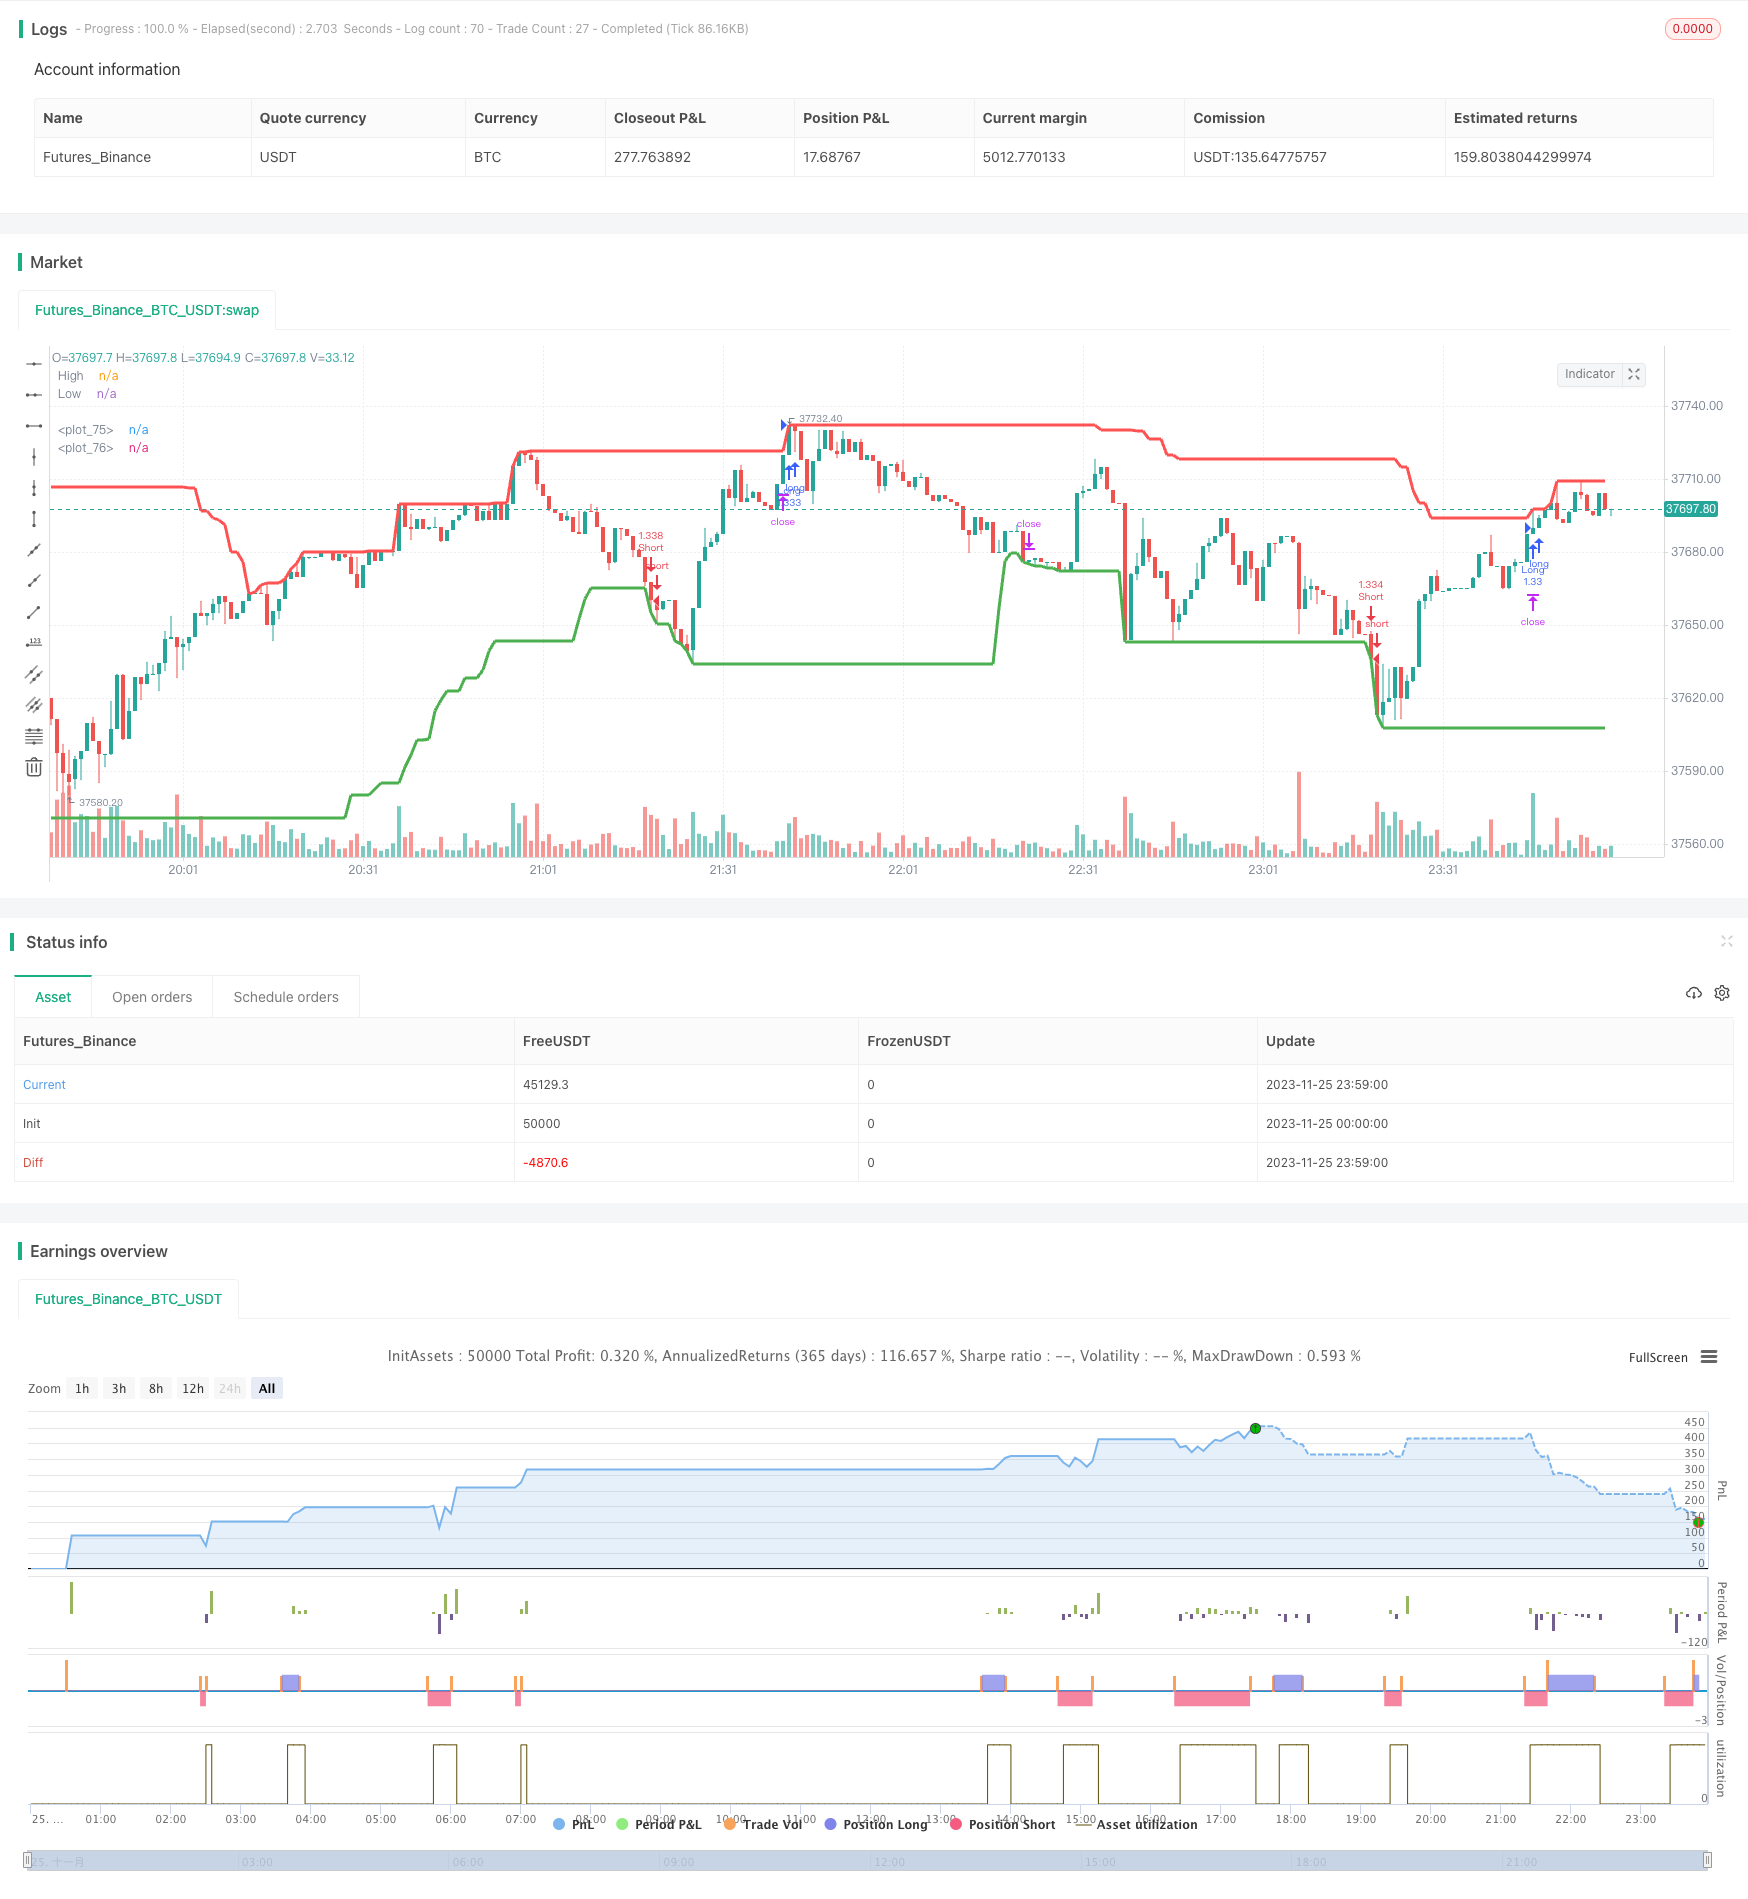
개요
높낮이 돌파 재측정 전략은 주식의 역사적인 높낮이를 이용해서 가격이 이러한 높낮이를 돌파했는지 판단하는 트렌드 추적 전략이다. 그것은 일정 기간 동안의 최고 가격과 최저 가격을 계산하여, 현재 주기의 가격이 가장 최근의 특정 주기 최고 가격을 초과할 때, 구매 신호를 발생시키고, 가격이 가장 최근의 특정 주기 최저 가격을 넘어설 때, 판매를 발생시킨다. 신호 전략은 추세 추적 전략의 일종으로, 주식 가격의 추세적 특성을 포착할 수 있으며, 실질적인 전투 가치가 있다.
전략 원칙
이 전략의 핵심 논리는 일정 기간 동안의 최고 가격과 최저 가격을 계산하는 것이다. 최고 가격과 최저 가격을 계산할 때, 폐쇄 가격이나 최고 가격과 최저 가격을 사용하거나, 현재 K 선의 폐쇄 가격 또는 최고 가격이 최근 일정 기간 동안의 최고 가격보다 높지 않은지 판단하고, 만약 그렇다면, 상위 최고 가격과 거리가 있는 경우, 구매 신호를 발생시킨다.
구매 신호가 생성되면, 전략은 그 가격에 구매하고, 중지 가격과 중지 가격을 설정한다. 가격이 중지 가격에 닿으면, 전략은 중단한다. 가격이 중지 가격에 닿으면, 전략은 중단한다. 판매 신호의 논리 또한 비슷하다.
우위 분석
이 전략은 다음과 같은 장점을 가지고 있습니다.
- 전략의 논리는 간단하고 이해하기 쉽고 실행이 쉽다.
- 주식 가격의 트렌드적 특성을 파악할 수 있고, 가격 추세에 따라 움직일 수 있다.
- Finding 파라미터를 조정하여 가장 적합한 정책 파라미트 조합을 조정할 수 있습니다.
- 내장된 손해 방지 및 차단 메커니즘으로 위험을 통제할 수 있다.
- 시각화 된 표시는 파라미터 조정 및 결과 분석을 매우 편리하게 합니다.
위험 분석
이 전략에는 몇 가지 위험도 있습니다.
- 반복적인 거래와 과도한 거래가 발생할 수 있습니다.
- 가격의 변동이 있을 때, 거래가 자주 열립니다.
- 지표가 적절하지 않아 큰 트렌드 기회를 놓칠 수 있습니다.
- 주가 변동의 빈도와 폭을 고려하지 않고
- 다른 지표와 결합되지 않고 신호를 검증한다.
이러한 위험을 통제하기 위해, 다음과 같은 몇 가지 측면에서 최적화할 수 있습니다.
- 적당히 스톱로스를 줄이고 지분 시간을 늘리십시오.
- 포지션 개설 조건을 늘리고, 포지션 개설 빈번함을 방지한다.
- 최적화 변수, 최적의 변수 조합을 찾습니다.
- 다른 지표와 함께 필터링 신호.
최적화 방향
고저 돌파 회귀 전략은 다음과 같은 측면에서 최적화 될 수 있습니다.
매개 변수 최적화: 다양한 매개 변수 조합을 보다 체계적으로 테스트하여 최적의 매개 변수를 찾을 수 있다.
다른 지표와 함께 필터링 신호. 예를 들어, 이동 평균 지표와 결합 할 수 있으며, 가격이 최고 가격을 돌파하고 단기 이동 평균에 장기 이동 평균을 통과 할 때만 구매 신호가 발생합니다.
주가 변동의 빈도를 고려한다. 예를 들어 ATR 지표와 결합하여 주가 변동이 증가하면 돌파의 폭을 적절히 완화 할 수 있다.
트렌드시장과 흔들림시장을 구분한다. 트렌드가 뚜렷한 단계에서, 트렌드를 추적하기 위해 파라미터를 적절히 완화한다. 흔들림시장에서, 적절한 강화 파라미터를한다.
포지션 관리 메커니즘을 추가한다. 예를 들어 손실이 일정 비율에 도달했을 때 포지션을 중지한다.
요약하다
전체적으로 볼 때, 고저 돌파 재측정 전략은 간단한 실용적인 트렌드 추적 전략이다. 그것은 가격이 일정 기간의 최고 가격과 최저 가격을 돌파했는지 판단하여 거래 신호를 결정한다. 이 전략은 단순하고, 트렌드 추적, 변수 최적화 등의 장점이 있지만, 과다 거래가 발생하고, 불안한 시장을 처리 할 수 없는 위험도 존재한다. 우리는 변수 최적화, 지표 필터링, 포지션 관리 등 여러 측면에서 이 전략에 대한 최적화를 통해 그 효과를 더욱 향상시킬 수 있다.
/*backtest
start: 2023-11-25 00:00:00
end: 2023-11-26 00:00:00
period: 1m
basePeriod: 1m
exchanges: [{"eid":"Futures_Binance","currency":"BTC_USDT"}]
*/

//@version=3
strategy("High/Low Breaker Backtest 1.0", overlay=true, initial_capital=1000, default_qty_type=strategy.percent_of_equity, default_qty_value=100, max_bars_back=700)

// Strategy Settings
takeProfitPercentageLong = input(.1, title='Take Profit Percentage Long', type=float)/100
stopLossPercentageLong = input(0.15, title='Stop Loss Percentage Long', type=float)/100
takeProfitPercentageShort = input(.1, title='Take Profit Percentage Short', type=float)/100
stopLossPercentageShort = input(0.15, title='Stop Loss Percentage Short', type=float)/100


candlesBack = input(title="Number of candles back",  defval=50)
useHighAndLows =  input(true, title="Use high and lows (uncheck to use close)", defval=true)
lastBarsBackMinimum =  input(title="Number of candles back to ignore for last high/low",  defval=30)
showHighsAndLows = input(true, title="Show high/low lines", defval=true)

getIndexOfLowestInSeries(series, period) =>
    index = 0
    current = series
    for i = 1 to period
        if series[i] <= current
            index := i
            current := series[i]
    index

getIndexOfHighestInSeries(series, period) =>
    index = 0
    current = series
    for i = 1 to period
        if series[i] >= current
            index := i
            current := series[i]
    index

indexOfHighestInRange = getIndexOfHighestInSeries(useHighAndLows ? high : close, candlesBack)
indexOfLowestInRange = getIndexOfLowestInSeries(useHighAndLows ? low : close, candlesBack)

max = useHighAndLows ? high[indexOfHighestInRange] : close[indexOfHighestInRange]
min = useHighAndLows ? low[indexOfLowestInRange] : close[indexOfLowestInRange]

barsSinceLastHigh = indexOfHighestInRange
barsSinceLastLow = indexOfLowestInRange

isNewHigh = (useHighAndLows ? high > max[1] : close > max[1]) and (barsSinceLastHigh[1] + 1 > lastBarsBackMinimum)
isNewLow = (useHighAndLows ? low < min[1] : close < min[1]) and (barsSinceLastLow[1] + 1 > lastBarsBackMinimum)

alertcondition(condition=isNewHigh, title="New High", message="Last High Broken")
alertcondition(condition=isNewLow, title="New Low", message="Last Low Broken")

if high > max
    max := high
    barsSinceLastHigh := 0

if low < min
    min := low
    barsSinceLastLow := 0

plot( showHighsAndLows ? max : na, color=red, style=line, title="High", linewidth=3)
plot( showHighsAndLows ? min : na, color=green, style=line, title="Low", linewidth=3)

// Strategy Entry/Exit Logic
goLong =isNewHigh
longStopLevel = strategy.position_avg_price * (1 - stopLossPercentageLong)
longTakeProfitLevel = strategy.position_avg_price * (1 + takeProfitPercentageLong)

goShort = isNewLow
shortStopLevel = strategy.position_avg_price * (1 + stopLossPercentageShort)
shortTakeProfitLevel = strategy.position_avg_price * (1 - takeProfitPercentageShort)

strategy.entry("Long", strategy.long, when=goLong)
strategy.exit("Long Exit", "Long", stop=longStopLevel, limit=longTakeProfitLevel)

strategy.entry("Short", strategy.short, when=goShort)
strategy.exit("Short Exit", "Short", stop=shortStopLevel, limit=shortTakeProfitLevel)

plot(goShort ? shortStopLevel : na, color=yellow, style=linebr, linewidth=2)
plot(goShort ? shortTakeProfitLevel : na, color=blue, style=linebr, linewidth=2)
plot(goLong ? longStopLevel : na, color=yellow, style=linebr, linewidth=2)
plot(goLong ? longTakeProfitLevel : na, color=blue, style=linebr, linewidth=2)