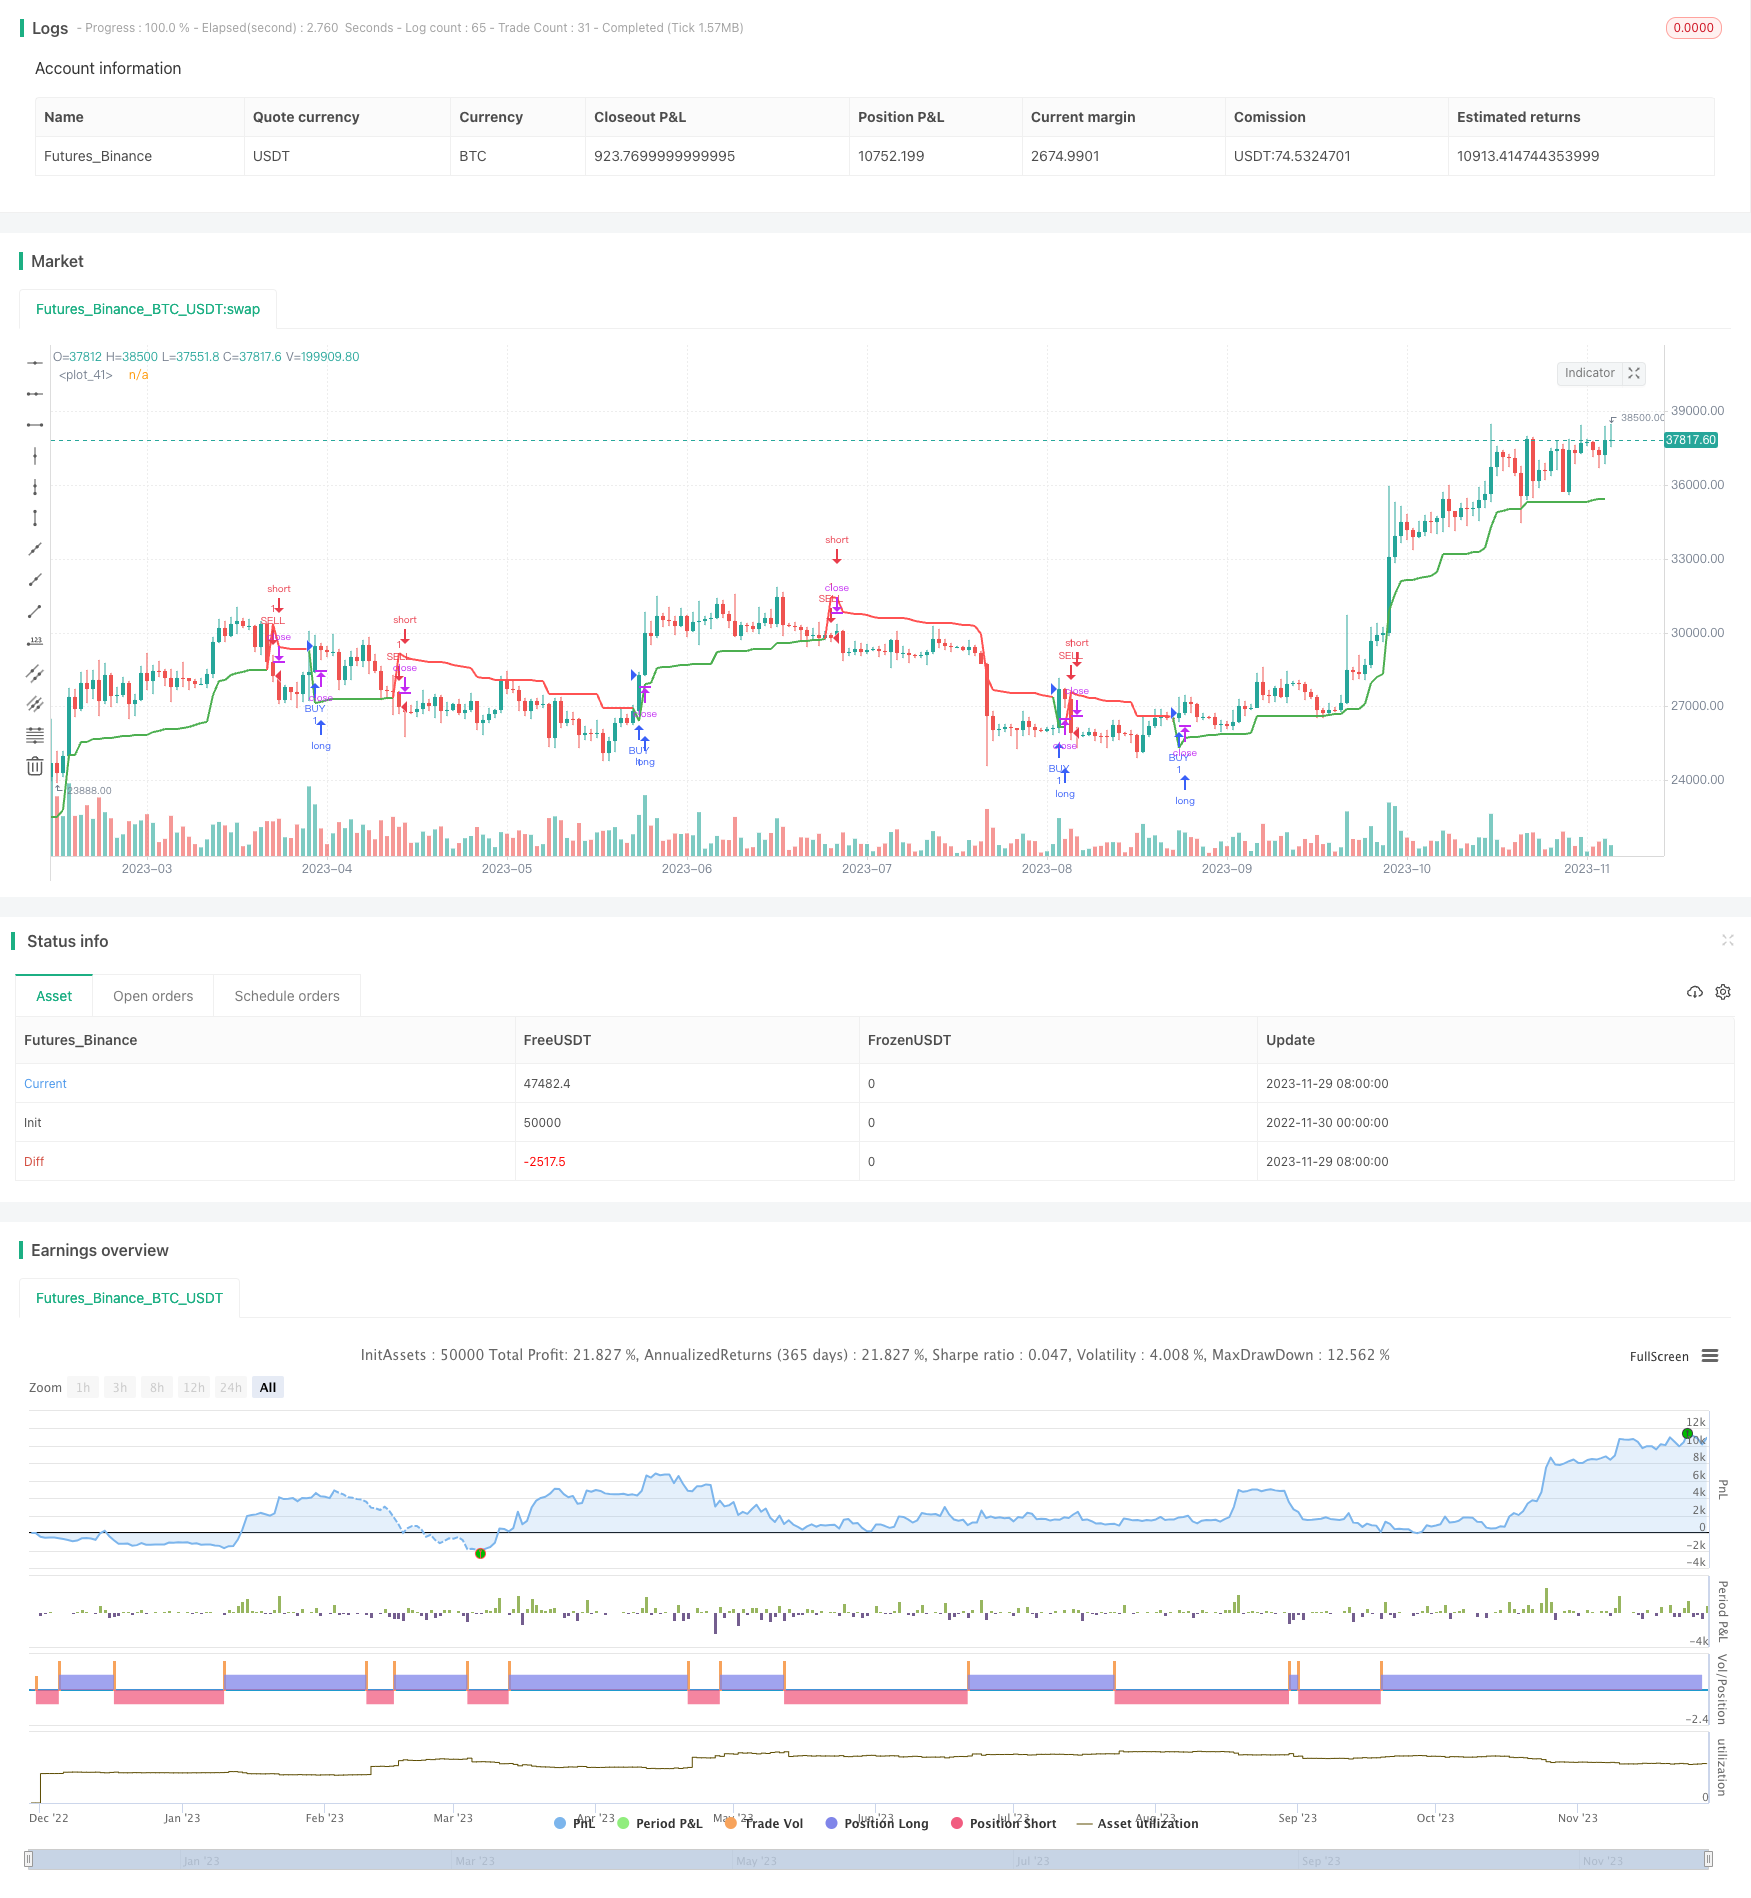
개요
이 전략은 가격 변동성에 기반한 트렌드 추적 스톱 로드 전략이다. 그것은 평균 실제 변동의 폭을 이용해서 가격 변동에 대한 스톱 로드를 설정한다. ATR은 가격의 변동성과 위험 수준을 반영한다. 가격이 스톱 로드를 초과할 때 이 전략은 트렌드가 변하는 것을 판단하고 그에 따른 상장 또는 스톱 로드 작업을 수행한다.
전략 원칙
이 전략은 먼저 일정 주기 동안의 평균 실제 변동폭 ATR를 계산한다. 그리고는 현재 가격 트렌드 방향에 따라, 상승 추세라면, 스톱 라인을 현재 최고 가격에서 n배의 ATR을 빼고; 하향 추세라면, 스톱 라인을 현재 최저 가격에 n배의 ATR을 더한다. 이 중 n값은 스톱 라인과 가격의 거리를 제어하기 위해 파라미터를 통해 조정할 수 있다.
가격이 상승 경향의 스톱 라인을 넘어섰을 때 또는 하락 경향의 스톱 라인을 뚫었을 때, 트렌드가 전환되었다는 것을 판단하십시오. 이 때 전략은 포지션 스톱을 청산하고 새로운 트렌드 방향에 따라 새로운 스톱 라인을 설정합니다.
전반적으로, 이 전략은 가격 변동성을 활용하여 스톱 라인을 설정하여 트렌드 전환을 정확하게 판단하는 능력을 구현합니다. 트렌드가 바뀌면 적시에 스톱하는 것이 새로운 트렌드 방향을 파악하는 데 도움이됩니다.
전략적 이점
- 가격 변동성 특성을 사용하여 추세를 판단하고 가격 전환점을 정확하게 파악합니다.
- 적당시에 상쇄 및 전환하여 역전 위험을 줄이십시오.
- 변수 조정 유연성으로 스톱 라인 및 가격 변동의 거리를 제어할 수 있습니다.
- 특정 품종의 매개 변수에 따라 조정할 수 있으며, 강한 적응력을 가지고 있다.
전략적 위험
- 유효하지 않은 돌파구로 인한 잘못된 판단 위험. 가격이 지속될 수 없는 유효하지 않은 돌파구가 발생할 수 있으며, 이는 잘못된 판단 경향의 전환을 초래할 수 있습니다.
- 파라미터를 너무 급진적으로 설정하면 손실이 커질 수 있다. 예를 들어 n 값이 너무 커지면 스톱 라인이 너무 가까워서 작은 흔들림이 발생할 수 있다.
- urrencies와 같은 낮은 변동성 품종의 중지 효과는 좋지 않을 수 있다. ATR 값이 작을 때 중지 라인은 가격에 더 가깝다.
전략 최적화
- 거래량이나 변동 가속도와 같은 보조 지표가 도입될 수 있으며, 유효하지 않은 돌파구를 방지하는 잘못된 판단이 가능합니다.
- 다른 품종의 특성에 따라 n의 값을 조정하여 스탠드 거리를 더 적절하게 만듭니다.
- ATR 주기는 또한 최적화 될 수 있으며, 가격 차이의 변동률을 판단하는 가장 적합한 주기 변수를 선택합니다.
요약하다
이 전략은 전반적으로 가격 변동성에 기반한 스톱 라인을 설정하는 알고리즘 구현이다. 가격 움직임을 판단하는 정확도가 높으며, 트렌드의 중요한 전환점을 잡을 수 있다. 동시에 특정 파라미터 공간을 조정할 수 있도록 제공하고, 적응력이 강하다. 스톱 전략으로서, 이는 시세 반전의 위험을 효과적으로 회피할 수 있으며, 실물에서 적용할 가치가 있다.
/*backtest
start: 2022-11-30 00:00:00
end: 2023-11-30 00:00:00
period: 1d
basePeriod: 1h
exchanges: [{"eid":"Futures_Binance","currency":"BTC_USDT"}]
*/

// This source code is subject to the terms of the Mozilla Public License 2.0 at https://mozilla.org/MPL/2.0/
// © laptevmaxim92

//@version=4
strategy("Volatility stop strategy", overlay=true)

length = input(20)
mult = input(2, step = 0.1)
utp = input(false, "Use take profit?")
pr = input(100, "Take profit pips")
usl = input(false, "Use stop loss?")
sl = input(100, "Stop loss pips")
fromday = input(01, defval=01, minval=01, maxval=31, title="From Day")
frommonth = input(01, defval=01, minval= 01, maxval=12, title="From Month")
fromyear = input(2000, minval=1900, maxval=2100, title="From Year")
today = input(31, defval=01, minval=01, maxval=31, title="To Day")
tomonth = input(12, defval=12, minval=01, maxval=12, title="To Month")
toyear = input(2039, minval=1900, maxval=2100, title="To Year")

use_date = (time > timestamp(fromyear, frommonth, fromday, 00, 00) and time < timestamp(toyear, tomonth, today, 00, 00))

atr_ = atr(length)
max_ = 0.0
min_ = 0.0
max1 = 0.0
max1 := max(nz(max_[1]), close)
min1 = 0.0
min1 := min(nz(min_[1]), close)
vstop = 0.0
is_uptrend = false
is_uptrend_prev = false
is_uptrend_prev := nz(is_uptrend[1], true)
stop = is_uptrend_prev ? max1 - mult * atr_ : min1 + mult * atr_
vstop_prev = nz(vstop[1])
vstop1 = is_uptrend_prev ? max(vstop_prev, stop) : min(vstop_prev, stop)
is_uptrend := close - vstop1 >= 0
is_trend_changed = is_uptrend != is_uptrend_prev
max_ := is_trend_changed ? close : max1
min_ := is_trend_changed ? close : min1
vstop := is_trend_changed ? is_uptrend ? max_ - mult * atr_ : min_ + mult * atr_ : vstop1
plot(vstop, color = is_uptrend ? color.green : color.red, linewidth=2)

longCondition = is_uptrend
if (longCondition and use_date)
    strategy.entry("BUY", strategy.long)

shortCondition = not is_uptrend
if (shortCondition and use_date)
    strategy.entry("SELL", strategy.short)

if (utp and not usl)
    strategy.exit("TP", "BUY", profit = pr)
    strategy.exit("TP", "SELL", profit = pr)

if (usl and not utp)
    strategy.exit("SL", "BUY", loss = sl)
    strategy.exit("SL", "SELL", loss = sl)

if (usl and utp)
    strategy.exit("TP/SL", "BUY", loss = sl, profit = pr)
    strategy.exit("TP/SL", "SELL", loss = sl, profit = pr)