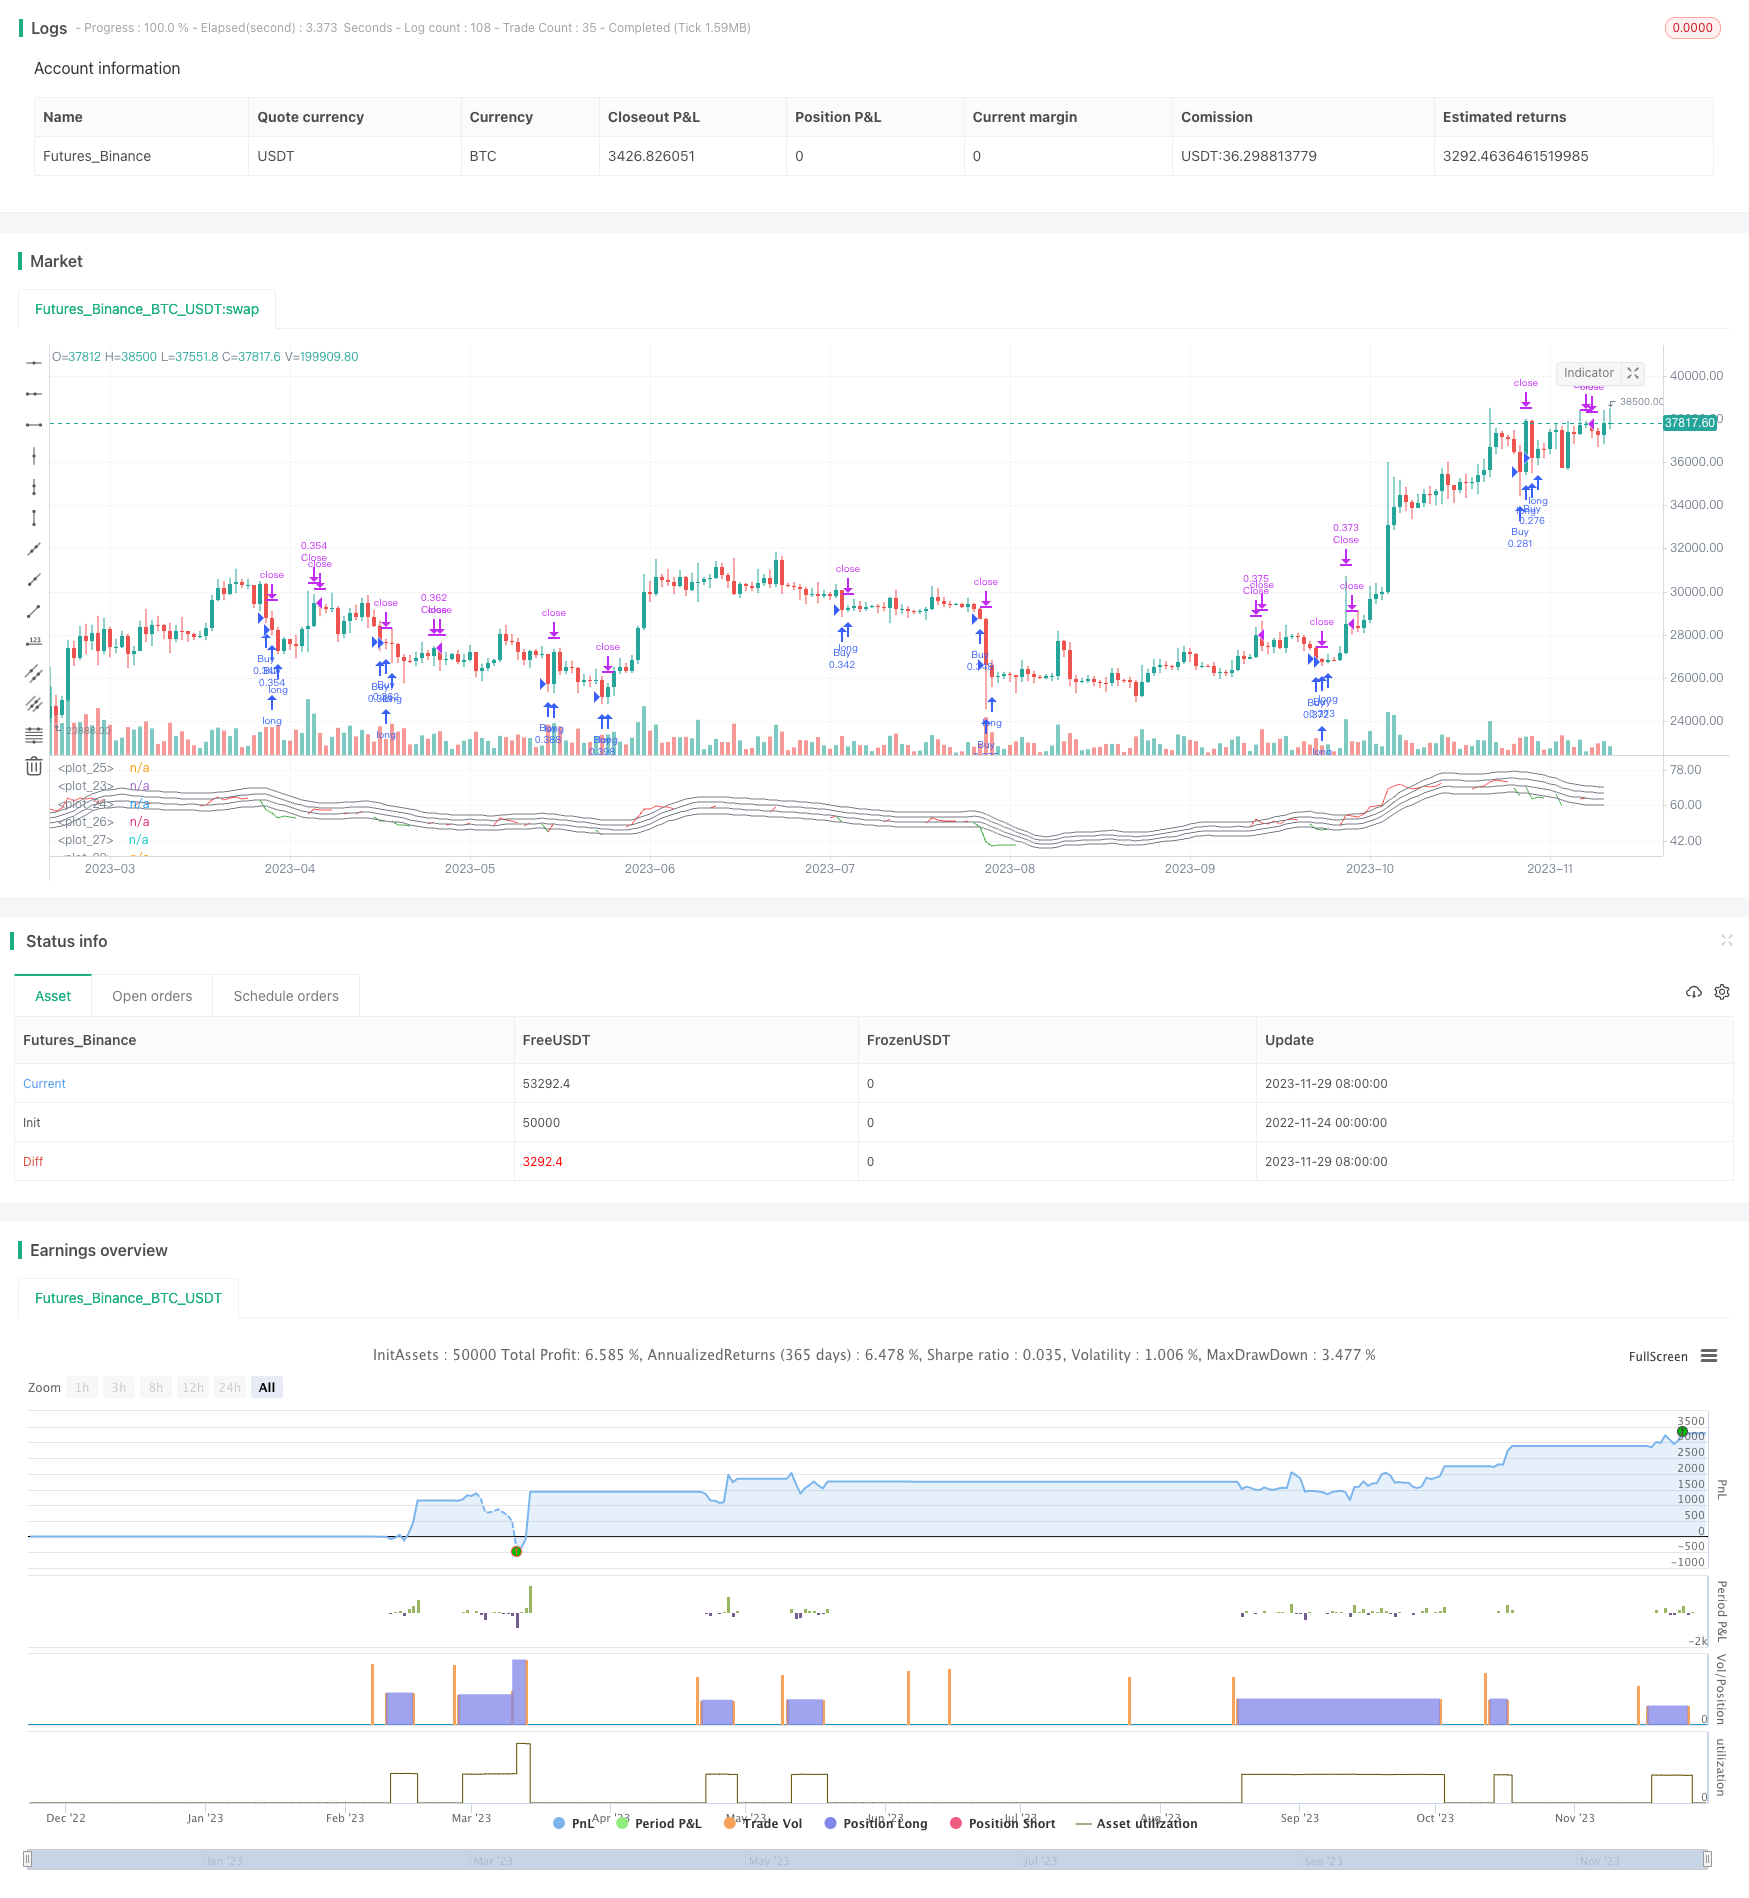
概述
该策略通过RSI指标与其均线的交叉来确定买卖点,属于短线交易策略。策略会在RSI指标低于其均线时买入,高于其均线时卖出,属于典型的低买高卖策略。
策略原理
- 计算RSI指标值,周期长度为40根K线
- 对RSI指标计算其MA均线,周期长度为10根K线
- 当RSI指标低于其均线乘以系数(1-买卖区间/100)时生成买入信号
- 当RSI指标高于其均线乘以系数(1+买卖区间/100)时生成卖出信号
- 买卖区间距离默认为5,表示离均线正负5%时产生信号
- 平仓判断为RSI指标高于其均线且高于50水平时
优势分析
这是一个典型的趋势反转策略,利用RSI指标的超买超卖特性来确定买卖时机。该策略有以下几个优势:
- 采用RSI指标判断市场结构,指标本身可靠性较高
- 均线过滤能避免不必要的交易,增强稳定性
- 买卖区间距离参数可调整交易频率
- 代码简单易懂,逻辑清晰
总的来说,这是一个简单实用的短线交易策略。
风险分析
该策略也存在一些风险需要注意:
- RSI指标发出错误信号的可能性,需要关注指标曲线形态
- 买卖区间距离设定不当可能带来过多交易或漏掉机会
- 交易频率较高,需考虑交易成本的影响
- 仅基于单一指标,容易受到市场异常的影响
这些风险都可通过参数优化、增加过滤条件等方式得到缓解。
优化方向
该策略可从以下几个维度进行优化:
- 增加更多过滤指标,如交易量指标,确保只在趋势转折点才产生信号
- 加入止损策略,控制单笔损失
- 优化买卖区间距离,平衡交易频率和获利率
- 利用机器学习算法自动寻优参数组合
- 增加聚合模型,整合多个子策略结果
通过多指标组合、止损管理、参数优化等手段,可以大幅提高策略表现。
总结
本策略整体来说是一个非常典型和实用的短线交易策略。它利用RSI指标的超买超卖状态来判断买卖时机,再辅以均线过滤。策略逻辑简单清晰,参数调整灵活,易于实现。存在一定的市场风险,但可通过完善入场退出机制、优化参数等方式进行控制。如果结合更多技术指标和风控手段,该策略可以成为一个相对稳定收益的短线策略。
策略源码
/*backtest
start: 2022-11-24 00:00:00
end: 2023-11-30 00:00:00
period: 1d
basePeriod: 1h
exchanges: [{"eid":"Futures_Binance","currency":"BTC_USDT"}]
*/

// This source code is subject to the terms of the Mozilla Public License 2.0 at https://mozilla.org/MPL/2.0/
// © I11L

//@version=5
strategy("I11L - Meanreverter 4h", overlay=false, pyramiding=3, default_qty_value=10000, initial_capital=10000, default_qty_type=strategy.cash,process_orders_on_close=false, calc_on_every_tick=false)

frequency = input.int(10)
rsiFrequency = input.int(40)
buyZoneDistance = input.int(5)
avgDownATRSum = input.int(3)
useAbsoluteRSIBarrier = input.bool(true)
barrierLevel = 50//input.int(50)

momentumRSI = ta.rsi(close,rsiFrequency)
momentumRSI_slow = ta.sma(momentumRSI,frequency)

isBuy = momentumRSI < momentumRSI_slow*(1-buyZoneDistance/100) and (strategy.position_avg_price - math.sum(ta.atr(20),avgDownATRSum)*strategy.opentrades > close or strategy.opentrades == 0 ) //and (momentumRSI < barrierLevel or not(useAbsoluteRSIBarrier))
isShort = momentumRSI > momentumRSI_slow*(1+buyZoneDistance/100) and (strategy.position_avg_price - math.sum(ta.atr(20),avgDownATRSum)*strategy.opentrades > close or strategy.opentrades == 0 ) and (momentumRSI > barrierLevel or not(useAbsoluteRSIBarrier))
momentumRSISoftClose = (momentumRSI > momentumRSI_slow) and (momentumRSI > barrierLevel or not(useAbsoluteRSIBarrier))

isClose = momentumRSISoftClose

plot(momentumRSI,color=isClose ? color.red :  momentumRSI < momentumRSI_slow*(1-buyZoneDistance/100) ? color.green : color.white)
plot(momentumRSI_slow,color=color.gray)
plot(barrierLevel,color=useAbsoluteRSIBarrier ? color.white : color.rgb(0,0,0,0))
plot(momentumRSI_slow*(1-buyZoneDistance/100),color=color.gray)
plot(momentumRSI_slow*(1+buyZoneDistance/100),color=color.gray)
plot(momentumRSI_slow*(1+(buyZoneDistance*2)/100),color=color.gray)

// plot(strategy.wintrades - strategy.losstrades)


if(isBuy)
    strategy.entry("Buy",strategy.long, comment="#"+str.tostring(strategy.opentrades+1))

// if(isShort)
//     strategy.entry("Sell",strategy.short, comment="#"+str.tostring(strategy.opentrades+1))

if(isClose)
    strategy.exit("Close",limit=close)