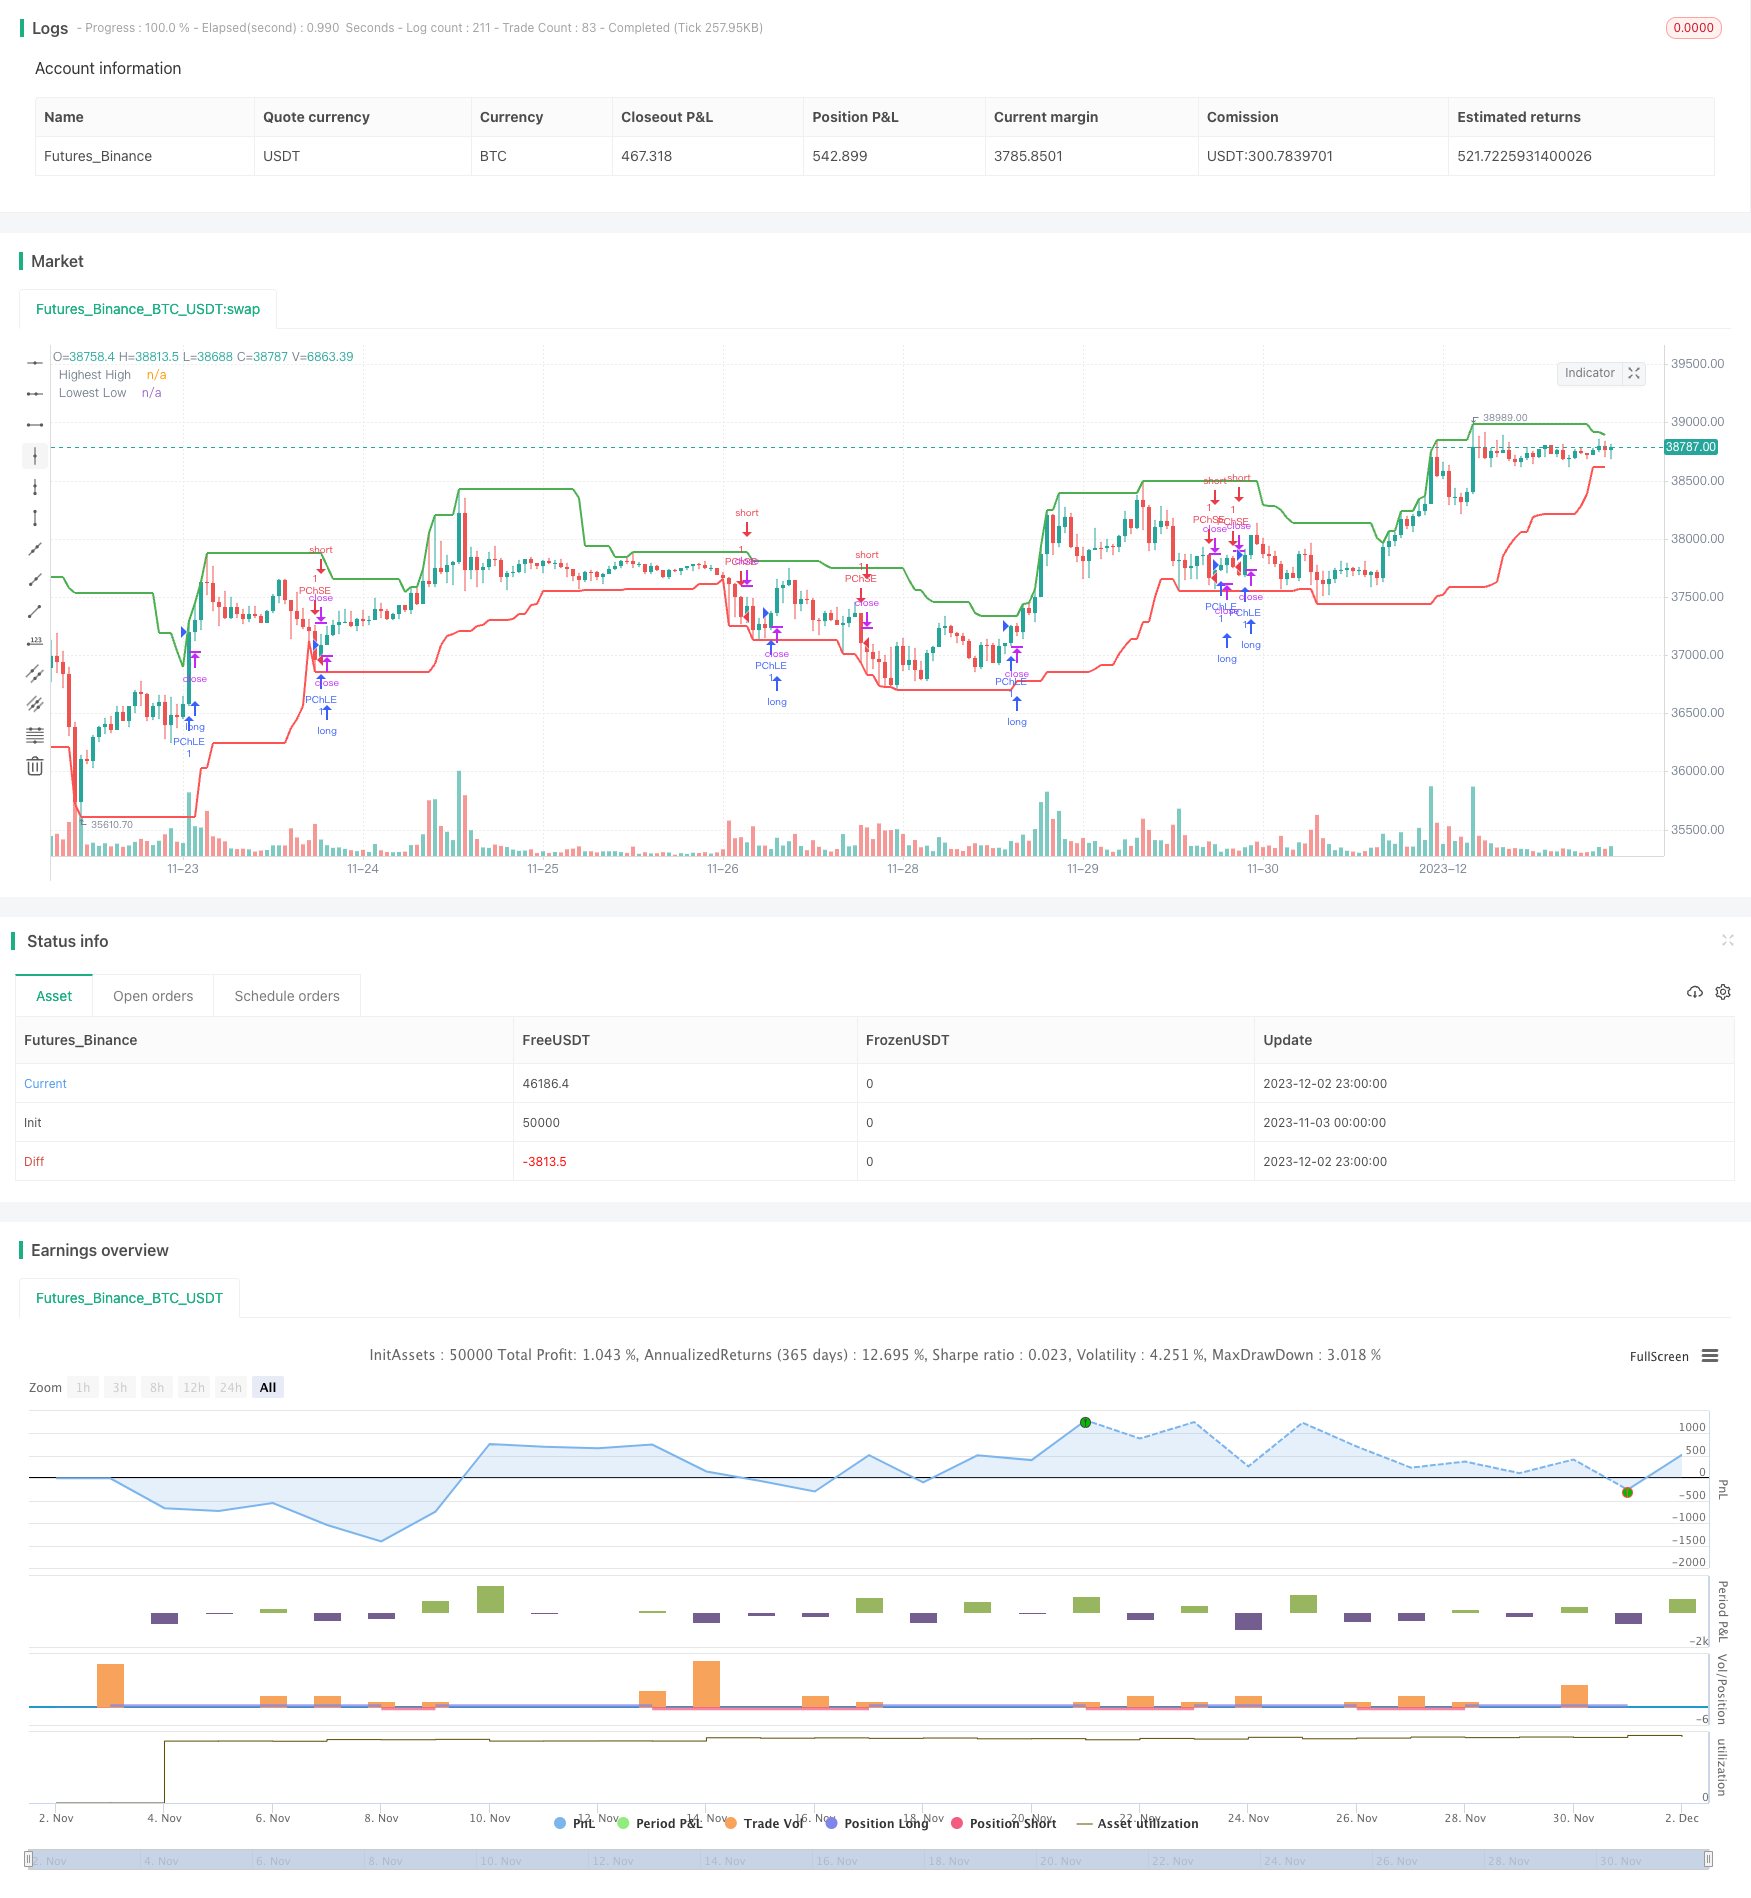
적응형 가격 채널 전략
저자:차오장, 날짜: 2023-12-04 16:33:45태그:

전반적인 설명
이 전략은 평균 진정한 범위 (ATR) 지표와 평균 방향 지표 (ADX) 를 기반으로 한 적응 가격 채널 전략입니다. 그것은 옆 시장과 가격 움직임의 경향을 식별하고 그에 따라 거래를하는 것을 목표로합니다.
전략 논리
-
주어진 길이에서 가장 높은 높음 (HH) 과 가장 낮은 낮음 (LL) 을 계산합니다. 또한 같은 길이에서 ATR을 계산합니다.
-
가격 상승과 하락에 따라 +DI와 -DI를 계산하고 ADX를 계산합니다.
-
ADX < 25, 시장은 옆으로 간주됩니다. 닫는 경우 > 상단 채널 (HH - ATR 곱셈자 * ATR), 길게 가십시오. 닫는 경우 < 하단 채널 (LL + ATR 곱셈자 * ATR), 짧게 가십시오.
-
ADX >= 25 +DI > -DI라면 시장이 상승합니다.
-
ADX >= 25와 +DI < -DI, 시장은 하향. 닫는 경우 < 하위 채널, 짧은 이동.
-
출입 이후의 exit_length 바의 출입 위치
이점 분석
-
전략은 시장 조건에 따라 자동으로 적응, 측면 시장에서 채널 전략과 트렌드 시장에서 트렌드를 따라.
-
ATR와 ADX를 사용하면 적응력이 보장됩니다. ATR은 채널 너비를 조정하고 ADX는 트렌드를 결정합니다.
-
강제출입은 안정성을 더해줍니다.
위험 분석
-
ADX는 종종 잘못된 신호를 생성할 수 있습니다.
-
안 좋은 ATR와 ADX 매개 변수는 나쁜 성능으로 이어집니다.
-
블랙 스완 사건으로부터 효과적으로 보호할 수 없습니다.
최적화 방향
-
적응력을 높이기 위해 ATR와 ADX의 매개 변수를 최적화합니다.
-
손실을 제한하기 위해 Stop Loss를 추가합니다.
-
잘못된 신호를 피하기 위해 필터를 추가합니다.
결론
전략은 시장 조건에 적응하기 위한 지표와 메커니즘을 결합합니다. 하지만 지표의 한계로 인해 잘못된 판단이 발생할 수 있습니다.
/*backtest
start: 2023-11-03 00:00:00
end: 2023-12-03 00:00:00
period: 1h
basePeriod: 15m
exchanges: [{"eid":"Futures_Binance","currency":"BTC_USDT"}]
*/

//@version=5
strategy("Adaptive Price Channel Strategy", overlay=true)

length = input(20, title="Length")
exit_length = input(10, title="Exit After X Periods")
atr_multiplier = input(3.2, title="ATR Multiplier")

startDate = input(defval = timestamp("2019-01-15T08:15:15+00:00"), title = "Start Date")
endDate = input(defval = timestamp("2033-04-01T08:15:00+00:00"), title = "End Date")

hh = ta.highest(high, length)
ll = ta.lowest(low, length)
atr = ta.atr(length)

// calculate +DI and -DI
upMove = high - high[1]
downMove = low[1] - low
plusDM = na(upMove[1]) ? na : (upMove > downMove and upMove > 0 ? upMove : 0)
minusDM = na(downMove[1]) ? na : (downMove > upMove and downMove > 0 ? downMove : 0)
plusDI = ta.rma(plusDM, length) / atr * 100
minusDI = ta.rma(minusDM, length) / atr * 100

// calculate ADX
dx = math.abs(plusDI - minusDI) / (plusDI + minusDI) * 100
adx = ta.rma(dx, length)

var int barSinceEntry = na

if (not na(close[length]) )
    if (adx < 25) // Sideways market
        if (close > hh - atr_multiplier * atr)
            strategy.entry("PChLE", strategy.long, comment="PChLE")
            barSinceEntry := 0
        else if (close < ll + atr_multiplier * atr)
            strategy.entry("PChSE", strategy.short, comment="PChSE")
            barSinceEntry := 0
    else if (adx >= 25 and plusDI > minusDI) // Bullish market
        if (close > hh - atr_multiplier * atr)
            strategy.entry("PChLE", strategy.long, comment="PChLE")
            barSinceEntry := 0
    else if (adx >= 25 and plusDI < minusDI) // Bearish market
        if (close < ll + atr_multiplier * atr)
            strategy.entry("PChSE", strategy.short, comment="PChSE")
            barSinceEntry := 0

if (na(barSinceEntry))
    barSinceEntry := barSinceEntry[1] + 1
else if (barSinceEntry >= exit_length)
    strategy.close("PChLE")
    strategy.close("PChSE")
    barSinceEntry := na

plot(hh, title="Highest High", color=color.green, linewidth=2)
plot(ll, title="Lowest Low", color=color.red, linewidth=2)
- 부피에 의한 오시슬레이션 양자 전략
- 십자 이동 평균 황금 십자 죽음의 십자 전략
- EMA/ADX/VOL-CRYPTO KILLER
- 슈퍼트렌드 멀티 타임프레임 백테스트 전략
- 8일 역전 전략
- 이중 이동 평균 돌파 전략
- 골든 크로스 이동 평균 거래 전략
- 다중 지표 양적 거래 전략
- 전체 암호화 스윙 ALMA 크로스 MACD 양적 전략
- 이중 이동 평균 역전 거래 전략
- 거북이 탈출 전략
- 평균 반전 봉투 이동 평균 전략
- 이멘텀 브레이크 이동 평균 거래 전략
- 동적 네트워크 거래 관리 전략
- 동적 이동 평균 추적 전략
- 이중 이동 평균 오스실레이션 거래 전략
- EMA 대역 + Leledc + Bollinger 대역 전략 추세
- 빠른 RSI 전략 분석
- 적응성 변동성 브레이크업 거래 전략
- 높은 마이너스 기하급수적 이동 평균 주식 전략