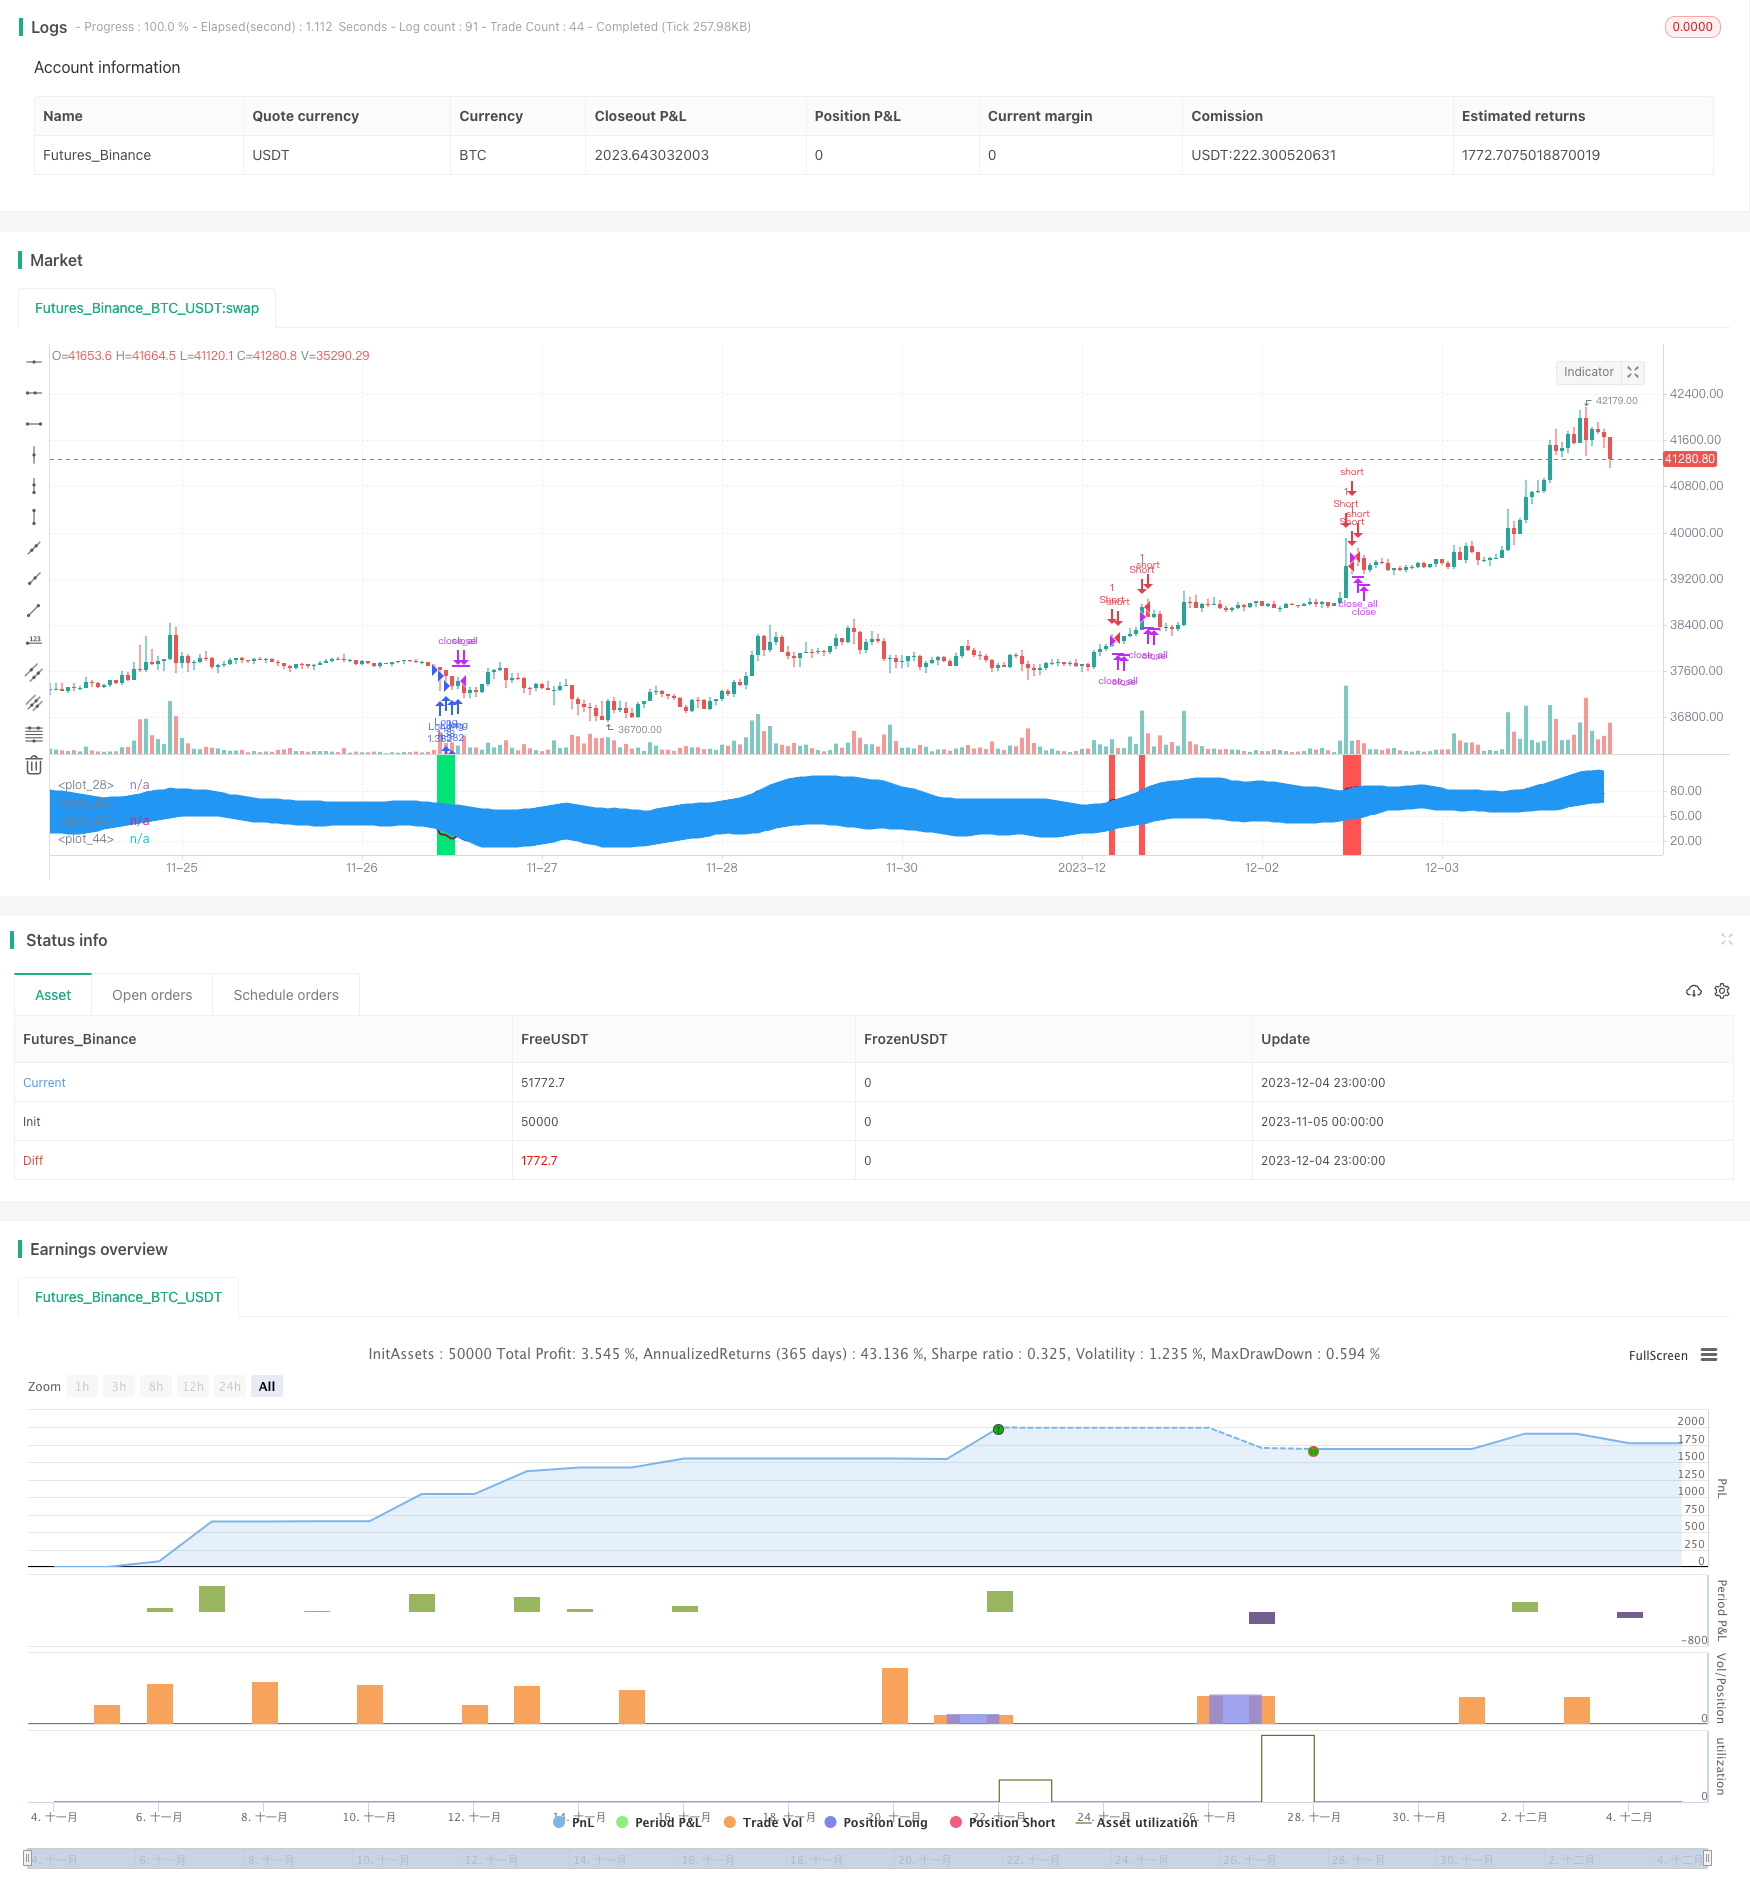
BB 비율 지수 추세 감소 전략
저자:차오장, 날짜: 2023-12-06 14:43:39태그:

전반적인 설명
이 전략은 BB 퍼센트 지표와 RSI 및 MFI 지표가 결합되어 있습니다. RSI 과잉 판매/대량 구매 신호와 MFI 과잉 판매/대량 구매 신호와 함께 볼링거 밴드 상부 및 하부 레일의 가격 브레이크를 탐지하여 장기 및 단기 결정을 내립니다. 이는 전형적인 트렌드 희미화 거래 전략입니다.
전략 논리
- 볼링거 밴드 비율 (BB%) 를 계산하십시오. BB%는 볼링거 채널을 통해 시장 방향을 판단하는 볼링거 중간 밴드에 대한 가격의 표준편차를 나타냅니다.
- 과잉 구매 및 과잉 판매 조건을 결정하기 위해 RSI와 MFI 지표를 포함합니다. RSI는 과잉 구매 및 과잉 판매 수준을 결정하기 위해 일정 기간 동안의 평균 이익과 평균 손실을 비교합니다. MFI는 과잉 구매 및 과잉 판매 수준을 결정하기 위해 부피와 감소 부피를 비교합니다.
- 가격이 볼링거 하부 레일을 상향으로 돌파할 때, 장거리; 가격이 볼링거 상부 레일을 상향으로 돌파할 때, 단위로 가십시오. 동시에 RSI 및 MFI 지표의 과판 / 과입 신호를 필터링에 사용합니다.
장점
- 트렌드 마감 거래는 시장 추세를 피하고 수익 변동을 줄입니다.
- 여러 지표의 조합은 신호를 필터링하고 의사 결정의 정확성을 향상시킵니다.
- 매개 변수 설정은 전략의 위험 수익 특성을 조정하는 데 유연합니다.
- 상품, 외환, 암호화폐 등과 같은 매우 변동성 있는 도구에 적용됩니다.
위험 과 해결책
- 볼링거 브레이크에서 잘못된 신호가 발생할 확률이 높으며 필터링을 위해 여러 지표의 조합이 필요합니다.
- 파업 신호 판단은 좋은 기회를 놓치지 않기 위해 적절하게 완화 된 기준을 필요로합니다.
- 지점 크기, 스톱 로스 라인을 높이는 등 위험을 제어하기 위해 매개 변수 설정을 조정합니다.
최적화 방향
- ATR 지표와 같은 변동성 기반의 스톱 로스 메커니즘을 포함합니다.
- 브레이크오웃 신호 품질을 판단하는 데 도움이 되는 머신 러닝 모델을 도입합니다.
- 참여 기구를 동적으로 조정하기 위해 기기 선택 메커니즘을 최적화합니다.
- 감정 지표, 뉴스 등과 같은 더 많은 요소를 포함하여 의사 결정 프레임워크를 개선하십시오.
결론
이 전략은 주로 높은 변동성 비 트렌딩 도구에 적용된다. 볼링거 채널과 지표 조합을 통해 트렌드 퇴색 거래를 구현한다. 위험 수익 특성은 매개 변수를 조정함으로써 제어 할 수 있다. 더 많은 보조 지표와 모델을 도입하여 의사 결정 품질을 최적화하여 더 나은 전략 성능을 달성함으로써 추가 개선이 가능하다.
/*backtest
start: 2023-11-05 00:00:00
end: 2023-12-05 00:00:00
period: 1h
basePeriod: 15m
exchanges: [{"eid":"Futures_Binance","currency":"BTC_USDT"}]
*/

//Noro
//2018

//@version=2
strategy(title = "BB%/MFI/RSI", shorttitle = "BB%/MFI/RSI", default_qty_type = strategy.percent_of_equity, default_qty_value = 100, pyramiding = 100)

//Settings
needlong = input(true, defval = true, title = "Long")
needshort = input(false, defval = false, title = "Short")
capital = input(100, defval = 100, minval = 1, maxval = 10000, title = "Lot, %")
fromyear = input(1900, defval = 1900, minval = 1900, maxval = 2100, title = "From Year")
toyear = input(2100, defval = 2100, minval = 1900, maxval = 2100, title = "To Year")
frommonth = input(01, defval = 01, minval = 01, maxval = 12, title = "From Month")
tomonth = input(12, defval = 12, minval = 01, maxval = 12, title = "To Month")
fromday = input(01, defval = 01, minval = 01, maxval = 31, title = "From Day")
today = input(31, defval = 31, minval = 01, maxval = 31, title = "To Day")

source = hlc3
length = input(14, minval=1), mult = input(2.0, minval=0.001, maxval=50), bblength = input(50, minval=1, title="BB Period")
DrawRSI_f=input(true, title="Draw RSI?", type=bool)
DrawMFI_f=input(false, title="Draw MFI?", type=bool)
HighlightBreaches=input(true, title="Highlight Oversold/Overbought?", type=bool)

DrawMFI = (not DrawMFI_f) and (not DrawRSI_f) ? true : DrawMFI_f
DrawRSI = (DrawMFI_f and DrawRSI_f) ? false : DrawRSI_f
// RSI
rsi_s = DrawRSI ? rsi(source, length) : na
plot(DrawRSI ? rsi_s : na, color=maroon, linewidth=2)

// MFI
upper_s = DrawMFI ? sum(volume * (change(source) <= 0 ? 0 : source), length) : na
lower_s = DrawMFI ? sum(volume * (change(source) >= 0 ? 0 : source), length) : na
mf = DrawMFI ? rsi(upper_s, lower_s) : na
plot(DrawMFI ? mf : na, color=green, linewidth=2)

// Draw BB on indices
bb_s = DrawRSI ? rsi_s : DrawMFI ? mf : na
basis = sma(bb_s, length)
dev = mult * stdev(bb_s, bblength)
upper = basis + dev
lower = basis - dev
plot(basis, color=red)
p1 = plot(upper, color=blue)
p2 = plot(lower, color=blue)
fill(p1,p2, blue)

b_color = (bb_s > upper) ? red : (bb_s < lower) ? lime : na
bgcolor(HighlightBreaches ? b_color : na, transp = 0)

//Signals
up = bb_s < lower and close < open
dn = bb_s > upper and close > open
size = strategy.position_size
lp = size > 0 and close > open
sp = size < 0 and close < open
exit = (up == false and dn == false) and (lp or sp)

//Trading
lot = strategy.position_size == 0 ? strategy.equity / close * capital / 100 : lot[1]
if up
    if strategy.position_size < 0
        strategy.close_all()

    strategy.entry("Long", strategy.long, needlong == false ? 0 : lot, when=(time > timestamp(fromyear, frommonth, fromday, 00, 00) and time < timestamp(toyear, tomonth, today, 23, 59)))

if dn
    if strategy.position_size > 0
        strategy.close_all()

    strategy.entry("Short", strategy.short, needshort == false ? 0 : lot, when=(time > timestamp(fromyear, frommonth, fromday, 00, 00) and time < timestamp(toyear, tomonth, today, 23, 59)))

if time > timestamp(toyear, tomonth, today, 23, 59) or exit
    strategy.close_all()
더 많은
- MA 트렌드 필터와 함께 볼링거 밴드 역전
- RSI 기반의 양적 거래 전략
- 다중 이동 평균 크로스오버 거래 전략
- 이동 평균 크로스오버 전략
- 자동차 S/R 브레이크업 전략
- 모멘텀 가격 채널 오픈 및 종료 전략
- 시장 트렌드 가이드와 함께 향상된 이동 평균 크로스오버 전략
- 동적 촛불 빅 양 라인 거래 전략
- SSL 하이브리드 출구 화살표 양자 전략
- 이중 이동 평균 ADX 타이밍 전략
- MACD 볼링거 거북이 거래 전략
- 트리플 슈퍼 트렌드 및 스톡 RSI 전략
- 1%의 수익 이동 평균 크로스 전략
- 가중화된 양적 이동평균 크로스오버 거래 전략
- 여러 보조 RSI 지표 전략
- 이중 이동 평균 크로스오버 트렌드 전략
- 반전 볼링거 밴드 전략
- 적응 가능한 ATR-ADX 트렌드 전략 V2
- 이중 요인 주기 거래 전략
- 평균 최상위 최상위 최하위 낮은 스윙어 전략