개요
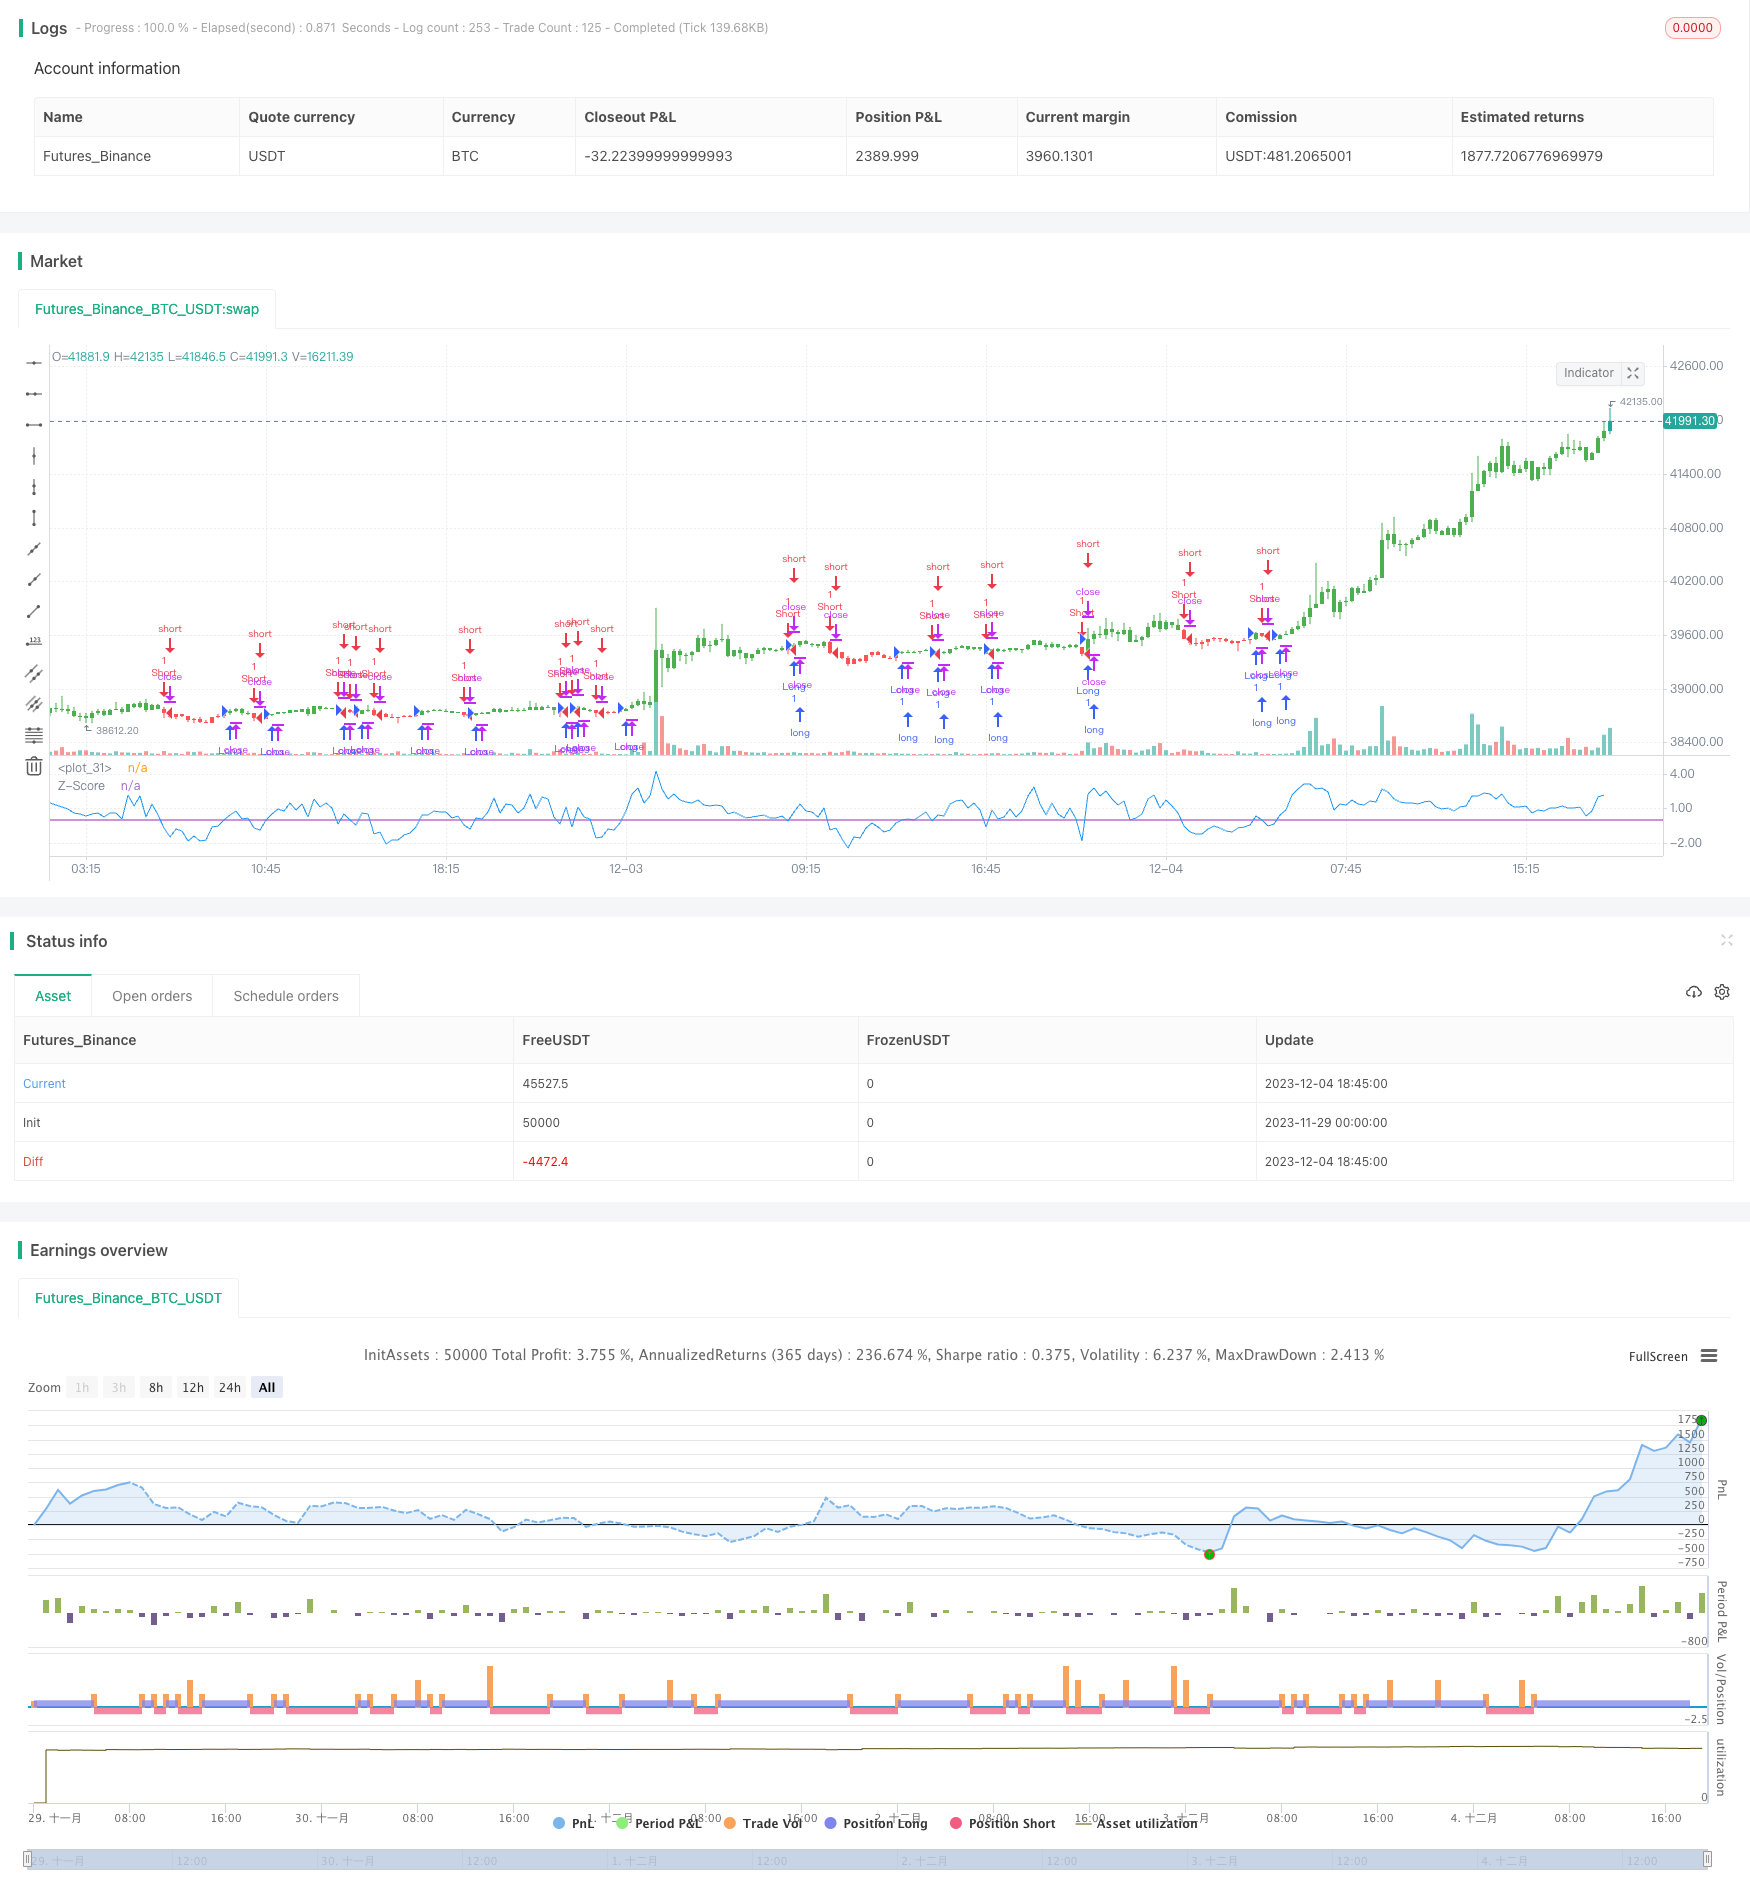
표준 점수 가격 돌파 전략 (Z-Score Price Breakout Strategy) 은 가격의 표준 점수 지표를 사용하여 현재 가격이 비정상적인 상태인지 판단하여 거래 신호를 생성한다. 가격의 표준 점수가 특정 하위 값보다 높거나 낮으면 가격이 비정상적인 상태에 들어간 것을 나타냅니다. 이 때 더 많은 또는 공백 작업을 할 수 있습니다.
전략 원칙
이 전략의 핵심 지표는 가격의 표준 점수 (Z-Score) 이며, 계산 공식은 다음과 같습니다:
Z_score = (C - SMA(n)) / StdDev(C,n)
여기서 C는 종전 가격, SMA (n) 는 n주기의 간단한 이동 평균, StdDev (C,n) 는 n주기의 종전 가격의 표준 차기 ᄂ.
표준 점수는 현재 가격과 평균 가격의 오차 정도를 반영한다. 가격 표준 점수가 어떤 긍정적인 경미가 (예: +2) 보다 크면, 현재 가격이 평균 가격보다 2 표준 차이가 더 높았음을 나타내고, 비교적 높은 수준에 속한다. 어떤 부정적인 경미가 (예: -2) 보다 작으면, 현재 가격이 평균 가격보다 2 표준 차이가 더 낮았음을 나타내고, 비교적 낮은 수준에 속한다.
이 전략은 우선 가격의 표준 점수를 계산한 다음, 0과 0과 같은 긍정과 부정적 경계를 설정하여 표준 점수가 긍정적 경계를 초과할 때 구매 신호를 발생시키고, 부정적 경계를 초과할 때 판매 신호를 발생시킨다.
우위 분석
- 가격 표준 점수를 사용하여 가격 변칙을 판단하는 것은 일반적인 효과적인 수치화 방법입니다.
- 두방향으로 거래할 수 있습니다.
- 매개 변수 설정은 유연하고 주기, 값 등을 조정할 수 있습니다.
- 다른 지표와 결합하여 거래 시스템을 형성할 수 있습니다.
위험 분석
- 표준 점수 전략은 넉넉하고, 잘못된 신호를 유발할 수 있다.
- 사이클 및 값과 같은 적절한 매개 변수를 설정해야 합니다.
- 손해 방지 전략과 위험 관리
최적화 방향
- 최적화 주기 변수, 최적의 주기 찾기
- 포지티브-네거티브 마이너스를 최적화하여 가짜 신호를 감소시킵니다.
- 필터링 조건을 추가하고, 다른 지표와 결합
- 더 많은 손실을 막는 전략
요약하다
표준 스코어 가격 돌파 전략은 현재 가격이 비정상 상태인지 판단하고, 가격 표준 스코어의 긍정과 부정에 따라 거래한다. 이 전략은 간단하고 쉽게, 양방향 거래가 가능하지만, 또한 약간의 위험도 존재한다. 매개 변수 최적화 및 손해 중지 등의 수단을 통해 이 전략을 강화할 수 있으며, 다른 지표 조합과 함께 완전한 정량화 거래 시스템을 형성한다.
/*backtest
start: 2023-11-29 00:00:00
end: 2023-12-04 19:00:00
period: 15m
basePeriod: 5m
exchanges: [{"eid":"Futures_Binance","currency":"BTC_USDT"}]
*/

//@version=2
////////////////////////////////////////////////////////////
//  Copyright by HPotter v1.0 18/01/2017
// The author of this indicator is Veronique Valcu. The z-score (z) for a data
// item x measures the distance (in standard deviations StdDev) and direction
// of the item from its mean (U):
//     z = (x-StdDev) / U
// A value of zero indicates that the data item x is equal to the mean U, while
// positive or negative values show that the data item is above (x>U) or below
// (x Values of +2 and -2 show that the data item is two standard deviations
// above or below the chosen mean, respectively, and over 95.5% of all data
// items are contained within these two horizontal references (see Figure 1).
// We substitute x with the closing price C, the mean U with simple moving
// average (SMA) of n periods (n), and StdDev with the standard deviation of
// closing prices for n periods, the above formula becomes:
//     Z_score = (C - SMA(n)) / StdDev(C,n)
// The z-score indicator is not new, but its use can be seen as a supplement to
// Bollinger bands. It offers a simple way to assess the position of the price
// vis-a-vis its resistance and support levels expressed by the Bollinger Bands.
// In addition, crossings of z-score averages may signal the start or the end of
// a tradable trend. Traders may take a step further and look for stronger signals
// by identifying common crossing points of z-score, its average, and average of average.
//
// You can change long to short in the Input Settings
// Please, use it only for learning or paper trading. Do not for real trading.
////////////////////////////////////////////////////////////
strategy(title="Z-Score Strategy", shorttitle="Z-Score Strategy")
Period = input(20, minval=1)
Trigger = input(0)
reverse = input(false, title="Trade reverse")
hline(Trigger, color=purple, linestyle=line)
xStdDev = stdev(close, Period)
xMA = sma(close, Period)
nRes = (close - xMA) / xStdDev
pos = iff(nRes > Trigger, 1,
	   iff(nRes < Trigger, -1, nz(pos[1], 0)))
possig = iff(reverse and pos == 1, -1,
          iff(reverse and pos == -1, 1, pos))
if (possig == 1)
    strategy.entry("Long", strategy.long)
if (possig == -1)
    strategy.entry("Short", strategy.short)
barcolor(possig == -1 ? red: possig == 1 ? green : blue )
plot(nRes, color=blue, title="Z-Score")