개요
이 전략은 이동 평균 선과 ATR 지표를 기반으로 자동화 된 트렌드 추적 거래를 구현한다. 빠른 EMA 선에서 느린 EMA 선을 통과 할 때, 다단위 포지션을 취한다. 빠른 EMA 선 아래의 느린 EMA 선을 통과 할 때, 하단위 포지션을 취한다. 동시에, ATR 지표와 결합하여 트렌드 방향을 판단하고, ATR이 트렌드 방향이라고 판단했을 때만 거래 신호를 낸다.
전략 원칙
이 전략은 크게 두 가지 기술적인 지표에 기초하고 있습니다.
EMA 평균선: 급속도로 두 개의 다른 파라미터를 사용하는 EMA 평균선, 급속도로 느린 선을 통과하면 다단계 신호로 간주하고, 아래로 통과하면 공백 신호로 간주한다.
ATR 지표: ATR 지표는 가격 변동의 폭과 강도를 판단할 수 있으며, 따라서 현재의 움직임을 판단할 수 있다. ATR 수치가 작으면 현재 평형 상태에 있음을 나타냅니다. 이때는 입장을 세우는 것이 바람직하지 않습니다. ATR 수치가 크고 위쪽으로 향하면 현재 트렌드 시장에 있음을 나타냅니다.
EMA 평행선의 교차를 통해 매매 기회를 찾고, ATR 지표와 결합하여 추세에 약한 거래 신호를 필터링하여 시장의 격동적 평정에 갇히지 않도록하십시오.
우위 분석
이 전략은 다음과 같은 장점을 가지고 있습니다.
ATR 지표가 트렌드라고 판단할 때만 거래하는 것이 불확실한 변동에 갇히지 않도록 도와줍니다.
매매점을 찾기 위한 빠른 평행선의 교차 원리를 사용하는 것은 간단하고 효과적입니다.
EMA 평균선의 민감도와 부드러움은 파라미터 조절을 통해 개인의 취향에 따라 조정할 수 있다.
두 가지 간단한 지표로 구현 가능한 완전한 자동 거래 시스템이 필요하며, Pine 편집기를 통해 전략 개발 및 최적화를 쉽게 수행 할 수 있습니다.
매개 변수를 자주 조정할 필요 없이 간단한 파라미터 세트 및 포지트 정책을 구현한다.
위험 분석
이 전략에는 몇 가지 위험도 있습니다.
EMA 교차는 잘못된 신호를 발생시키는데 사용되지 않는 손실을 유발할 수 있다. EMA 변수를 조정하여 일부 지표를 평형화 할 수 있다.
ATR 지표는 때때로 회수와 추세에 대한 판단이 잘못될 수 있으며, 이로 인해 거래 기회를 놓치게 된다. ATR의 수적 문턱을 적절히 완화시킬 수 있다.
전략 자체는 대규모 요인 분석을 고려하지 않고, 중요한 뉴스면 시장의 반전이 발생하면 빠른 평평선 교차로 판단하는 것이 어렵고, 이때는 인적 개입이 필요한 것이다.
이러한 위험의 영향을 줄일 수 있는 최적화 방법이 있습니다.
최적화 방향
이 전략에는 다음과 같은 몇 가지 주요 개선방향이 있습니다.
다른 지표 판단을 추가하여 지표 조합 시스템을 형성하여 신호의 정확성을 향상시킬 수 있습니다. 예를 들어 RSI 지표와 결합하여 과매매의 위험을 피하십시오.
다른 거래 유형, 다른 거래 구역에 따라 더 적합한 매개 변수를 선택할 수 있으므로 EMA와 ATR의 매개 변수가 현재 시장 특성에 더 적합합니다.
기계 학습과 같은 방법을 통해 동적 파라미터 최적화를 구현할 수 있다. 지표 파라미터가 고정된 정적 값을 사용하는 대신 실시간 시장 상황에 따라 조정될 수 있도록 한다.
요약하다
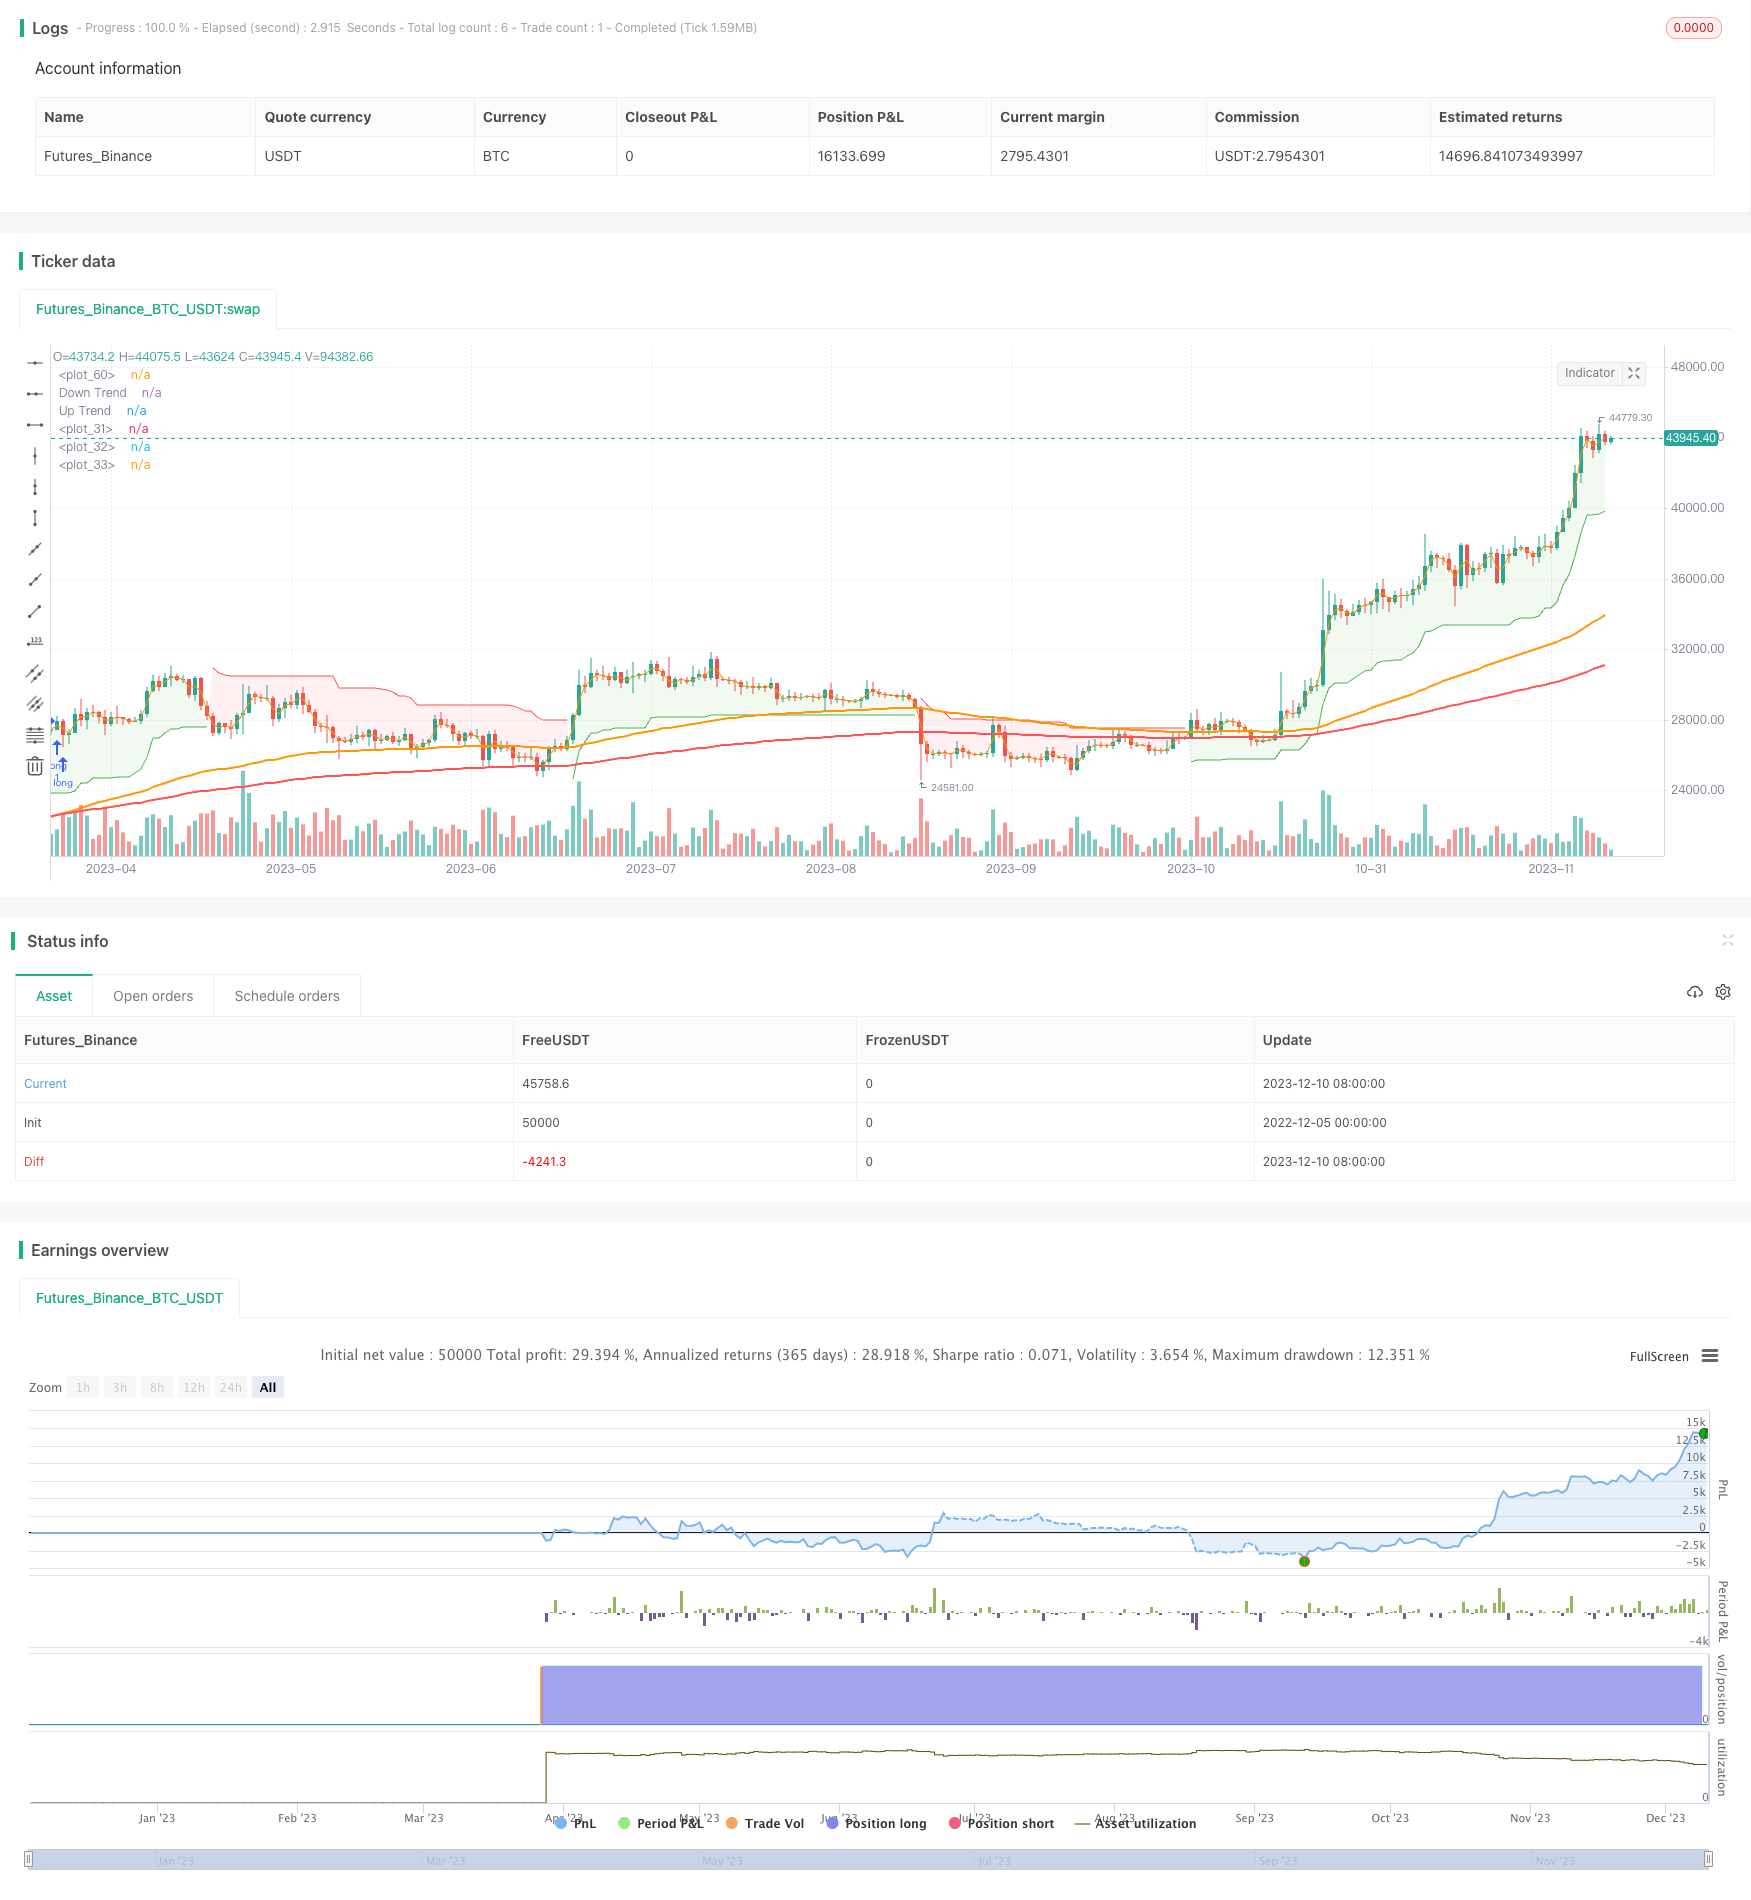
이 전략은 전체적으로 매우 실용적인 트렌드 추적 전략이다. 단지 두 가지 간단한 지표의 조합이 필요하면 비교적 완전한 거래 시스템을 구현할 수 있다. 파라미터를 조정하여 다른 선호하는 거래자에게 적응할 수 있다. 또한 전략의 성능을 더 훌륭하게하는 추가 확장 최적화 공간을 가지고 있다. 간단하고 효율적인 거래 아이디어와 좋은 최적화 잠재력은 장기적인 연구와 응용에 가치가있는 수치화 전략 중 하나입니다.
/*backtest
start: 2022-12-05 00:00:00
end: 2023-12-11 00:00:00
period: 1d
basePeriod: 1h
exchanges: [{"eid":"Futures_Binance","currency":"BTC_USDT"}]
*/

// This strategy has been created for GMT trade 4h by Zhukov


//@version=5
strategy('ZhukovTrade', overlay=true, calc_on_every_tick=true, currency=currency.USD)

// INPUT:

// Options to enter fast and slow Exponential Moving Average (EMA) values
emaFast = input.int(title='Fast EMA', defval=100, minval=1, maxval=9999)
emaSlow = input.int(title='Slow EMA', defval=200, minval=1, maxval=9999)

// Option to select trade directions
tradeDirection = input.string(title='Trade Direction', options=['Long', 'Short', 'Both'], defval='Both')

// Options that configure the backtest date range
startDate = input(title='Start Date', defval=timestamp('01 Jan 2023 00:00'))
endDate = input(title='End Date', defval=timestamp('31 Dec 2023 23:59'))


// CALCULATIONS:

// Use the built-in function to calculate two EMA lines
fastEMA = ta.ema(close, emaFast)
slowEMA = ta.ema(close, emaSlow)
emapos = ta.ema(close,200)

// PLOT:

// Draw the EMA lines on the chart
plot(series=fastEMA, color=color.new(color.orange, 0), linewidth=2)
plot(series=slowEMA, color=color.new(color.blue, 0), linewidth=2)
plot(series=emapos, color=color.new(color.red, 0), linewidth=2)


// CONDITIONS:

// Check if the close time of the current bar falls inside the date range
inDateRange = true

// Translate input into trading conditions
longOK = tradeDirection == 'Long' or tradeDirection == 'Both'
shortOK = tradeDirection == 'Short' or tradeDirection == 'Both'

// Decide if we should go long or short using the built-in functions
longCondition = ta.crossover(fastEMA, slowEMA)
shortCondition = ta.crossunder(fastEMA, slowEMA)
// ORDERS:
// Set take profit and stop loss percentages
take_profit_percent = input(0, title="Take Profit Percent")
stop_loss_percent = input(0, title="Stop Loss Percent")
// Submit entry (or reverse) orders


atrPeriod = input(12, "ATR Length")
factor = input.float(3.0, "Factor", step = 0.01)

[supertrend, direction] = ta.supertrend(factor, atrPeriod)

bodyMiddle = plot((open + close) / 2, display=display.none)
upTrend = plot(direction < 0 ? supertrend : na, "Up Trend", color = color.green, style=plot.style_linebr)
downTrend = plot(direction < 0? na : supertrend, "Down Trend", color = color.red, style=plot.style_linebr)

fill(bodyMiddle, upTrend, color.new(color.green, 90), fillgaps=false)
fill(bodyMiddle, downTrend, color.new(color.red, 90), fillgaps=false)

if longCondition and inDateRange
    if longOK and direction<0

        strategy.entry(id='long', direction=strategy.long, alert_message = "LONG")
if shortCondition and inDateRange
    if shortOK and direction>0
        strategy.entry(id='short', direction=strategy.short, alert_message = "SHORT")

// Submit exit orders in the cases where we trade only long or only short

if strategy.position_size > 0 and take_profit_percent
    strategy.exit(id='tp long',from_entry ="long",profit = take_profit_percent)
if strategy.position_size > 0 and stop_loss_percent
    strategy.exit(id='sl long',from_entry="long",loss=stop_loss_percent)

if strategy.position_size < 0 and stop_loss_percent
    strategy.exit(id='sl short',from_entry="short",loss=stop_loss_percent)
if strategy.position_size < 0 and take_profit_percent
    strategy.exit(id='tp short',from_entry="short",profit = take_profit_percent)