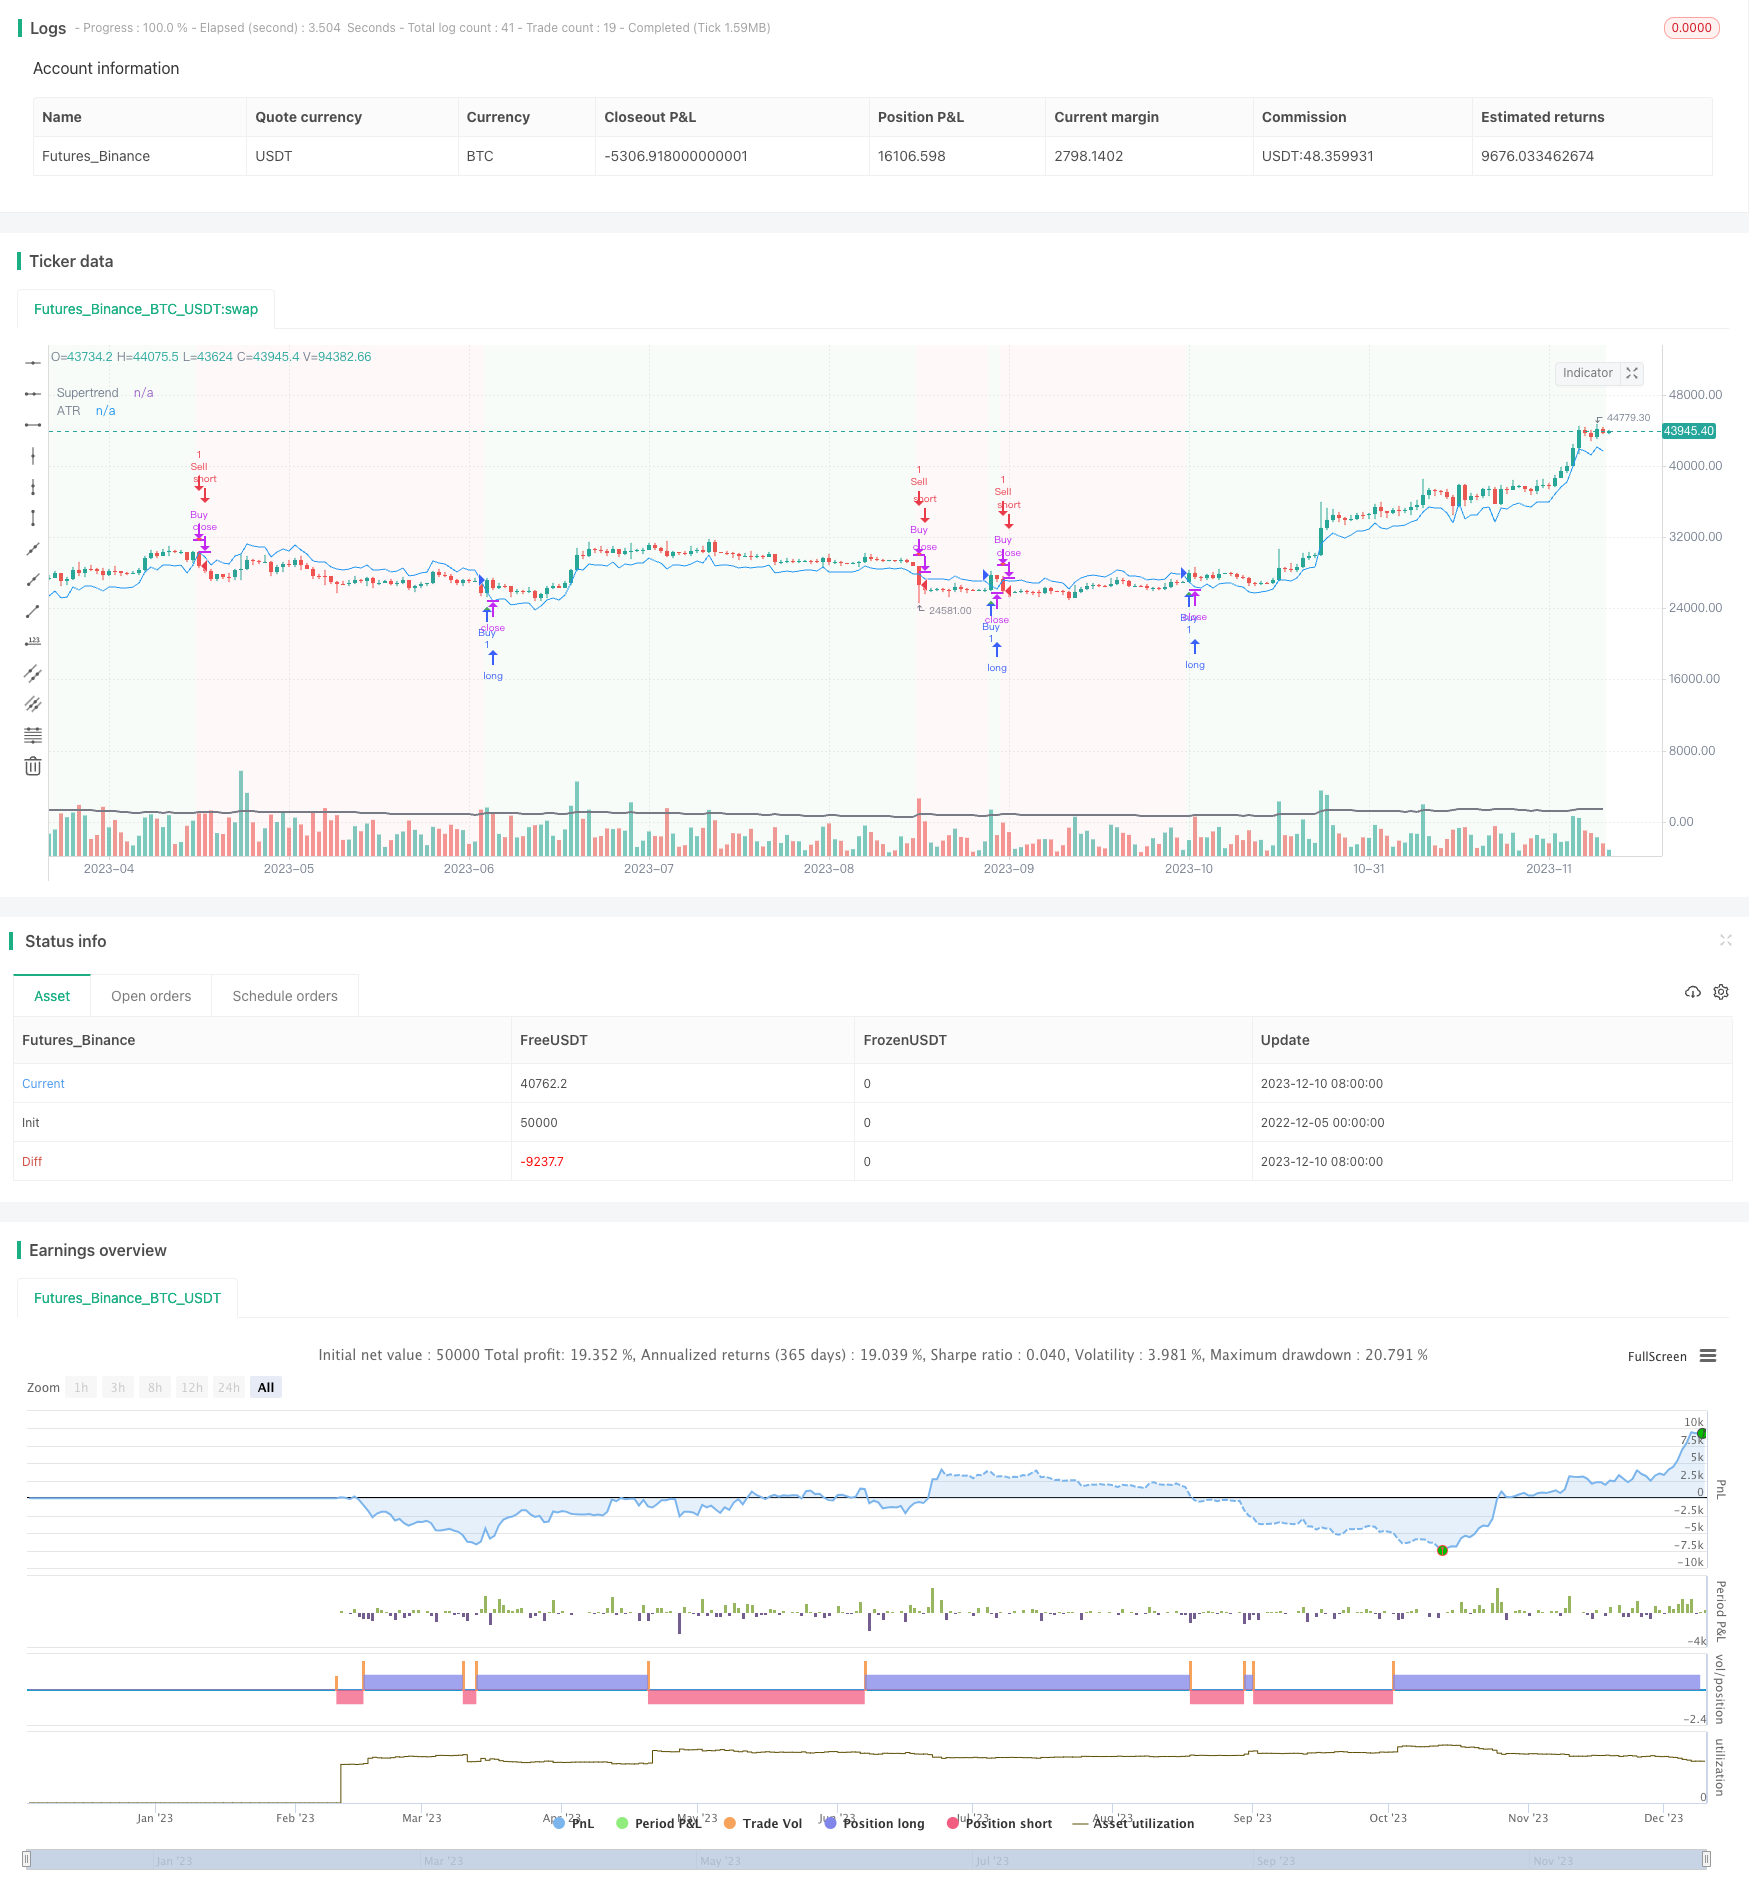
슈퍼트렌드 지표에 기반한 트렌드 추적 전략. 이 전략은 슈퍼트렌드 지표를 사용하여 트렌드 방향을 판단하고, ATR 지표와 결합하여 스톱 스톱을 설정하여 낮은 위험 트렌드 추적을 구현한다.
전략 원칙
이 전략의 핵심 지표는 SuperTrend이며, SuperTrend 지표는 ATR과 결합하여 가격의 돌파구에 따라 트렌드 방향을 판단합니다. 구체적인 계산 방법은 다음과 같습니다:
상도선: 상도선 = 현재 가격 - ((ATR 곱하기 곱하기)) 하향선: 하향선 = 현재 가격 + ((ATR 곱하기 곱하기))
가격이 상궤선보다 높을 때, 부향적 경향; 가격이 하궤선보다 낮을 때, 하향적 경향.
전략은 슈퍼트렌드 지표에 기반하여 트렌드 방향을 판단하고, 부진 트렌드일 때 더 많이 하고, 하락 트렌드일 때 공백한다. 동시에, 전략은 ATR 지표의 평균 변동 범위를 사용하여 손해 중지 위치를 설정하고, 위험을 제어한다.
전략적 이점
- 슈퍼트렌드 (SuperTrend) 지표는 시장의 흐름을 정확하게 파악할 수 있는 도구입니다.
- ATR 손해 차단장치, 단기 손실을 효과적으로 제어
- 트렌드와 스톱로드를 결합하여 전체적으로 높은 승률 거래
- 시장에 쉽게 진입하고 쉽게 상쇄되며, 단선 추적에 적합하다.
전략적 위험
- 슈퍼 트렌드 지표는 리패인트 문제로 시판에 완전히 의존할 수 없습니다.
- ATR 지표는 급격한 상황에 완전히 적응할 수 없으며, 너무 밀도가 높으면 쉽게 손상됩니다.
- 전략 자체는 트렌드의 질을 판단할 수 없으며, 트렌드를 인위적으로 확인해야 합니다.
위험 해결 방법: 1) 트렌드 품질을 인위적으로 확인하고, 가짜 돌파구에서 역작업을 피합니다. 2) 정상 변동에서 작은 손실을 방지하기 위해 적절하게 느슨한 정지
전략 최적화 방향
- 트렌드 품질을 판단하기 위한 다중 요소 검증을 추가합니다.
- 변동률 지표와 함께 ATR 변수를 동적으로 조정
- 거래 시기를 판단하는 데 도움이 되는 기계 학습 모델을 추가합니다.
- 정규 변동이 손상되지 않도록 손해 차단 장치를 최적화합니다.
요약: 이 전략은 SuperTrend 지표를 사용하여 트렌드 방향을 판단하고, ATR 지표는 스톱로스 스톱을 설정하여, 낮은 위험 트렌드 추적 거래를 구현한다. 전략 아이디어는 명확하고 이해하기 쉽으며, 자신의 위험 선호에 따라 파라미터를 조정할 수 있으며, 범용 유형의 트렌드 추적 전략이다. 그러나 전략 자체는 트렌드 품질을 판단할 수 없으며, 다른 지표 또는 모델과 함께 사용하는 것이 권장되며, 잘못된 조작 위험을 줄인다.
/*backtest
start: 2022-12-05 00:00:00
end: 2023-12-11 00:00:00
period: 1d
basePeriod: 1h
exchanges: [{"eid":"Futures_Binance","currency":"BTC_USDT"}]
*/

//@version=5
strategy("Advanced Trend Strategy", overlay=true)

// Input parameters
length = input(14, title="ATR Length")
multiplier = input(1.5, title="Multiplier")
src = close

// Calculate ATR
atr_value = ta.atr(length)

// Calculate Supertrend
upst = src - multiplier * atr_value
downst = src + multiplier * atr_value

var float supertrend = na
var float trend_direction = na

if (na(supertrend))
    supertrend := upst

if (src > supertrend)
    supertrend := upst

if (src < supertrend)
    supertrend := downst

// Buy and Sell conditions
buyCondition = ta.crossover(src, supertrend)
sellCondition = ta.crossunder(src, supertrend)

// Execute Buy and Sell orders
if (buyCondition)
    strategy.entry("Buy", strategy.long)

if (sellCondition)
    strategy.close("Buy")  // Close the long position

if (sellCondition)
    strategy.entry("Sell", strategy.short)

if (buyCondition)
    strategy.close("Sell")  // Close the short position

// Plot Supertrend
plot(supertrend, color=color.blue, title="Supertrend")

// Highlight bars based on trend direction
bgcolor(src > supertrend ? color.new(color.green, 95) : src < supertrend ? color.new(color.red, 95) : na)

// Plot ATR for reference
plot(atr_value, color=color.gray, title="ATR", linewidth=2)

// Plot arrows for buy and sell signals
plotshape(buyCondition, color=color.green, style=shape.triangleup, location=location.belowbar, size=size.small, title="Buy Signal")
plotshape(sellCondition, color=color.red, style=shape.triangledown, location=location.abovebar, size=size.small, title="Sell Signal")