개요
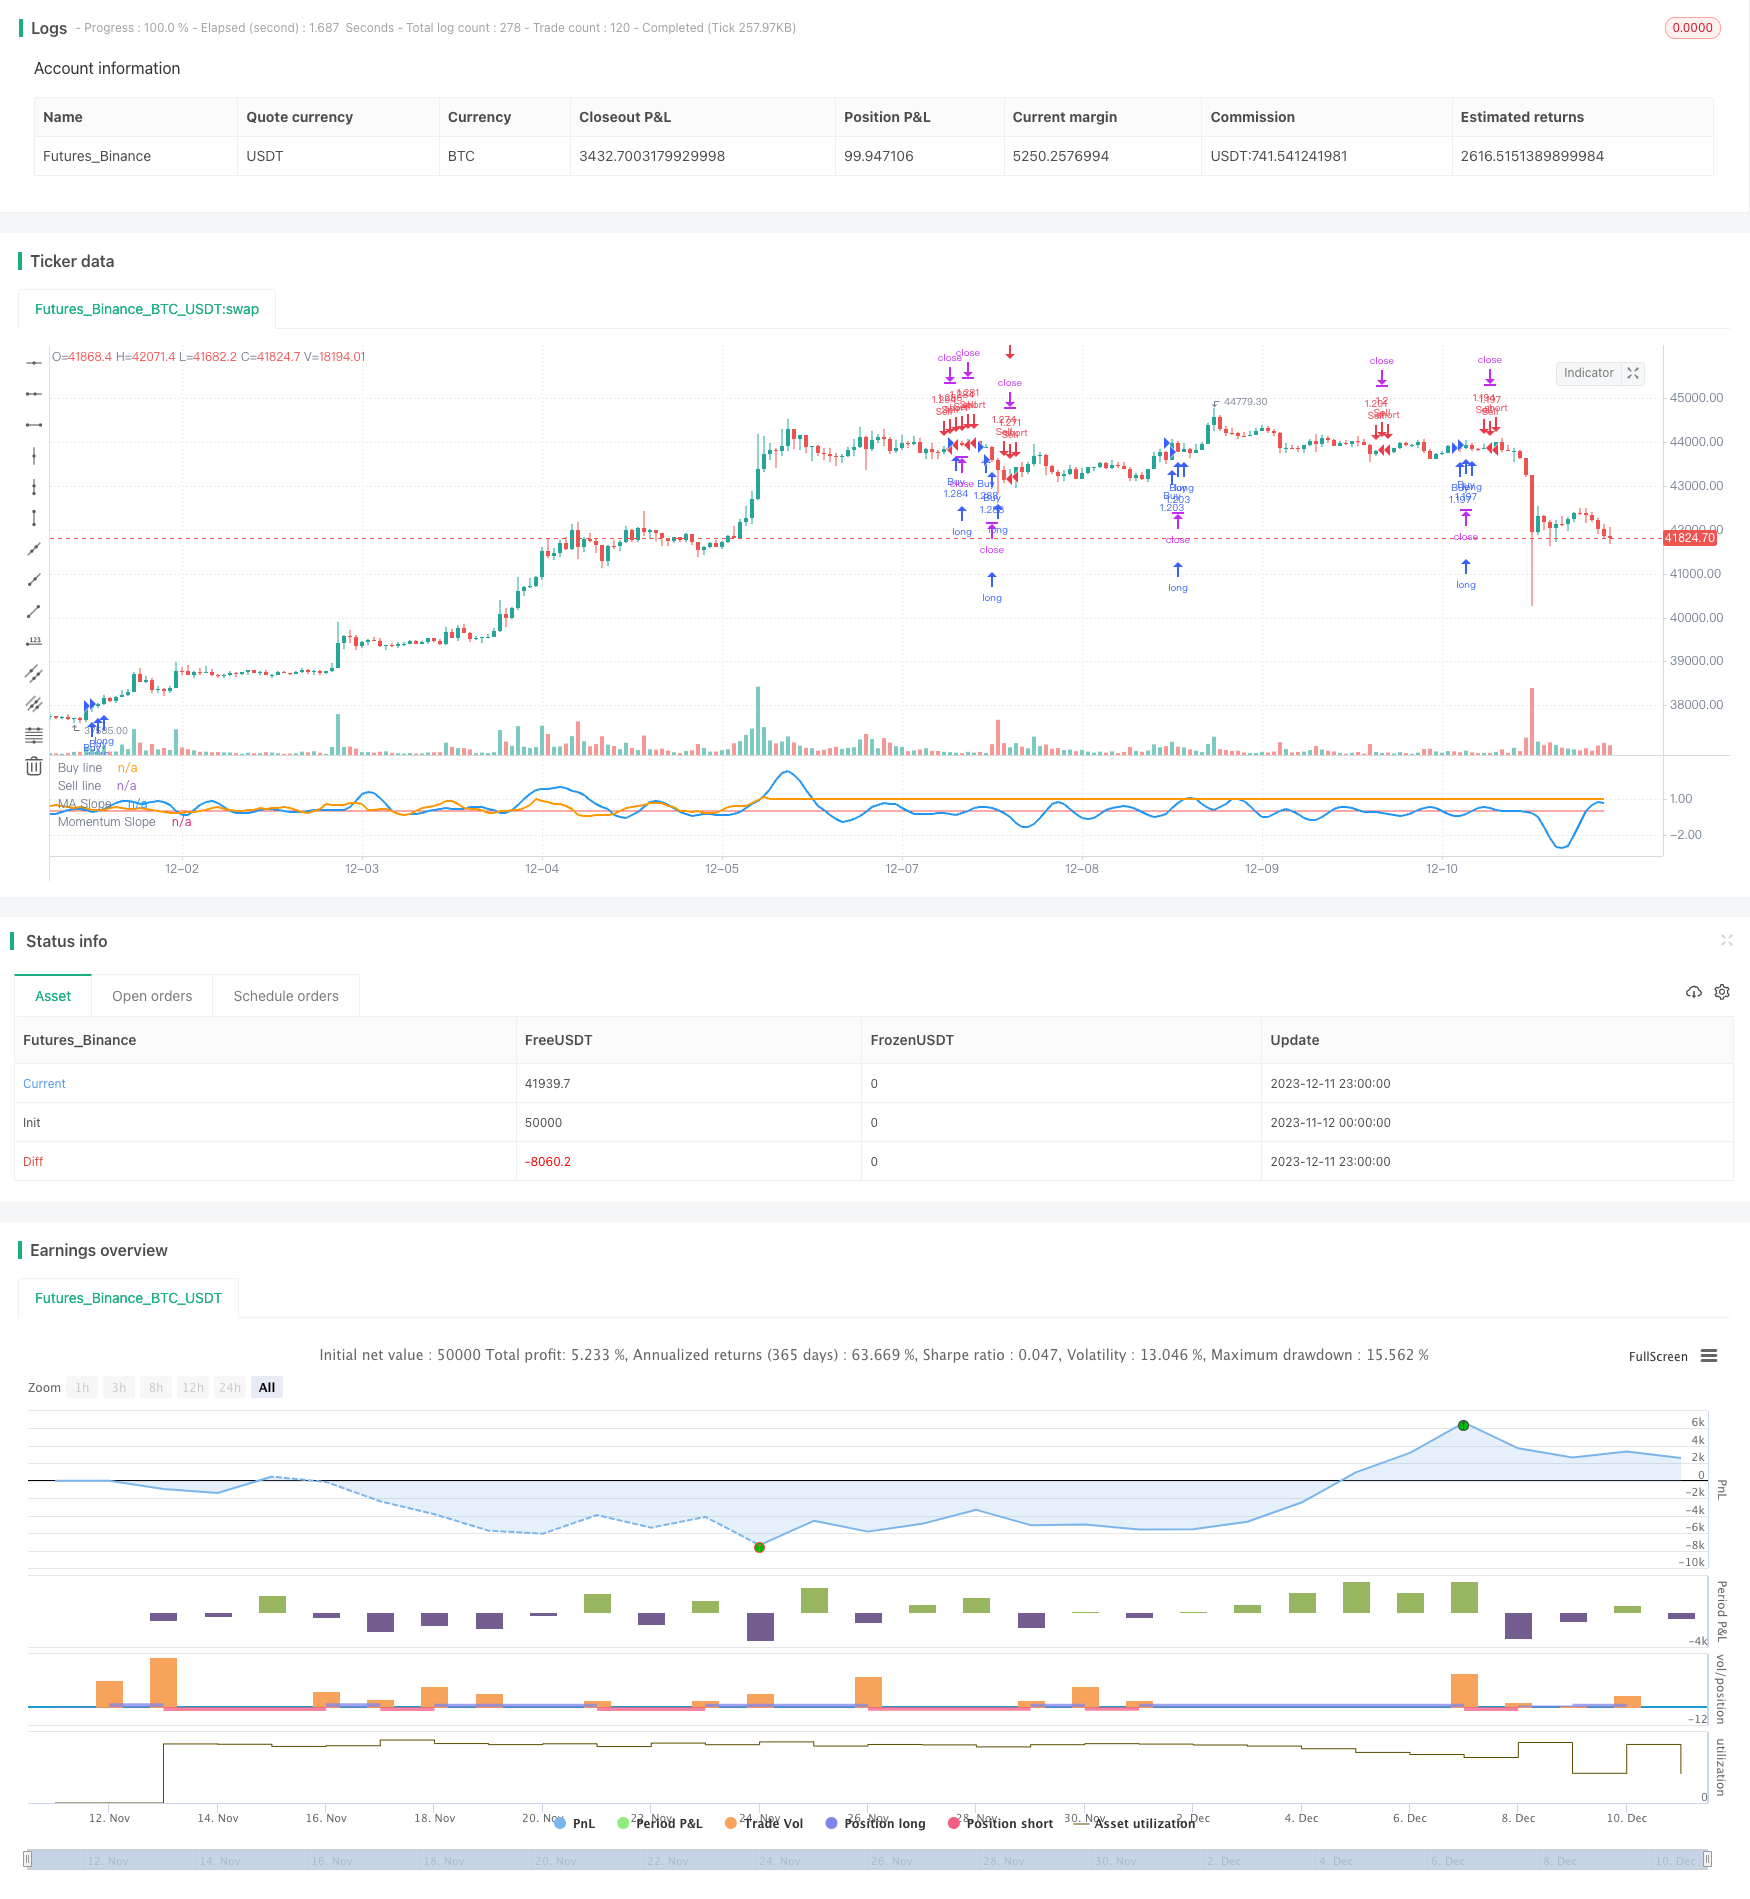
이 전략은 이동 평균 ((MA) 의 기울기와 동력 지표의 기울기를 사용하여 거래 결정을 내립니다. 그것은 MA의 기울기와 동력 기울기를 설정된 마이너스와 비교하여 두 개의 기울기가 모두 마이너스를 초과하면 거래 신호를 발생시킵니다. 이 전략에는 낮은 파동 필터가 포함되어 있으며, 시장의 변동성이 낮을 때 다른 MA를 사용하여 신호를 발생시킵니다.
전략 원칙
이 전략의 핵심은 두 개의 기울기 곡선을 비교하는 것이다. 첫째, MA와 동력 지표의 기울기를 계산한다. 기울기는 곡선의 변화 속도와 방향을 반영한다. 두 개의 값을 사용하여 두 개의 기울기 곡선이 각각 해당 값을 초과할 때 거래 신호를 발생시킨다.
예를 들어, MA 경사율과 동력 경사율이 모두 올라가는 경우, 구매 신호를 생성합니다. 두 곡선이 모두 내려가는 경우, 판매 신호를 생성합니다. 이것은 일부 가짜 신호를 필터링 할 수 있습니다.
낮은 파동 필터는 장기 MA를 사용하여 시장의 변동성을 판단한다. 변동성이 낮을 때, 다른 파라미터를 사용하여 MA를 사용하여 거래 신호를 생성하여 다른 시장 상태에 적응한다.
우위 분석
이 전략에는 다음과 같은 장점이 있습니다.
이중 필터를 사용하여 거래 신호를 설정하여 일부 소음을 필터링하여 신호 품질을 향상시킬 수 있습니다.
낮은 파동 필터는 전략이 다양한 시장 상황에 적응할 수 있도록 해줍니다.
다양한 파라미터를 고도로 사용자 정의할 수 있으며, 다양한 품종에 대해 최적화할 수 있다.
복사재가 없는 기능으로, 결과물에 대한 곡선 적합의 영향을 줄일 수 있다.
위험 분석
이 전략에는 몇 가지 위험도 있습니다.
이중 필터링은 일부 실제 신호를 필터링하여 놓친 기회를 초래할 수 있습니다. 파라미터를 조정하여 최적화 할 수 있습니다.
낮은 파동 필터 판단 값은 신중한 테스트를 통해 결정해야 한다. 만약 변수가 잘못되면 신호의 오차가 발생할 수 있다.
MA 및 동력 지표 파라미터 설정은 특정 품종에 맞게 최적화해야 하며, 전체 시장에 대한 일반적인 파라미터를 결정하는 것은 어렵다.
복사 페인트 없는 기능은 회수 곡선 적합 문제를 완전히 피할 수 없으며, 실디 효과는 여전히 검증되어야 한다.
고도로 사용자 정의된 매개 변수는 매개 변수 공간을 복잡하게 만들고, 최적화가 더 어려워진다.
최적화 방향
이 전략은 다음과 같은 방향으로 최적화될 수 있습니다.
더 많은 종류의 MA와 동력 지표의 조합을 테스트하여 가장 잘 맞는 지표를 찾습니다.
MA와 동력 지표의 길이 변수를 최적화하고, 지연과 소음을 균형을 잡는다.
기울기 계산의 파라미터를 최적화하여 더 안정적인 지표의 조합을 찾습니다.
다양한 낮은 변동성 지표와 매개 변수를 테스트하여 탄력성을 높인다.
다양한 품종과 주기에서 테스트하여 최적의 적용 범위를 찾습니다.
수동 최적화 작업을 줄이기 위해 매개 변수 적응 메커니즘을 구축하십시오.
요약하다
이 전략은 전체적으로 매우 유연하고 사용자 정의 가능한 쌍 MA 전략입니다. 그것은 가격과 동력 정보를 동시에 참조하여 의사 결정을 내리고, 가짜 신호를 효과적으로 필터링 할 수 있습니다. 낮은 파동 필터는 또한 전략을 더 탄력있게 만들어 시장의 변화에 적응 할 수 있습니다.
매개 변수 최적화와 지표 선택의 개선을 통해 이 전략은 실제 시장에서 적용할 가치가 있는 선택이 될 수 있다. MA와 동력 지표를 활용하여 거래 결정을 내리는 데 참고 템플릿을 제공한다.
/*backtest
start: 2023-11-12 00:00:00
end: 2023-12-12 00:00:00
period: 1h
basePeriod: 15m
exchanges: [{"eid":"Futures_Binance","currency":"BTC_USDT"}]
*/

// This source code is subject to the terms of the Mozilla Public License 2.0 at https://mozilla.org/MPL/2.0/
// © Allenlk
//@version=4
strategy("DRSI DMA Scalping Strategy", shorttitle="DRSIDMA", overlay=false, initial_capital=1000, pyramiding=2, default_qty_type=strategy.percent_of_equity, default_qty_value=100)

//Inputs
matype             = input(7, minval=1, maxval=8, title="1=SMA, 2=EMA, 3=WMA, 4=HullMA, 5=VWMA, 6=RMA, 7=TEMA, 8=Tilson T3", group="Moving Average")
masrc              = input(close, title="MA Source", group="Moving Average")
malen              = input(5, title="Moving Average Length - LookBack Period", group="Moving Average")
factorT3           = input(defval=7, title="Tilson T3 Factor - *.10 - so 7 = .7 etc.", minval=0, group="Moving Average")
maderiv            = input(3, title="MA Slope Lookback", minval=1, group="Moving Average")
masmooth           = input(5, title="MA Slope Smoothing", minval=1, group="Moving Average")
momtype            = input(3, minval=1, maxval=3, title="1=RSI, 2=CCI, 3=RSI/ROC", group="Momentum Moving Average")
momsrc             = input(close, title="Momentum Source", group="Momentum Moving Average")
momlen             = input(3, title="Momentum Length", minval=1, group="Momentum Moving Average")
momderiv           = input(8, title="Momentum Slope Lookback", minval=1, group="Momentum Moving Average")
momsmooth          = input(7, title="Momentum Slope Smoothing", minval=1, group="Momentum Moving Average")
higherTf           = input("1", title="Higher timeframe?", type = input.resolution, group="Time Resolution")
higherTfmult       = input(130, title="MA Slope multiplier for Alternate Resolutions (Make the waves of the blue line similar size as the orange line)", group="Time Resolution")
buffup             = input(0.02, title="Buy when both slopes cross this line", step=0.01, group="Buy and Sell Threshold")
bufflow            = input(-0.03, title="Sell when both slopes cross this line", step=0.01, group="Buy and Sell Threshold")
lowVolMALength     = input(28, title="Big MA Length", minval=1, group="Low Volatility Function")
MAlength           = input(10, title="Low Volatility Moving Average Length", minval=1, group="Low Volatility Function")
MAThresh           = input(0.05, title="Low Volatility Buy and Sell Threshold", step=0.01, group="Low Volatility Function")
Volminimum         = input(2.5, title="Minimum volatility to trade", minval=0, step=0.01, group="Low Volatility Function")

//Low Volatility Function
//When Volatility is low refer to the slope of a long moving average
low_vol_MA         = sma(close, lowVolMALength)
low_vol_down       = (low_vol_MA[3] - low_vol_MA[1]) > MAThresh
low_vol_up         = (low_vol_MA[3] - low_vol_MA[1]) < MAThresh * -1
percent_volatility = (1 - (low / high)) * 100
chng_MA            = sma(percent_volatility, MAlength)
bad_vol            = chng_MA < Volminimum

//No repaint function
nrp_funct(_symbol, _res, _src) => security(_symbol, _res, _src[barstate.isrealtime ? 1 : 0])

//hull ma definition
hullma = wma(2*wma(masrc, malen/2)-wma(masrc, malen), round(sqrt(malen)))

//TEMA definition
ema1 = ema(masrc, malen)
ema2 = ema(ema1, malen)
ema3 = ema(ema2, malen)
tema = 3 * (ema1 - ema2) + ema3

//Tilson T3
factor = factorT3 *.10
gd(masrc, malen, factor) => ema(masrc, malen) * (1 + factor) - ema(ema(masrc, malen), malen) * factor
t3(masrc, malen, factor) => gd(gd(gd(masrc, malen, factor), malen, factor), malen, factor)
tilT3 = t3(masrc, malen, factor)

//MA Type
avg = matype == 1 ? sma(masrc,malen) : matype == 2 ? ema(masrc,malen) : matype == 3 ? wma(masrc,malen) : matype == 4 ? hullma : matype == 5 ? vwma(masrc, malen) : matype == 6 ? rma(masrc,malen) : matype == 7 ? 3 * (ema1 - ema2) + ema3 : tilT3

//MA Slope Percentage
DeltaAvg      = (avg / avg[maderiv]) - 1
SmoothedAvg   = sma(DeltaAvg, masmooth)
MAout         = nrp_funct(syminfo.tickerid, higherTf, SmoothedAvg) * higherTfmult

//Momentum indicators
Momentum = momtype == 1 ? rsi(momsrc, momlen) : momtype == 2 ? cci(momsrc, momlen) : momtype == 3 ? rsi(roc(momsrc,momlen),momlen) : na

//Momentum Slope Percentage
Deltamom = (Momentum / Momentum[momderiv]) - 1
SmoothedMom = sma(Deltamom, momsmooth)
Momout   = nrp_funct(syminfo.tickerid, higherTf, SmoothedMom)

//Plottings
plot(buffup, color=color.green, title="Buy line")
plot(bufflow, color=color.red, title="Sell line")
plot(MAout, color=color.blue, linewidth=2, title="MA Slope")
plot(Momout, color=color.orange, linewidth=2, title="Momentum Slope")

longCondition = bad_vol ? low_vol_up : MAout > buffup and Momout > buffup
if (longCondition)
    strategy.entry("Buy", strategy.long)

shortCondition = bad_vol ? low_vol_down : MAout < bufflow and Momout < bufflow
if (shortCondition)
    strategy.entry("Sell", strategy.short)