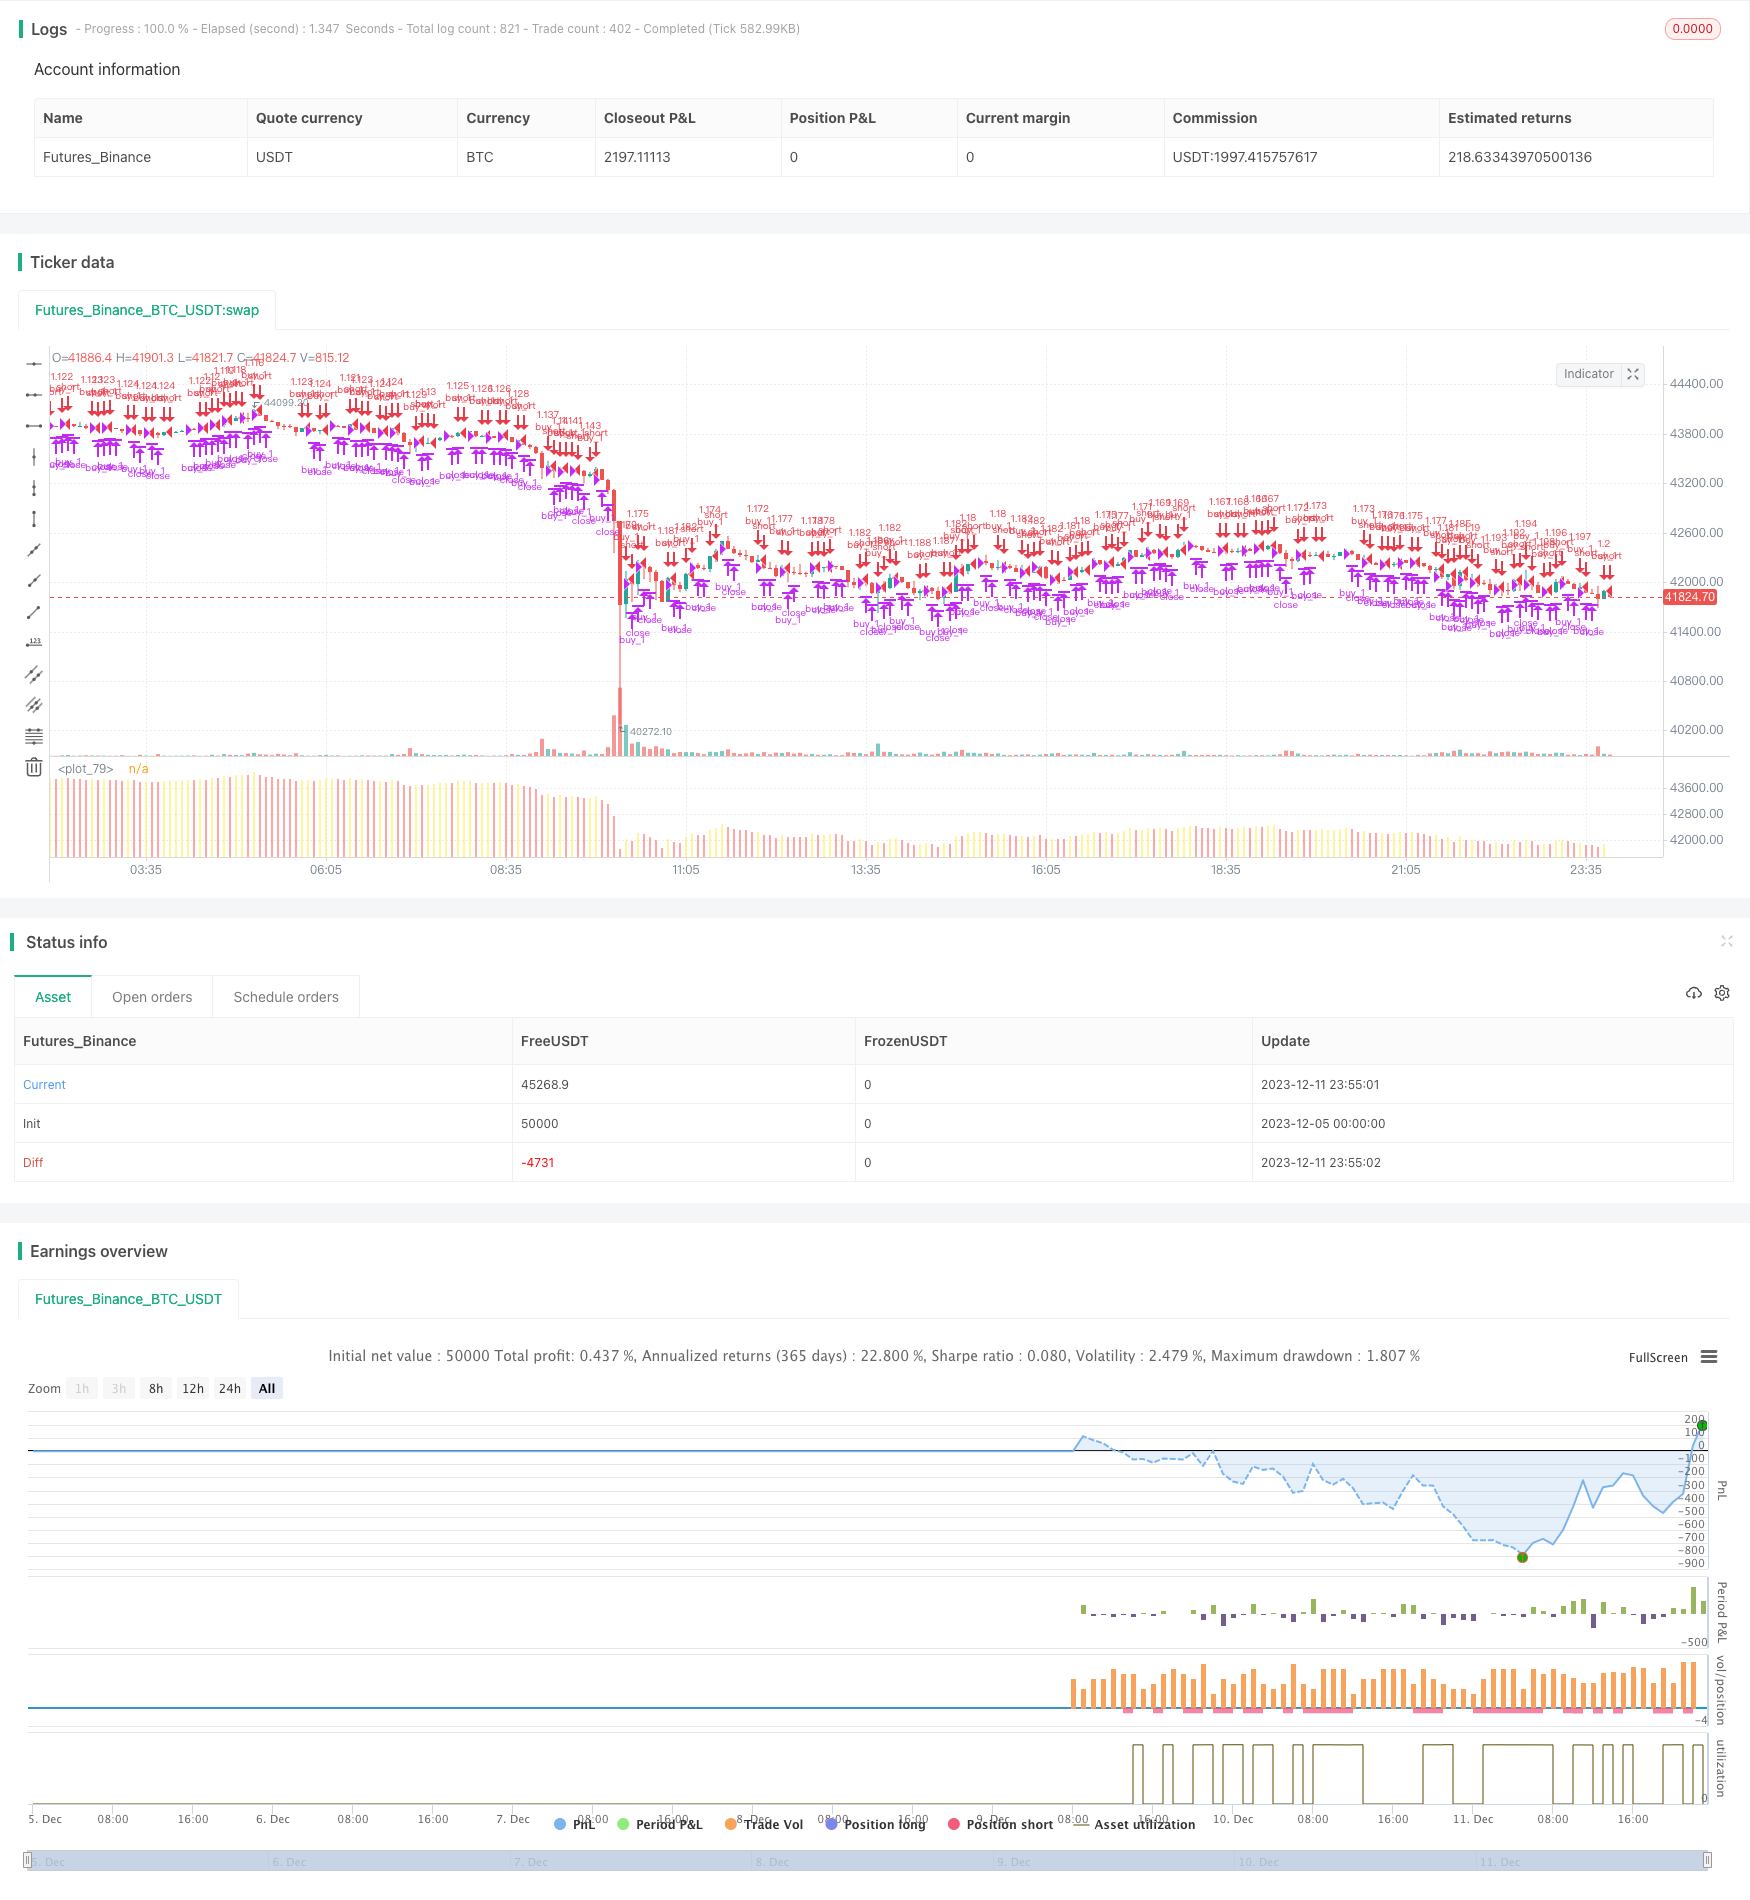
개요
이 전략의 핵심 아이디어는 맥D 지표의 미래 움직임을 분석하여 가격 추세를 예측하는 것입니다. 이 전략은 맥D 지표의 빠른 평균선과 느린 평균선으로 구성된 교차로에서 발생하는 거래 신호를 최대한 활용합니다.
전략 원칙
- 맥D 지표의 차점을 계산하고, 이를 바탕으로 맥D 선과 신호 선의 상승과 하락을 판단한다.
- 보이스 옵션을 설정하여 4 시간 시간 범위의 맥D 지표의 미래 값을 사용하여 맥D 지표의 미래 움직임을 판단하여 가격 동향을 예측하십시오.
- 맥 D 지표의 차이는 0보다 크면 (중장시장을 나타내는) 그리고 계속 상승할 것으로 예상되면 더 많이; 맥 D 지표의 차이는 0보다 작으면 (공장시장을 나타내는) 그리고 계속 하락할 것으로 예상되면 공백한다.
- 이 전략은 트렌드 추적과 트렌드 반전의 두 가지 거래 방식을 결합하여 트렌드를 포착하면서 트렌드 반전의 시점을 파악합니다.
전략적 강점 분석
- 맥D 지표는 시장의 추세를 판단하는 데 유용하며, 흔들림을 효과적으로 필터링하여 긴 선의 추세를 잡을 수 있습니다.
- 맥D 지표의 미래 동향을 예측함으로써, 가격 전환점을 일찍 파악하고, 전략의 전향성을 강화할 수 있다.
- 동시 트렌드 추적과 트렌드 역전 거래 방식을 결합하여 트렌드 추적 과정에서 적절한 시간에 포지션을 역전하여 더 큰 수익을 얻을 수 있습니다.
- 전략의 매개 변수는 조정할 수 있으며, 사용자는 다른 시간 주기 및 시장 환경에 따라 최적화하여 전략의 안정성을 높일 수 있다.
전략적 위험 분석
- 맥D 지표의 미래 움직임에 대한 예측에 의존하고, 예측이 정확하지 않으면 거래 실패로 이어진다.
- 단독 손실을 제어하기 위해 스톱로즈와 협력해야 한다. 스톱로즈 폭을 잘못 설정하는 것도 전략의 효과에 영향을 준다.
- 맥D 지표는 지연으로 인해 가격의 빠른 반전 기회를 놓칠 수 있습니다. 이것은 높은 변동성 상황에서 전략적 성능이 우려됩니다.
- 거래비용의 영향에 주의를 기울여야 합니다.
전략 최적화 방향
- 다른 지표와 결합하여 예측을 수행하여 단일 맥D 지표에 대한 의존도를 낮추고 예측 정확도를 향상시킵니다. 예를 들어 거래량 변화를 조사합니다.
- 머신러닝 알고리즘을 추가하여, 맥D 지표의 미래 흐름을 예측하는 모델을 훈련한다.
- 최적화 변수 설정, 최적의 변수 조합을 찾는 것.
- 다양한 시장 환경에 적합한 다른 파라미터 구성, 자기 적응 시스템 자동 최적화 파라미터를 추가할 수 있다.
요약하다
이 전략은 맥D 지표 판단 트렌드 장점을 최대한 활용하는 동시에, 지표의 미래 행보에 대한 예측 분석을 추가하고, 트렌드를 포착하는 기반에서 중요한 전환점을 잡는다. 단순한 추종 트렌드에 비해 이 전략의 적용은 전향성이 강하며, 수익의 여지가 더 크다. 물론, 특정 위험이 있으며, 추가 최적화 및 개선이 필요합니다.
전략 소스 코드
/*backtest
start: 2023-12-05 00:00:00
end: 2023-12-12 00:00:00
period: 5m
basePeriod: 1m
exchanges: [{"eid":"Futures_Binance","currency":"BTC_USDT"}]
*/

// @version=4
// This source code is subject to the terms of the Mozilla Public License 2.0 at https://mozilla.org/MPL/2.0/
// © x11joe
strategy(title="MacD (Future Known or Unknown) Strategy", overlay=false, precision=2,commission_value=0.26, initial_capital=10000, currency=currency.USD, default_qty_type=strategy.percent_of_equity, default_qty_value=100)

//OPTIONAL:: Allow only entries in the long or short position
allowOnlyLong = input(title="Allow position ONLY in LONG",type=input.bool, defval=false)
allowOnlyShort = input(title="Allow position ONLY in SHORT",type=input.bool, defval=false)


strategy.risk.allow_entry_in(allowOnlyLong ? strategy.direction.long : allowOnlyShort ? strategy.direction.short : strategy.direction.all) // There will be no short entries, only exits from long.

// Create MacD inputs
fastLen = input(title="MacD Fast Length", type=input.integer, defval=12)
slowLen = input(title="MacD Slow Length", type=input.integer, defval=26)
sigLen  = input(title="MacD Signal Length", type=input.integer, defval=9)

// Get MACD values
[macdLine, signalLine, _] = macd(close, fastLen, slowLen, sigLen)
hist = macdLine - signalLine

useFuture = input(title="Use The Future?",type=input.bool,defval=true)

macDState(resolutionType) =>
    hist_from_resolution = security(syminfo.tickerid, resolutionType, hist,barmerge.gaps_off, barmerge.lookahead_on)
    Green_IsUp = hist_from_resolution > hist_from_resolution[1] and hist_from_resolution > 0
    Green_IsDown = hist_from_resolution < hist_from_resolution[1] and hist_from_resolution > 0
    Red_IsDown = hist_from_resolution < hist_from_resolution[1] and hist_from_resolution <= 0
    Red_IsUp = hist_from_resolution > hist_from_resolution[1] and hist_from_resolution <= 0
    result=0
    if(Green_IsUp)
        result := 1
    if(Green_IsDown)
        result := 2
    if(Red_IsDown)
        result := 3
    if(Red_IsUp)
        result := 4
    result

macDStateNonFuture(resolutionType) =>
    hist_from_resolution = security(syminfo.tickerid, resolutionType, hist,barmerge.gaps_off, barmerge.lookahead_off)
    Green_IsUp = hist_from_resolution > hist_from_resolution[1] and hist_from_resolution > 0
    Green_IsDown = hist_from_resolution < hist_from_resolution[1] and hist_from_resolution > 0
    Red_IsDown = hist_from_resolution < hist_from_resolution[1] and hist_from_resolution <= 0
    Red_IsUp = hist_from_resolution > hist_from_resolution[1] and hist_from_resolution <= 0
    result=0
    if(Green_IsUp)
        result := 1
    if(Green_IsDown)
        result := 2
    if(Red_IsDown)
        result := 3
    if(Red_IsUp)
        result := 4
    result

// === INPUT BACKTEST RANGE ===
FromMonth = input(defval = 1, title = "From Month", minval = 1, maxval = 12)
FromDay   = input(defval = 1, title = "From Day", minval = 1, maxval = 31)
FromYear  = input(defval = 2019, title = "From Year", minval = 2017)
ToMonth   = input(defval = 1, title = "To Month", minval = 1, maxval = 12)
ToDay     = input(defval = 1, title = "To Day", minval = 1, maxval = 31)
ToYear    = input(defval = 9999, title = "To Year", minval = 2017)

start     = timestamp(FromYear, FromMonth, FromDay, 00, 00)  // backtest start window
finish    = timestamp(ToYear, ToMonth, ToDay, 23, 59)        // backtest finish window
window()  => time >= start and time <= finish ? true : false // create function "within window of time"
// === INPUT BACKTEST RANGE END ===

//Get FUTURE or NON FUTURE data
macDState240=useFuture ? macDState("240") : macDStateNonFuture("240") //1 is green up, 2 if green down, 3 is red, 4 is red up

//Fill in the GAPS
if(macDState240==0)
    macDState240:=macDState240[1]

//Plot Positions
plot(close,color= macDState240==1 ? color.green : macDState240==2 ? color.purple : macDState240==3 ? color.red : color.yellow,linewidth=4,style=plot.style_histogram,transp=50)

if(useFuture)
    strategy.entry("buy_1",long=true,when=window() and (macDState240==4 or macDState240==1))
    strategy.close("buy_1",when=window() and macDState240==3 and macDState240[1]==4)
    strategy.entry("sell_1",long=false,when=window() and macDState240==2)
else
    strategy.entry("buy_1",long=true,when=window() and (macDState240==4 or macDState240==1))//If we are in a red macD trending downwards MacD or in a MacD getting out of Red going upward.
    strategy.close("buy_1",when=window() and macDState240==3 and macDState240[1]==4)//If the state is going upwards from red but we are predicting back to red...
    strategy.entry("sell_1",long=false,when=window() and macDState240==2)//If we are predicting the uptrend to end soon.