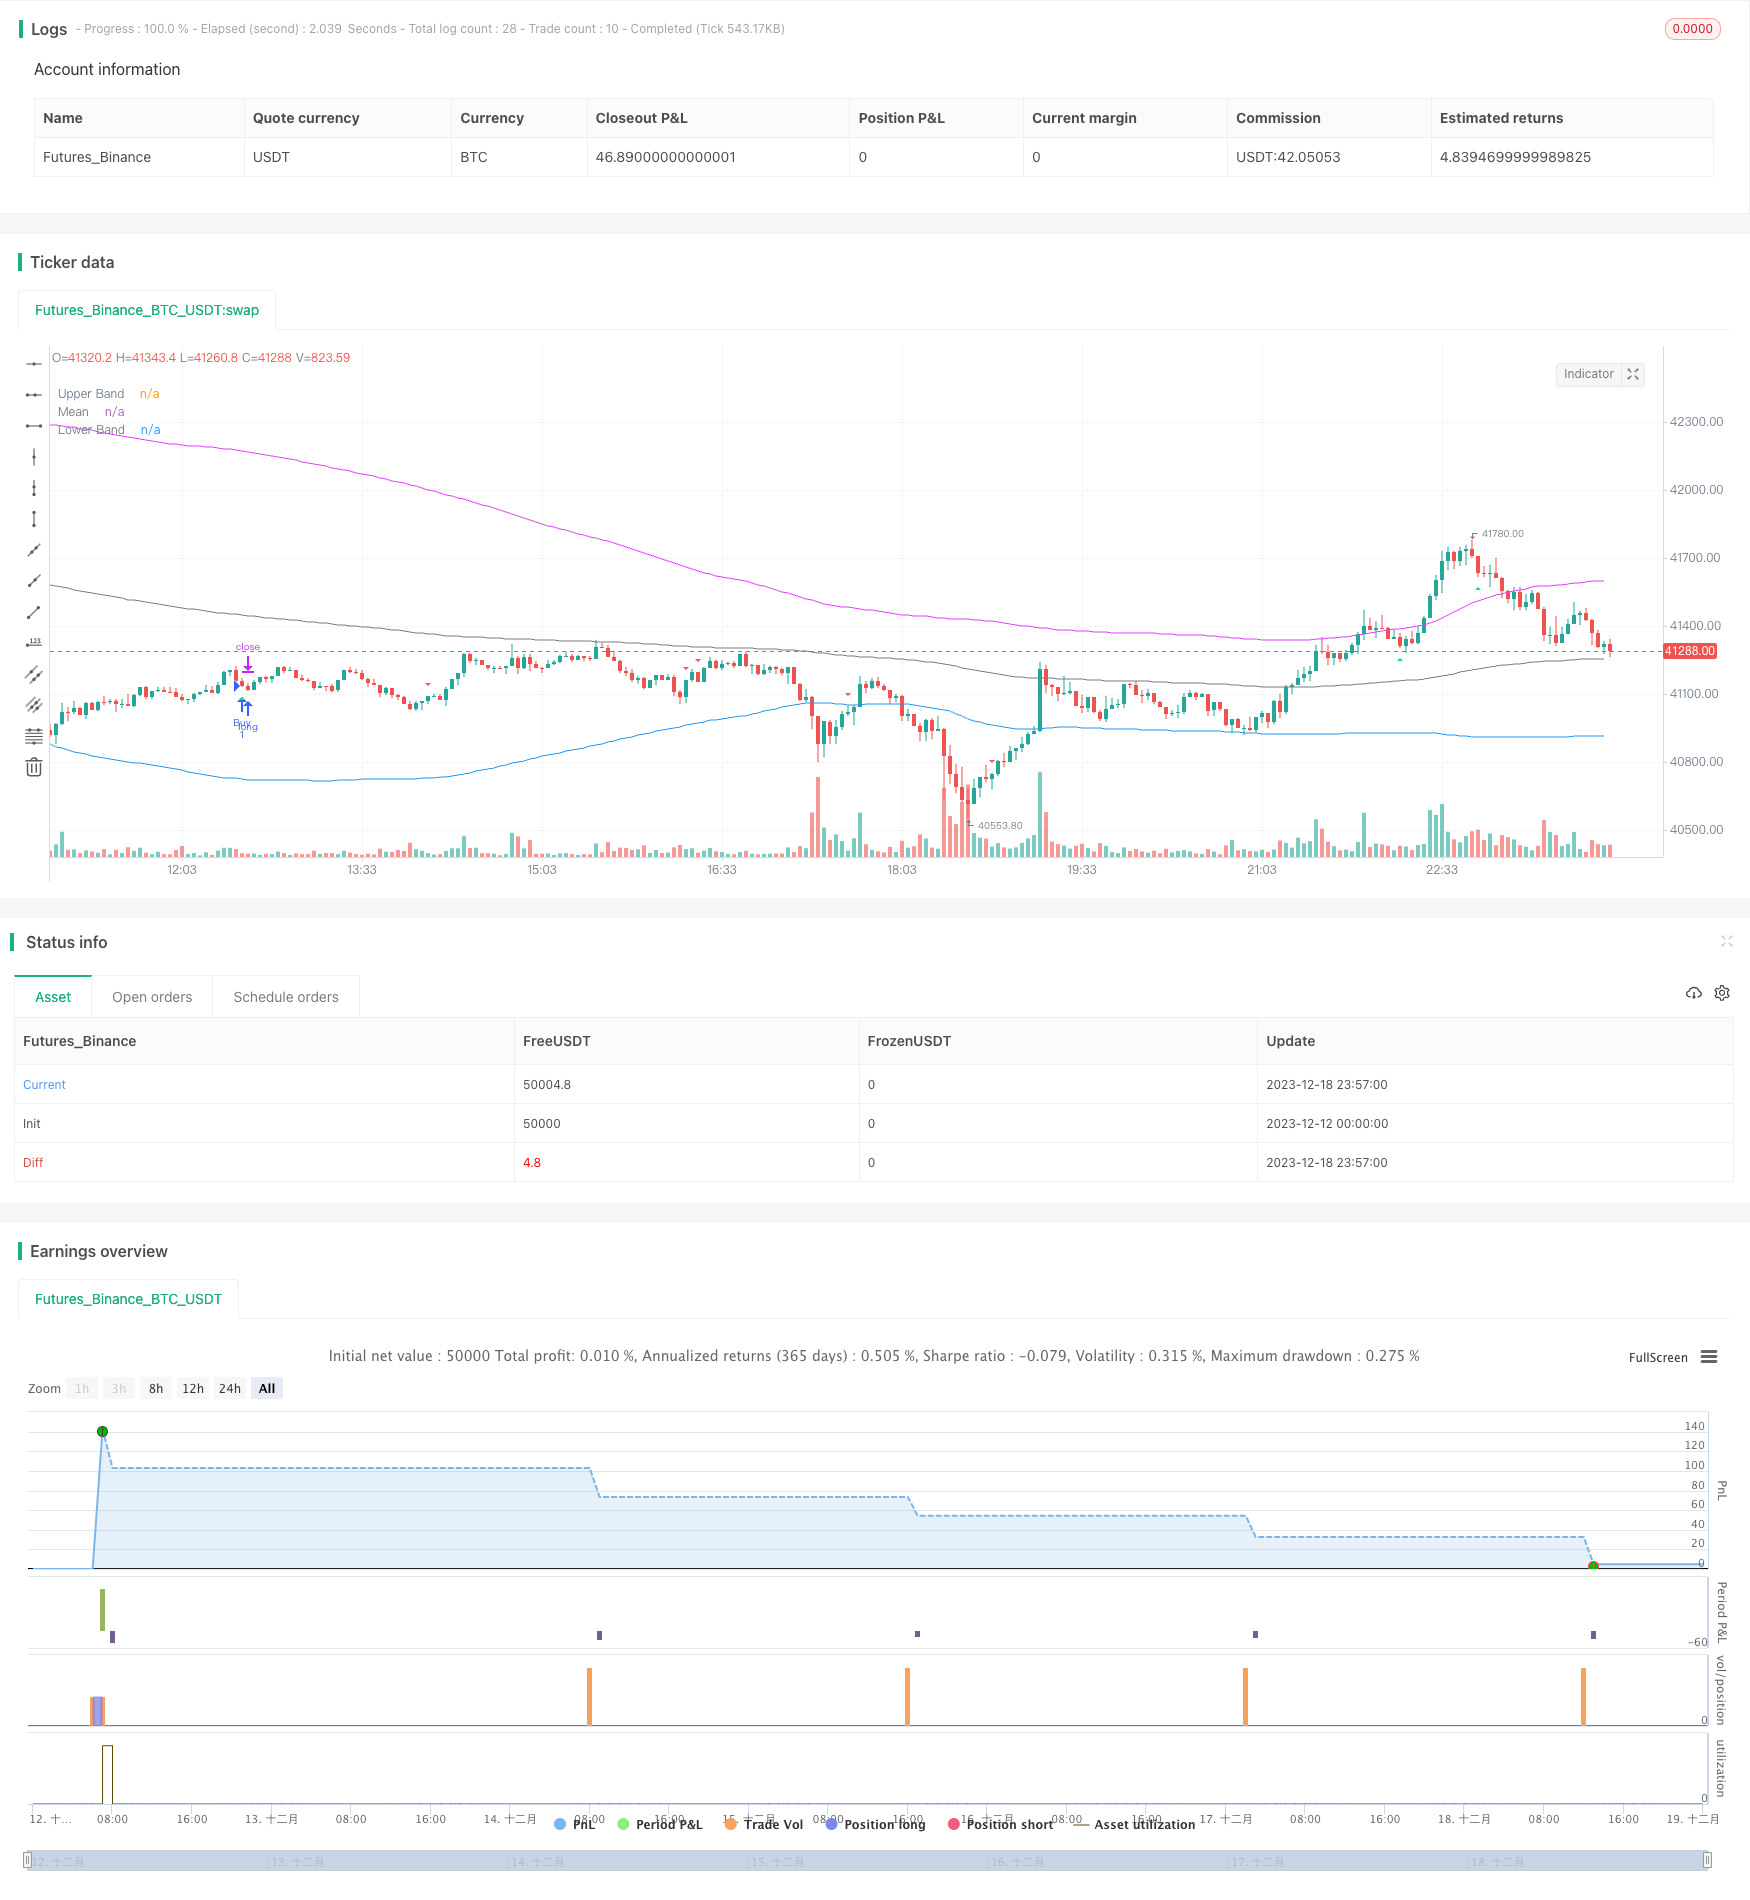
개요
반전 평균 돌파 전략은 다 요소의 조합으로 트렌드 돌파 전략이다. 그것은 이동 평균, 브린 밴드, CCI 지표, RSI 지표와 같은 여러 가지 기술 지표를 결합하여 가격의 오버 바이 오버 셀 영역에서 반전하는 기회를 잡기 위해 고안되었다. 이 전략은 또한 정규 산란 분석을 결합하여 현재 트렌드가 이전과 일치하는지 검출하여 거래 가짜 돌파를 방지 할 수 있습니다.
전략 원칙
이 전략의 핵심적인 논리는 가격이 초과된 지역에서 반전할 때 적절한 상장 방법을 취하는 것이다. 구체적으로, 이 전략은 4가지 측면에서 반전 기회를 판단한다:
CCI 지표 또는 동력 지표는 과매매를 판단하기 위해 황금 포크 사형 포크 신호를 낸다.
RSI 지표는 오버 바이 오버 셀 영역에 있는지 판단한다. RSI가 65보다 높으면 오버 바이 영역이고, 35보다 낮으면 오버 셀 영역이다.
브린띠를 이용하여 하향 궤도를 판단하여 가격이 정상 영역에서 벗어나지 않았는지 판단한다. 가격이 정상 영역으로 다시 들어가면 역전될 수 있다.
RSI 지표의 정규 산란을 검출하여 가짜 돌파구를 쫓는 것을 피하십시오.
위의 조건이 충족되면, 전략은 역방향으로 진입한다. 그리고 스톱로스를 설정하여 위험을 통제한다.
전략적 이점
이 전략의 가장 큰 장점은 여러 지표를 조합하여 반전 기회를 판단하고 평균 승률이 높다는 것입니다. 구체적으로 다음과 같은 점들이 주요입니다:
다인자 판단, 신뢰도가 높습니다. 단일 지표에 의존하지 않고, 잘못된 판단의 가능성을 줄입니다.
역전 거래는 승리할 확률이 높습니다. 트렌드 반전은 더 신뢰할 수 있는 거래 방법입니다.
산발성을 탐지하고, 가짜 돌파구를 쫓는 것을 피하고, 체계적인 위험을 줄여줍니다.
손해 방지 장치 위험 제어. 단일 손실을 극대화 할 수 있습니다.
위험과 해결
이 전략에는 다음과 같은 몇 가지 위험도 있습니다.
반전 시점을 판단하는 것은 부정확하다. 이로 인해 정지 손실이 유발된다. 정지 범위를 적절히 확장할 수 있다.
부린띠 파라미터가 잘못 설정되어 정상적인 가격이 이상으로 간주된다. 시장의 변동률 설정 파라미터와 함께 해야 한다.
거래 횟수가 더 많을 수 있다. CCI와 같은 판단 매개 변수 범위를 적절히 확장하여 거래 횟수를 줄일 수 있다.
다공간 균형은 크게 달라질 수 있다. 지표 파라미터가 합리적인지는 역사적 데이터에 따라 판단해야 한다.
최적화 방향
이 전략은 다음과 같은 방향으로 최적화될 수 있습니다.
기계 학습 알고리즘을 사용하여 지표 변수를 자동으로 최적화하십시오. 인적 경험 오류를 피하십시오.
셰일 지표, 폭 지표 등으로 과매매의 강도를 판단한다.
거래량 지표의 증가로 역전 신뢰성을 판단할 수 있다. 예를 들어 거래량, 보유 데이터 등이다.
블록체인 데이터와 결합하여 시장의 정서를 판단하는 것. 전략의 적합성을 높이는 것.
적응형 스톱스 메커니즘을 도입한다. 시장의 변동에 따라 스톱스 지점을 조정한다.
요약하다
반전 평균 돌파 전략은 반전 기회를 판단하는 여러 지표를 종합적으로 사용한다. 위험을 통제하는 전제 하에서, 승률이 높다. 이 전략은 매우 실용성이 있으며, 추가 최적화 할 여지가 있다. 파라미터가 적절하게 설정되면 비교적 이상적인 효과를 얻을 수 있다.
/*backtest
start: 2023-12-12 00:00:00
end: 2023-12-19 00:00:00
period: 3m
basePeriod: 1m
exchanges: [{"eid":"Futures_Binance","currency":"BTC_USDT"}]
*/

//@version=5
strategy(title='BroTheJo Strategy', shorttitle='BTJ INV', overlay=true)

// Input settings
stopLossInPips = input.int(10, minval=0, title='Stop Loss (in Pips)')
ccimomCross = input.string('CCI', 'Entry Signal Source', options=['CCI', 'Momentum'])
ccimomLength = input.int(10, minval=1, title='CCI/Momentum Length')
useDivergence = input.bool(false, title='Find Regular Bullish/Bearish Divergence')
rsiOverbought = input.int(65, minval=1, title='RSI Overbought Level')
rsiOversold = input.int(35, minval=1, title='RSI Oversold Level')
rsiLength = input.int(14, minval=1, title='RSI Length')
plotMeanReversion = input.bool(true, 'Plot Mean Reversion Bands on the chart')
emaPeriod = input(200, title='Lookback Period (EMA)')
bandMultiplier = input.float(1.6, title='Outer Bands Multiplier')

// CCI and Momentum calculation
momLength = ccimomCross == 'Momentum' ? ccimomLength : 10
mom = close - close[momLength]
cci = ta.cci(close, ccimomLength)
ccimomCrossUp = ccimomCross == 'Momentum' ? ta.cross(mom, 0) : ta.cross(cci, 0)
ccimomCrossDown = ccimomCross == 'Momentum' ? ta.cross(0, mom) : ta.cross(0, cci)

// RSI calculation
src = close
up = ta.rma(math.max(ta.change(src), 0), rsiLength)
down = ta.rma(-math.min(ta.change(src), 0), rsiLength)
rsi = down == 0 ? 100 : up == 0 ? 0 : 100 - 100 / (1 + up / down)
oversoldAgo = rsi[0] <= rsiOversold or rsi[1] <= rsiOversold or rsi[2] <= rsiOversold or rsi[3] <= rsiOversold
overboughtAgo = rsi[0] >= rsiOverbought or rsi[1] >= rsiOverbought or rsi[2] >= rsiOverbought or rsi[3] >= rsiOverbought

// Regular Divergence Conditions
bullishDivergenceCondition = rsi[0] > rsi[1] and rsi[1] < rsi[2]
bearishDivergenceCondition = rsi[0] < rsi[1] and rsi[1] > rsi[2]

// Mean Reversion Indicator
meanReversion = plotMeanReversion ? ta.ema(close, emaPeriod) : na
stdDev = plotMeanReversion ? ta.stdev(close, emaPeriod) : na
upperBand = plotMeanReversion ? meanReversion + stdDev * bandMultiplier : na
lowerBand = plotMeanReversion ? meanReversion - stdDev * bandMultiplier : na

// Entry Conditions
prevHigh = ta.highest(high, 1)
prevLow = ta.lowest(low, 1)
shortEntryCondition = ccimomCrossUp and oversoldAgo and (not useDivergence or bullishDivergenceCondition) and (prevHigh >= meanReversion) and (prevLow >= meanReversion)
longEntryCondition = ccimomCrossDown and overboughtAgo and (not useDivergence or bearishDivergenceCondition) and (prevHigh <= meanReversion) and (prevLow <= meanReversion)

// Plotting
oldShortEntryCondition = ccimomCrossUp and oversoldAgo and (not useDivergence or bullishDivergenceCondition)
oldLongEntryCondition = ccimomCrossDown and overboughtAgo and (not useDivergence or bearishDivergenceCondition)
plotshape(oldLongEntryCondition, title='BUY', style=shape.triangleup, text='B', location=location.belowbar, color=color.new(color.lime, 0), textcolor=color.new(color.white, 0), size=size.tiny)
plotshape(oldShortEntryCondition, title='SELL', style=shape.triangledown, text='S', location=location.abovebar, color=color.new(color.red, 0), textcolor=color.new(color.white, 0), size=size.tiny)

// Strategy logic
if (longEntryCondition)
    stopLoss = close - stopLossInPips
    strategy.entry("Buy", strategy.long)
    strategy.exit("exit", "Buy", stop=stopLoss)
if (shortEntryCondition)
    stopLoss = close + stopLossInPips
    strategy.entry("Sell", strategy.short)
    strategy.exit("exit", "Sell", stop=stopLoss)

// Close all open positions when outside of bands
closeAll = (high >= upperBand) or (low <= lowerBand)

if (closeAll)
    strategy.close_all("Take Profit/Cut Loss")

// Plotting
plot(upperBand, title='Upper Band', color=color.fuchsia, linewidth=1)
plot(meanReversion, title='Mean', color=color.gray, linewidth=1)
plot(lowerBand, title='Lower Band', color=color.blue, linewidth=1)