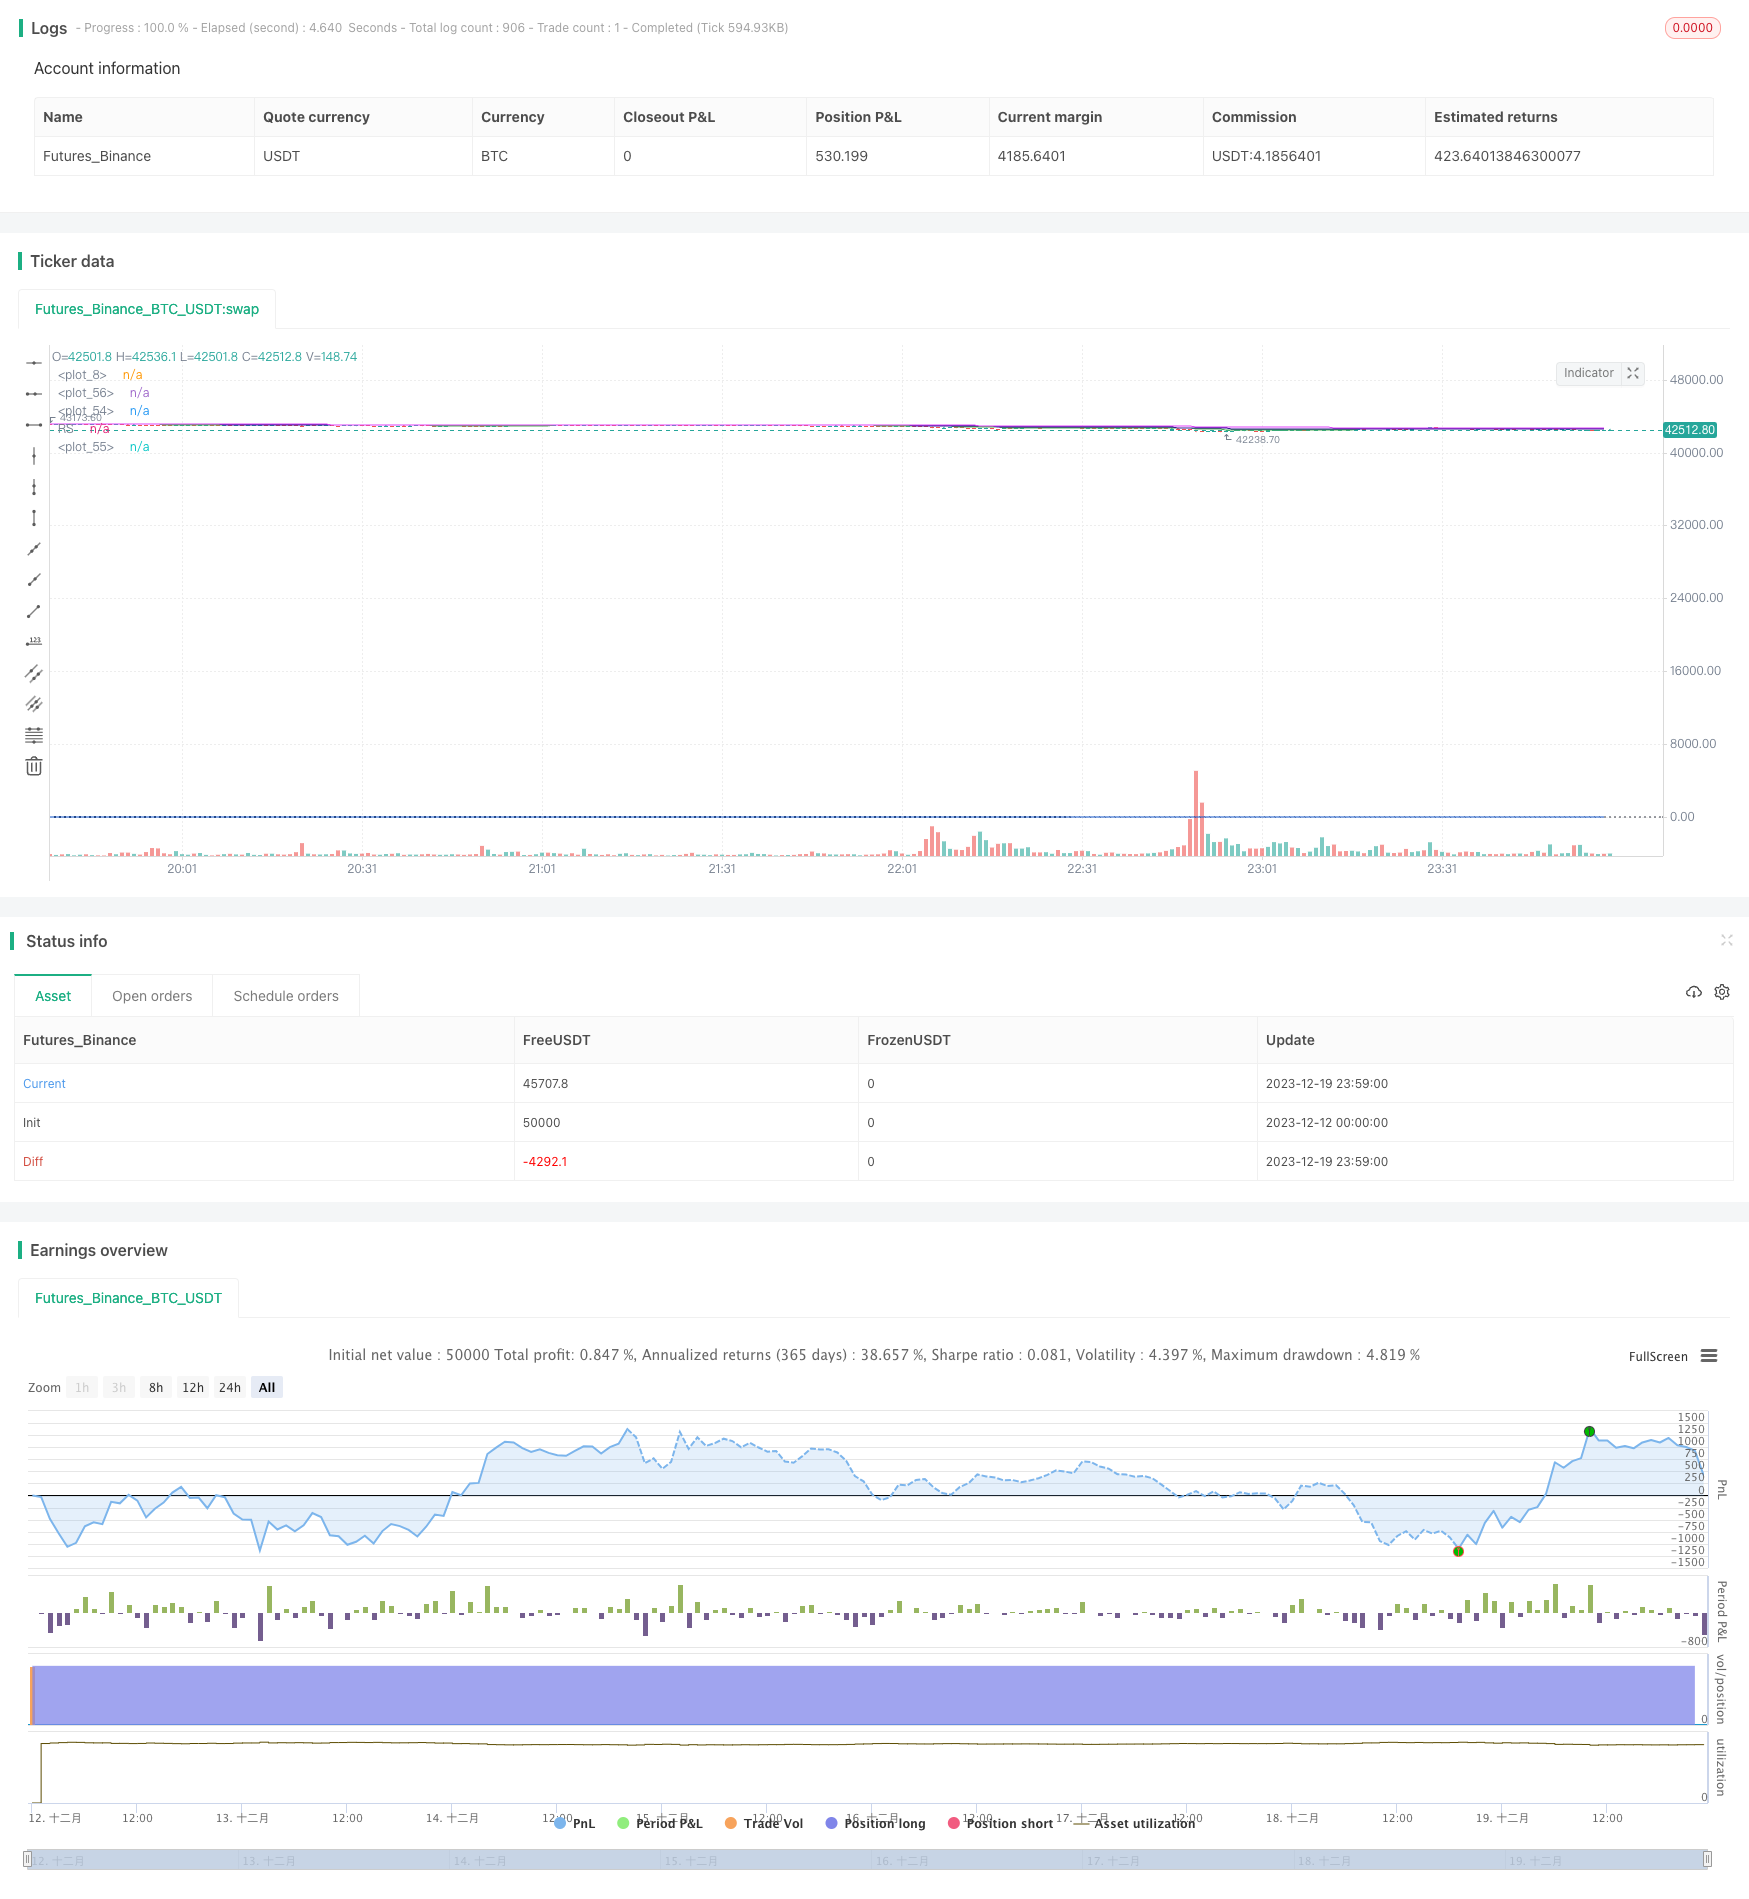
概述
本策略基于双均线和相对强度指标,结合股票的历史波动率,实现股票的自动买入和卖出。策略优点是实现了长线和短线结合,能够有效控制风险。但是也存在一定的改进空间,比如可以考虑加入止损机制。
策略原理
策略使用150周 linea均线和50日线快速均线组成的双均线系统,以及20日线最快均线。当价格上穿150周线时认为行情start上行,当价格下穿50日线时认为行情开始下行。这样可以实现在行情上行中追涨杀跌,在下行中随时止损。
此外,策略还使用了年化波动率最高价和相对强度指标来确定具体的买入时机。只有当收盘价超过年化波动率计算的最高价,并且相对强度指标为正时,才会发出买入信号。
策略优势
- 使用双均线系统,能够有效判断主要趋势的变化,实现追涨杀跌
- 波动率指标和强度指标的加入,可以避免在震荡行情中随波逐流
- 20日快速均线的加入,可以更快止损
策略风险
- 存在一定的滞后,无法快速止损
- 没有设置止损位,容易出现较大亏损
- 缺乏参数优化,参数设置比较主观
为了解决风险,可以设置止损位,或者使用ATR指标的倍数作为止损幅度。此外可以通过更严格的回测来优化参数。
策略优化方向
- 增加止损机制
- 使用参数优化方法找到最优参数 3.考虑加入其它指标过滤信号,例如成交量指标等
- 可以考虑将策略打造成多因子模型,结合更多指标
总结
本策略总体来说是比较保守的股票投资策略。使用双均线判断主要趋势,并结合波动率和强度指标进场,可以有效过滤假突破。快速均线的加入也使止损更加快速。但是策略可以进一步优化,例如加入止损机制,使用参数优化等手段。总的来说,本策略适合长线持有股票的投资者使用。
策略源码
/*backtest
start: 2023-12-12 00:00:00
end: 2023-12-20 00:00:00
period: 1m
basePeriod: 1m
exchanges: [{"eid":"Futures_Binance","currency":"BTC_USDT"}]
*/

//@version=4
//Relative Strength
strategy("Stan my man", overlay=true)
comparativeTickerId = input("BTC_USDT:swap",  title="Comparative Symbol")
l = input(50, type=input.integer, minval=1, title="Period")
baseSymbol = security(syminfo.tickerid, timeframe.period, close)
comparativeSymbol = security(comparativeTickerId, timeframe.period, close)
hline(0, color=color.black, linestyle=hline.style_dotted)
res = baseSymbol / baseSymbol[l] /(comparativeSymbol / comparativeSymbol[l]) - 1
plot(res, title="RS", color=#1155CC)

//volume ma
vol1 = sma(volume,20)
// 30 week ma
ema1 = ema(close, 150)
//consolidation
h1 = highest(high[1],365)

fastPeriod = input(title="Fast MA", type=input.integer, defval=50)
slowPeriod = input(title="Slow MA", type=input.integer, defval=150)
fastestperiod = input(title="Fastest MA", type=input.integer, defval=20)

fastEMA = ema(close, fastPeriod)
slowEMA = ema(close, slowPeriod)
fastestEMA = ema(close, fastestperiod)

monitorStrategy = close < close[20]


// trade conditions
buytradecondition1 = close >ema1 and res>0 and volume> 1.5*vol1 and close > h1
buytradecondition2 = close > fastEMA  and volume> 1.5* vol1
selltradecondition1  = close< 0.95 * fastEMA
selltradecondition2  = close< 0.90 * open

if (buytradecondition1)
    strategy.entry("long",strategy.long,alert_message ="Seems ready to Buy")
    alert("Buy Alert Price (" + tostring(close) + ") crossed over Slow moving average",alert.freq_all)

if (buytradecondition2)
    strategy.entry("long",strategy.long,alert_message ="Seems ready to Buy")
    alert("Buy Alert Price (" + tostring(close) + ") crossed over fast moving average",alert.freq_all)

if (selltradecondition1)
    strategy.close("long",alert_message ="Seems ready to Sell")
    alert("Sell Alert Price (" + tostring(close) + ") crossed down fast moving average",alert.freq_all)

if (selltradecondition2)
    strategy.close("long",alert_message ="Seems ready to Sell")
    alert("Sell Alert Price (" + tostring(close) + ") crossed down 10% below open price  ",alert.freq_all)

//alertcondition(buytradecondition1,title ="BuySignal", message ="Price Crossed Slow Moving EMA ")

plot(fastEMA, color=color.navy)
plot(slowEMA, color=color.fuchsia)
plot(fastestEMA, color=color.green)