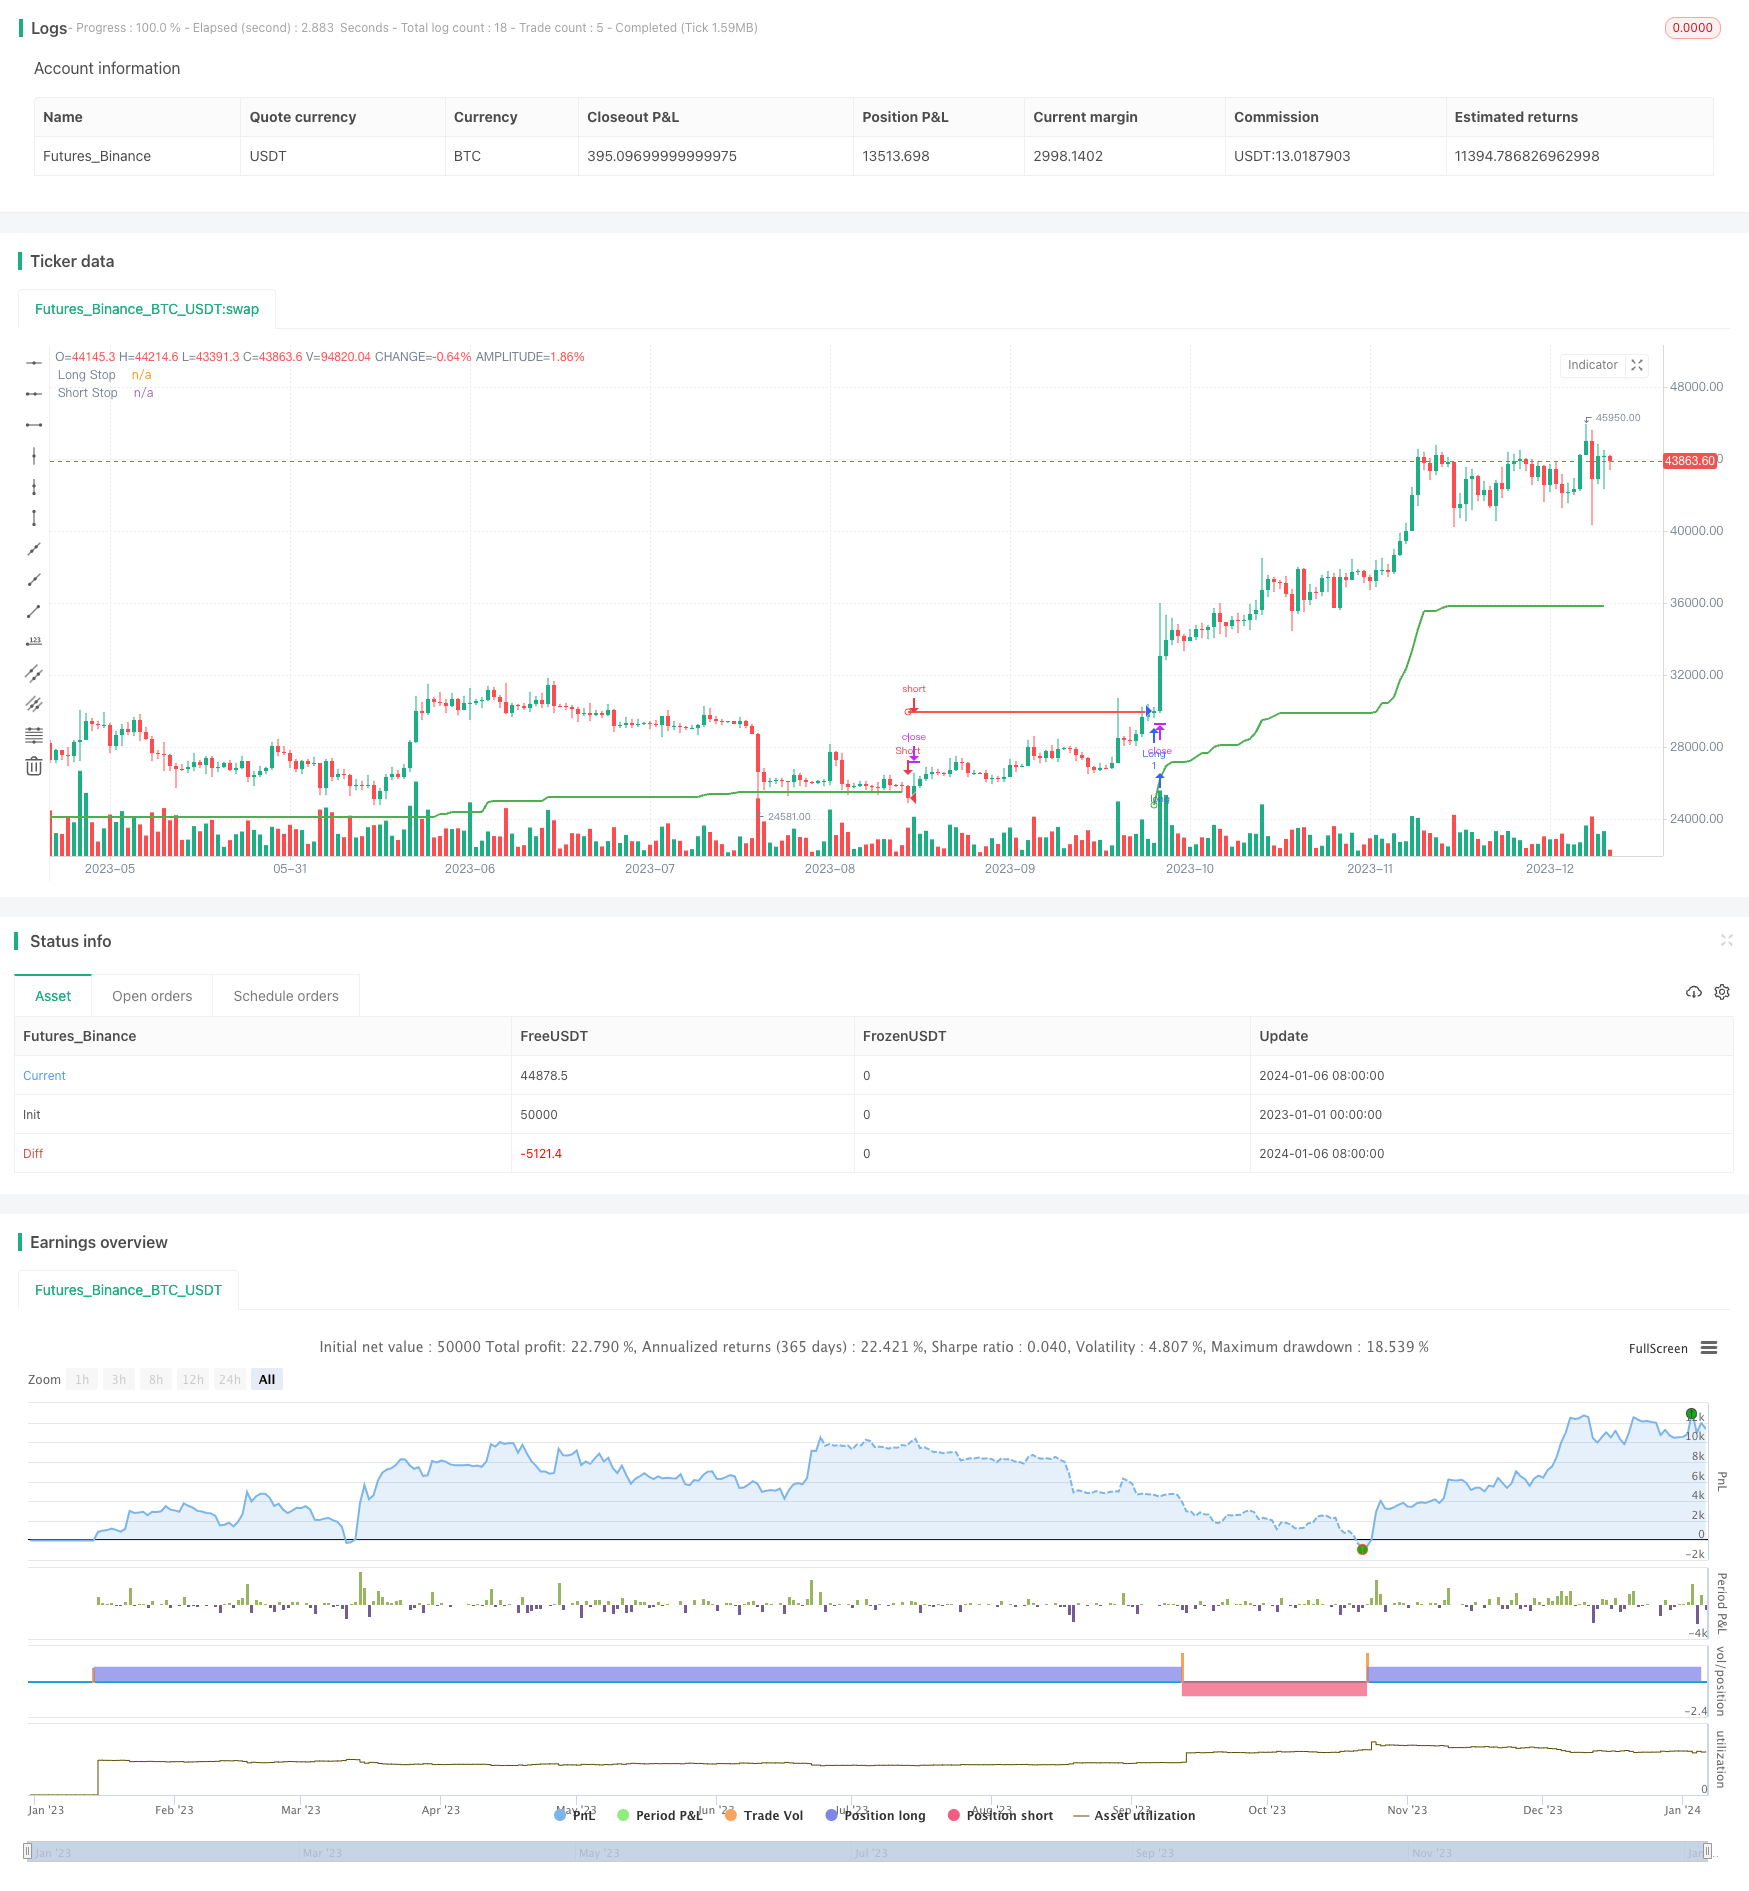
개요
이 전략은 슈퍼 트렌드 지표를 기반으로 ATR과 결합하여 동적으로 스톱 라인을 설정하여 이더리움의 강력한 추세에서 이익을 얻습니다. 코인베이스 거래소의 ETH/USD 거래 쌍에서 작동 할 수 있습니다.
전략 원칙
이 전략은 트렌드 방향을 판단하기 위해 고전적인 트렌드 추적 지표와 슈퍼 트렌드 지표를 사용합니다. 슈퍼 트렌드 지표는 두 개의 곡선으로 구성됩니다.
- 그리고 그 다음으로, 상향의 상쇄선 (uptrend stop loss line) 이 있고, 그 다음으로, 부진의 중에도 더 많은 상쇄선을 보유하고 있다.
- 하향 트렌드 스톱 손실 라인, 하향 트렌드 중 항공권을 보유한다.
가격이 상승 추세에서 하향 추세로 바뀌었을 때, 공평 입장을 취합니다. 가격이 하향 추세에서 상승 추세로 바뀌었을 때, 다중 입장을 취합니다.
또한, 전략은 ATR 지표를 사용하여 스톱 라인의 위치를 동적으로 조정한다. 구체적으로, 상승 스톱 라인의 위치는 최고 가격과 최저 가격의 평균을 ATR 곱하기 1 인수; 하락 스톱 라인의 위치는 최고 가격과 최저 가격의 평균을 ATR 곱하기 1 인수 더한다. 따라서 시장의 변동 정도에 따라 스톱 라인을 조정할 수 있다.
입력된 신호가 발신된 후, 가격이 다시 스톱로스 라인을 넘으면 스톱로스 탈퇴를 한다.
전략적 이점
이 트렌드 추적 전략은 다음과 같은 장점을 가지고 있습니다.
- 슈퍼 트렌드 지표를 사용하여 트렌드 방향을 판단하는 것이 신뢰성이 높습니다.
- ATR을 적용하여 스톱 라인을 조정하여 위험을 효과적으로 제어할 수 있습니다.
- 전략의 논리는 간단하고 명확하며 이해하기 쉽고 수정할 수 있습니다.
- 디지털 화폐 시장의 높은 변동성에서 수익을 얻을 수 있습니다.
전략적 위험
이 전략에는 몇 가지 위험도 있습니다.
- 슈퍼 트렌드 지표에 대한 잘못된 판단의 가능성이 존재하여 불필요한 손실을 초래할 수 있습니다.
- ATR 상쇄는 너무 급진적이어서 가격의 역전으로 막을 수 있습니다.
- 디지털 화폐 시장의 변동성이 커지고, 정지상태가 깨질 가능성이 높습니다.
- 거래 수수료가 높은 거래소는 최종 수익에 영향을 미칩니다.
위와 같은 위험을 줄이기 위해 ATR 계수를 적절히 조정하거나 다른 지표와 결합하여 거래 신호를 필터링 할 수 있습니다.
전략 최적화 방향
이 전략에는 더 많은 최적화 가능성이 있습니다:
- 더 많은 지표 조합을 도입하여 신호의 정확도를 높일 수 있습니다.
- ATR 계수와 길이 변수의 최적값을 연구할 수 있습니다.
- 포지션 크기를 동적으로 조정하기 위해 리스크 차단 비율을 설정할 수 있습니다.
- 더 많은 디지털 통화 거래 쌍에서 전략의 효과를 테스트 할 수 있습니다.
요약하다
이 전략은 전체적으로 검증된 신뢰할 수 있는 트렌드 추적 전략이다. 이 전략은 슈퍼 트렌드 지표를 사용하여 트렌드 방향을 판단하고 ATR을 사용하여 손실 위치를 조정하여 위험을 제어하면서 이익을 얻는다. 이 전략은 높은 변동성이있는 디지털 통화 거래에 적합하며, 이더리움과 같은 주류 화폐에 효과가 좋습니다.
/*backtest
start: 2023-01-01 00:00:00
end: 2024-01-07 00:00:00
period: 1d
basePeriod: 1h
exchanges: [{"eid":"Futures_Binance","currency":"BTC_USDT"}]
*/

//@version=4
strategy("SuperTrend Strategy",
     overlay=true,
     initial_capital=2e3,
     process_orders_on_close=true,
     commission_type=strategy.commission.percent,
     commission_value=0.1
     )

length = input(title="ATR Period", type=input.integer, defval=21)
mult = input(title="ATR Multiplier", type=input.float, step=.25, defval=6.2)
wicks = input(title="Take Wicks into Account ?", type=input.bool, defval=false)

useDate = input(title="Start from Specific Date ?", defval=false)
yearStart = input(title="Start Year", defval=2019)
monthStart = input(title="Start Month", minval=1, maxval=12, defval=1)
dayStart = input(title="Start Day", minval=1, maxval=31, defval=1)

startTime = timestamp(yearStart, monthStart, dayStart, 0, 0)
startFrom = useDate ? time(timeframe.period) >= startTime : true

atr = mult * ta.atr(length)

longStop = hl2 - atr
longStopPrev = nz(longStop[1], longStop)
longStop := (wicks ? low[1] : close[1]) > longStopPrev ? math.max(longStop, longStopPrev) : longStop

shortStop = hl2 + atr
shortStopPrev = nz(shortStop[1], shortStop)
shortStop := (wicks ? high[1] : close[1]) < shortStopPrev ? math.min(shortStop, shortStopPrev) : shortStop

dir = 1
dir := nz(dir[1], dir)
dir := dir == -1 and (wicks ? high : close) > shortStopPrev ? 1 : dir == 1 and (wicks ? low : close) < longStopPrev ? -1 : dir

longColor = color.green
shortColor = color.red

plot(dir == 1 ? longStop : na, title="Long Stop", style=plot.style_linebr, linewidth=2, color=longColor)
plotshape(dir == 1 and dir[1] == -1 ? longStop : na, title="Long Start", location=location.absolute, style=shape.circle, size=size.tiny, color=longColor, transp=0)

plot(dir == 1 ? na : shortStop, title="Short Stop", style=plot.style_linebr, linewidth=2, color=shortColor)
plotshape(dir == -1 and dir[1] == 1 ? shortStop : na, title="Short Start", location=location.absolute, style=shape.circle, size=size.tiny, color=shortColor, transp=0)

longCondition = dir[1] == -1 and dir == 1
if longCondition and startFrom
    strategy.entry("Long", strategy.long, stop=longStop)
else
    strategy.cancel("Long")

shortCondition = dir[1] == 1 and dir == -1
if shortCondition and startFrom
    strategy.entry("Short", strategy.short, stop=shortStop)
else
    strategy.cancel("Short")