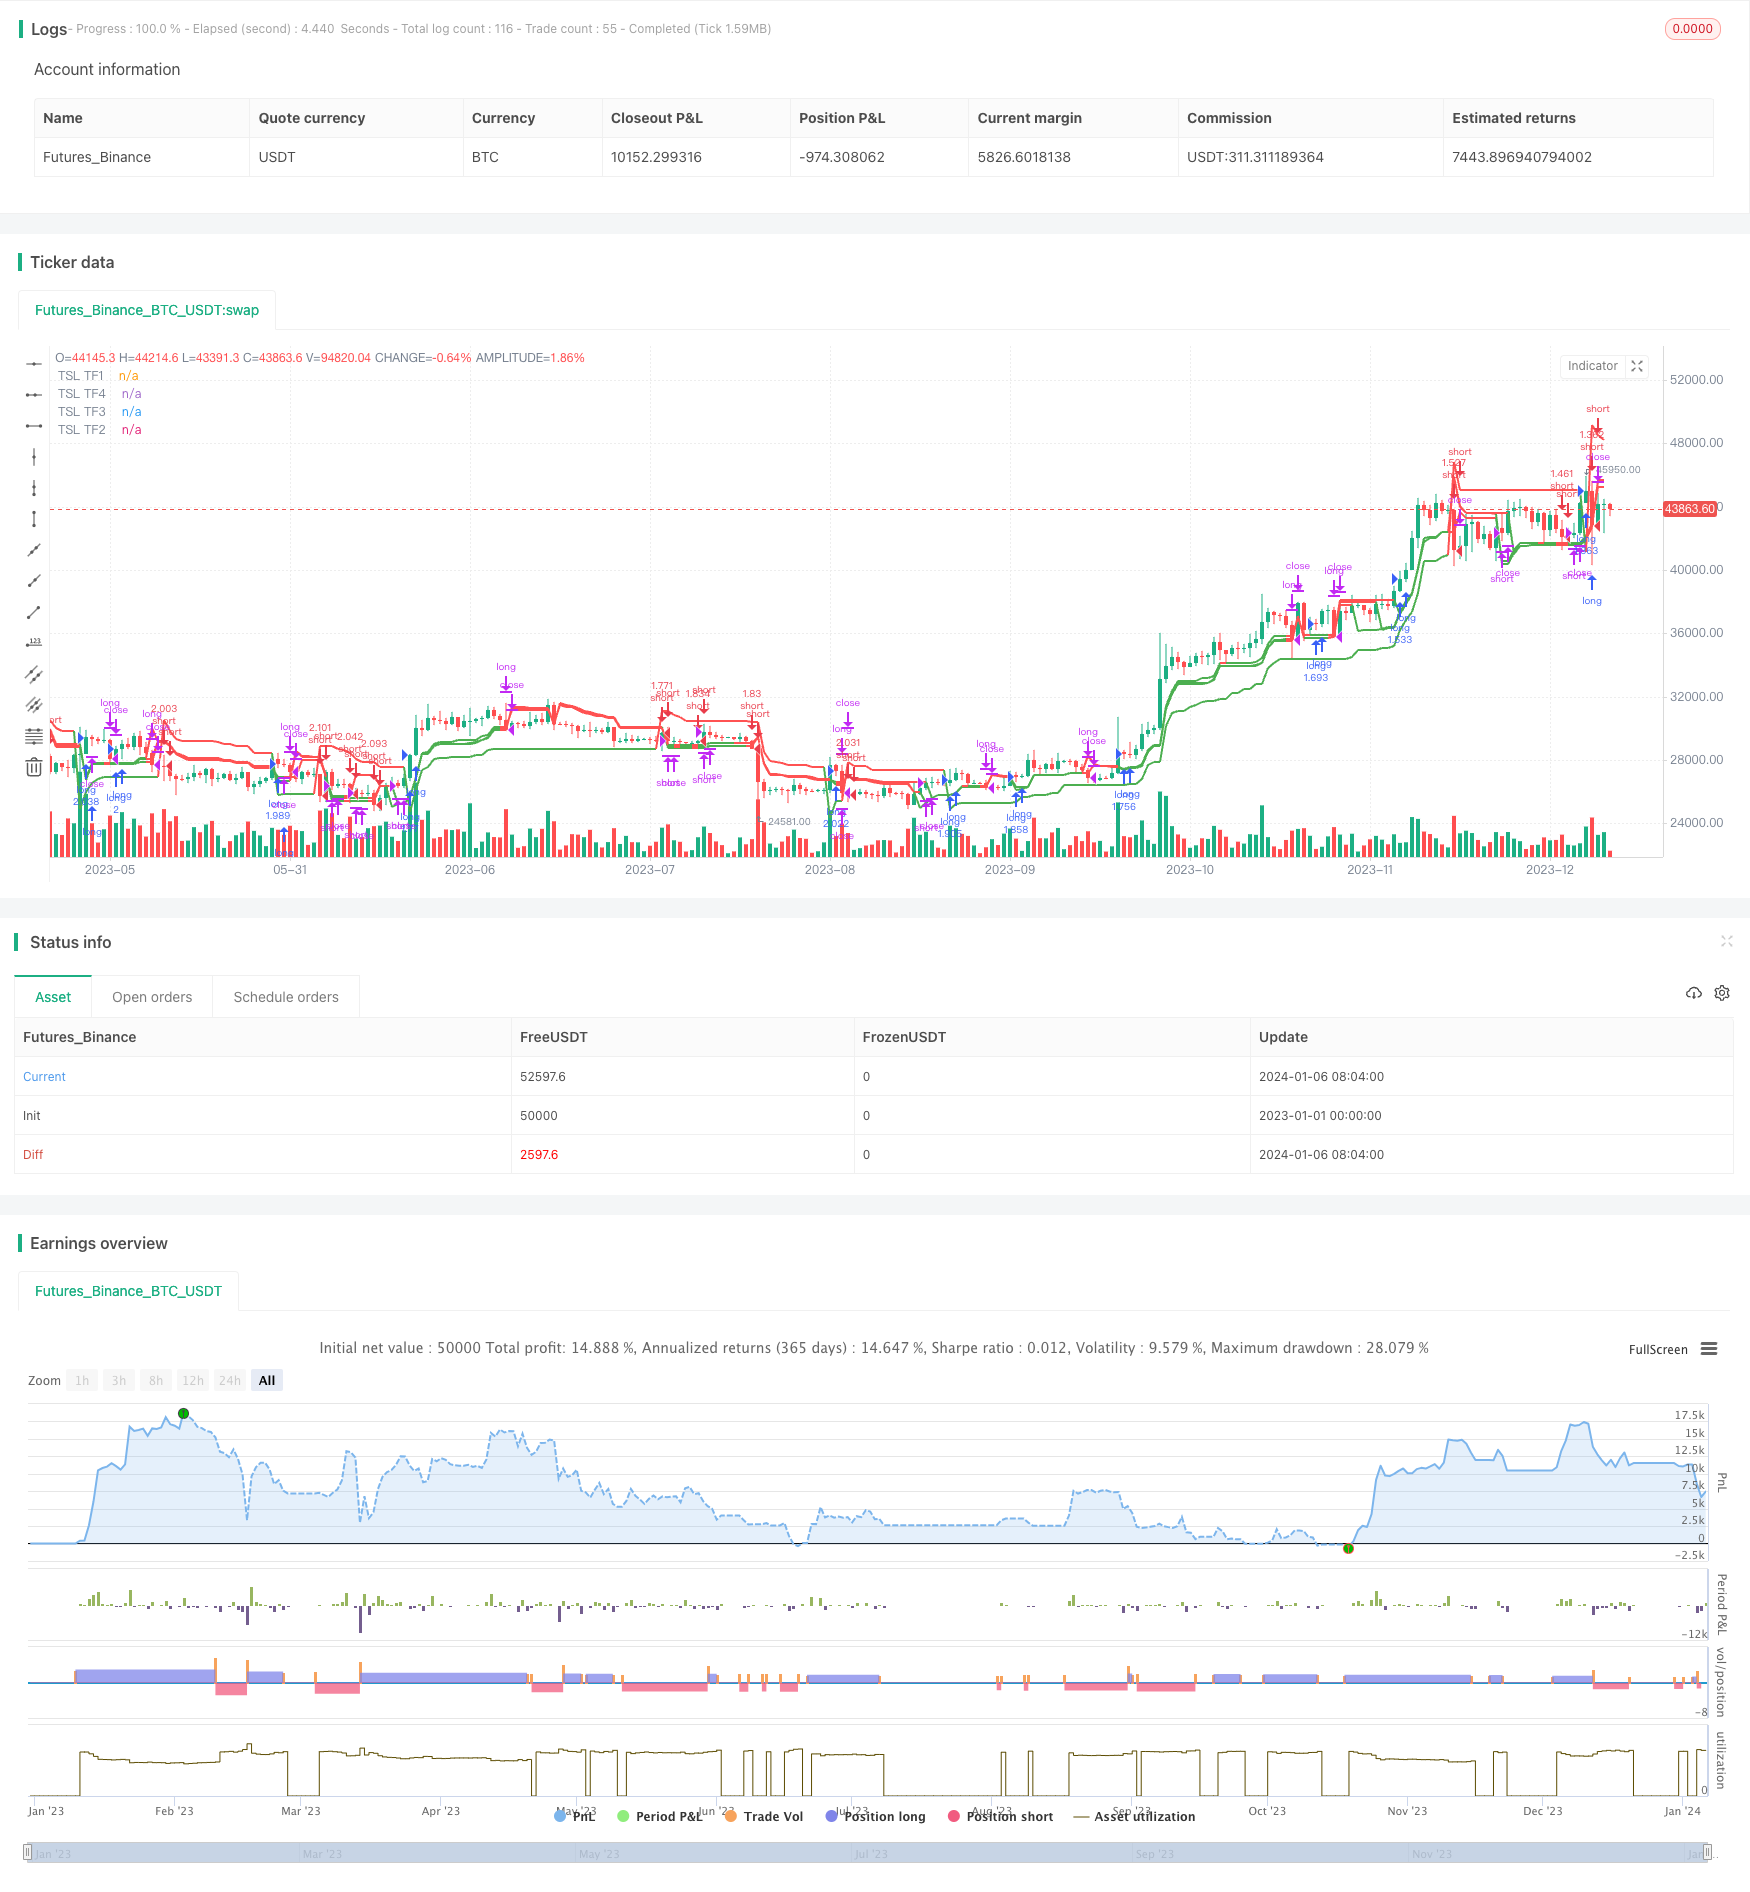
概述
本策略是我之前发布的简单跟踪止损策略的多时间框架版本。之前的策略只使用基本的跟踪止损来进入仓位。它效果很好,所以我尝试对它进行了一些改进。我想如果在不同的时间框架上使用相同的ATR跟踪止损,并将它们合并成一个信号,会发生什么。
在该策略中,您可以仅使用ATR止损,并选择另外3个更高时间框架,以及当前时间框架。这些时间框架上的跟踪止损将在图表上绘制。如果所有4个时间框架都发出多头信号,则入场做多。当至少有2个时间框架不同意多头信号时,平掉多头仓位。对于做空也是相同的逻辑。
策略原理
该策略的核心在于跟踪止损和趋势跟随。跟踪止损用于设置止损位,根据ATR值计算,可以有效避免止损被突破。趋势跟随则通过观察不同时间框架上的趋势方向来决定入场。
具体来说,策略首先在不同时间框架上计算ATR值,并设置止损距离。然后判断价格突破止损位时发出做多或做空信号。如果多个时间框架上的信号一致,那么就入场。此后继续跟踪该方向的止损位。如果一定比例的时间框架信号发生反转,则平仓。
通过结合不同周期的趋势判断,可以有效过滤假突破。同时跟踪止损可以锁定利润,有效控制风险。
策略优势
- 使用多时间框架判断,可有效过滤噪音,识别趋势方向
- ATR跟踪止损方式可以动态调整止损距离,降低被套利概率
- 结合趋势跟随和止损管理,既可以Following Trend又可以及时止损
- 参数较少,容易理解和调优
风险分析
- ATR止损如果参数设置不当,可能过于靠近或远离价格,容易被突破或止损距离过大
- 多时间框架组合如果参数设置不当,可能无法有效发挥作用或者判断错误
- 需要同时配置好止损参数和时间框架参数,否则可能无法达到最佳效果
解决方法:
- 反复测试不同的参数组合和品种,找到最佳参数
- 优化时间框架的比例和数量,确保可以提供可靠的趋势判断
- 调整ATR止损的倍数,在止损不被突破和距离不太大之间找到平衡
优化方向
策略可以从以下方面进行优化:
- 增加或减少时间框架的数量,找到判断最佳趋势的框架组合
- 测试不同的ATR倍数,确定最佳的止损距离
- 添加再入场机制,在趋势持续时建立更多头寸
- 结合其他指标过滤入场时机,例如量价指标等
- 针对不同品种参数进行优化
总结
本策略通过多时间框架ATR跟踪止损的方式,实现了趋势跟随和风险控制的有机结合。相比单一止损,它可以更加清晰地判断趋势方向;相比单时间框架,它过滤了很多噪音。止损参数和时间框架的合理配置是实现最佳效果的关键。该策略适用于能容忍一定回撤的投资者,可以获得较稳定的投资回报。它还有进一步的优化空间和拓展性,是非常有前途的一个策略思路。
策略源码
/*backtest
start: 2023-01-01 00:00:00
end: 2024-01-07 00:00:00
period: 1d
basePeriod: 1h
exchanges: [{"eid":"Futures_Binance","currency":"BTC_USDT"}]
*/

//@version=4
strategy(title="MTF Trailing SL Strategy [QuantNomad]", shorttitle = "MTF TrailingSL [QN]", overlay = true, default_qty_type = strategy.percent_of_equity, default_qty_value = 100)

////////////
// Inputs //

atr_length = input(14,    title = "ATR Length")
atr_mult   = input(2,     title = "ATR Mult",    type = input.float)

tf2 = input('120', title = "TF2", type = input.string)
tf3 = input('180', title = "TF3", type = input.string)
tf4 = input('240', title = "TF4", type = input.string)

// BACKTESTING RANGE
// From Date Inputs
fromDay   = input(defval = 1,    title = "From Day",   minval = 1, maxval = 31)
fromMonth = input(defval = 1,    title = "From Month", minval = 1, maxval = 12)
fromYear  = input(defval = 2016, title = "From Year",  minval = 1970)

// To Date Inputs
toDay   = input(defval = 1,    title = "To Day",   minval = 1, maxval = 31)
toMonth = input(defval = 1,    title = "To Month", minval = 1, maxval = 12)
toYear  = input(defval = 2100, title = "To Year",  minval = 1970)

// Calculate start/end date and time condition
startDate  = timestamp(fromYear, fromMonth, fromDay, 00, 00)
finishDate = timestamp(toYear,   toMonth,   toDay,   00, 00)

time_cond = time >= startDate and time <= finishDate

//////////////////
// CALCULATIONS //


tsl() =>
    // SL values
    sl_val = atr_mult * atr(atr_length)

    // Init Variables
    pos         = 0
    trailing_sl = 0.0

    // Signals
    long_signal  = nz(pos[1]) !=  1 and high > nz(trailing_sl[1])
    short_signal = nz(pos[1]) != -1 and low  < nz(trailing_sl[1])

    // Calculate SL
    trailing_sl := short_signal     ? high + sl_val :
                   long_signal      ? low  - sl_val :
                   nz(pos[1]) ==  1 ? max(low  - sl_val, nz(trailing_sl[1])) :
                   nz(pos[1]) == -1 ? min(high + sl_val, nz(trailing_sl[1])) :
                   nz(trailing_sl[1])

    // Position var
    pos := long_signal  ? 1 : short_signal ? -1 : nz(pos[1])
    trailing_sl


trailing_sl1 = tsl()
trailing_sl2 = security(syminfo.tickerid, tf2, tsl())
trailing_sl3 = security(syminfo.tickerid, tf3, tsl())
trailing_sl4 = security(syminfo.tickerid, tf4, tsl())

pos1 = 0
pos1 := low <= trailing_sl1 ? -1 : high >= trailing_sl1 ? 1 : nz(pos1[1])

pos2 = 0
pos2 := low <= trailing_sl2 ? -1 : high >= trailing_sl2 ? 1 : nz(pos2[1])

pos3 = 0
pos3 := low <= trailing_sl3 ? -1 : high >= trailing_sl3 ? 1 : nz(pos3[1])

pos4 = 0
pos4 := low <= trailing_sl4 ? -1 : high >= trailing_sl4 ? 1 : nz(pos4[1])

total_pos = pos1 + pos2 + pos3 + pos4

//////////////
// PLOTINGS //

plot(trailing_sl1, linewidth = 2 , color = pos1 == 1 ? color.green : color.red, title = "TSL TF1")
plot(trailing_sl2, linewidth = 2 , color = pos2 == 1 ? color.green : color.red, title = "TSL TF2", transp = 25)
plot(trailing_sl3, linewidth = 2 , color = pos3 == 1 ? color.green : color.red, title = "TSL TF3", transp = 50)
plot(trailing_sl4, linewidth = 2 , color = pos4 == 1 ? color.green : color.red, title = "TSL TF4", transp = 75)

//////////////
// STRATEGY //

//strategy.entry("long",  true,  stop = trailing_sl1)
//strategy.entry("short", false, stop = trailing_sl1)

strategy.entry("long",    true, when = total_pos ==  4)
strategy.entry("short",  false, when = total_pos == -4)

strategy.close("long",  when = total_pos <= 0)
strategy.close("short", when = total_pos >= 0)