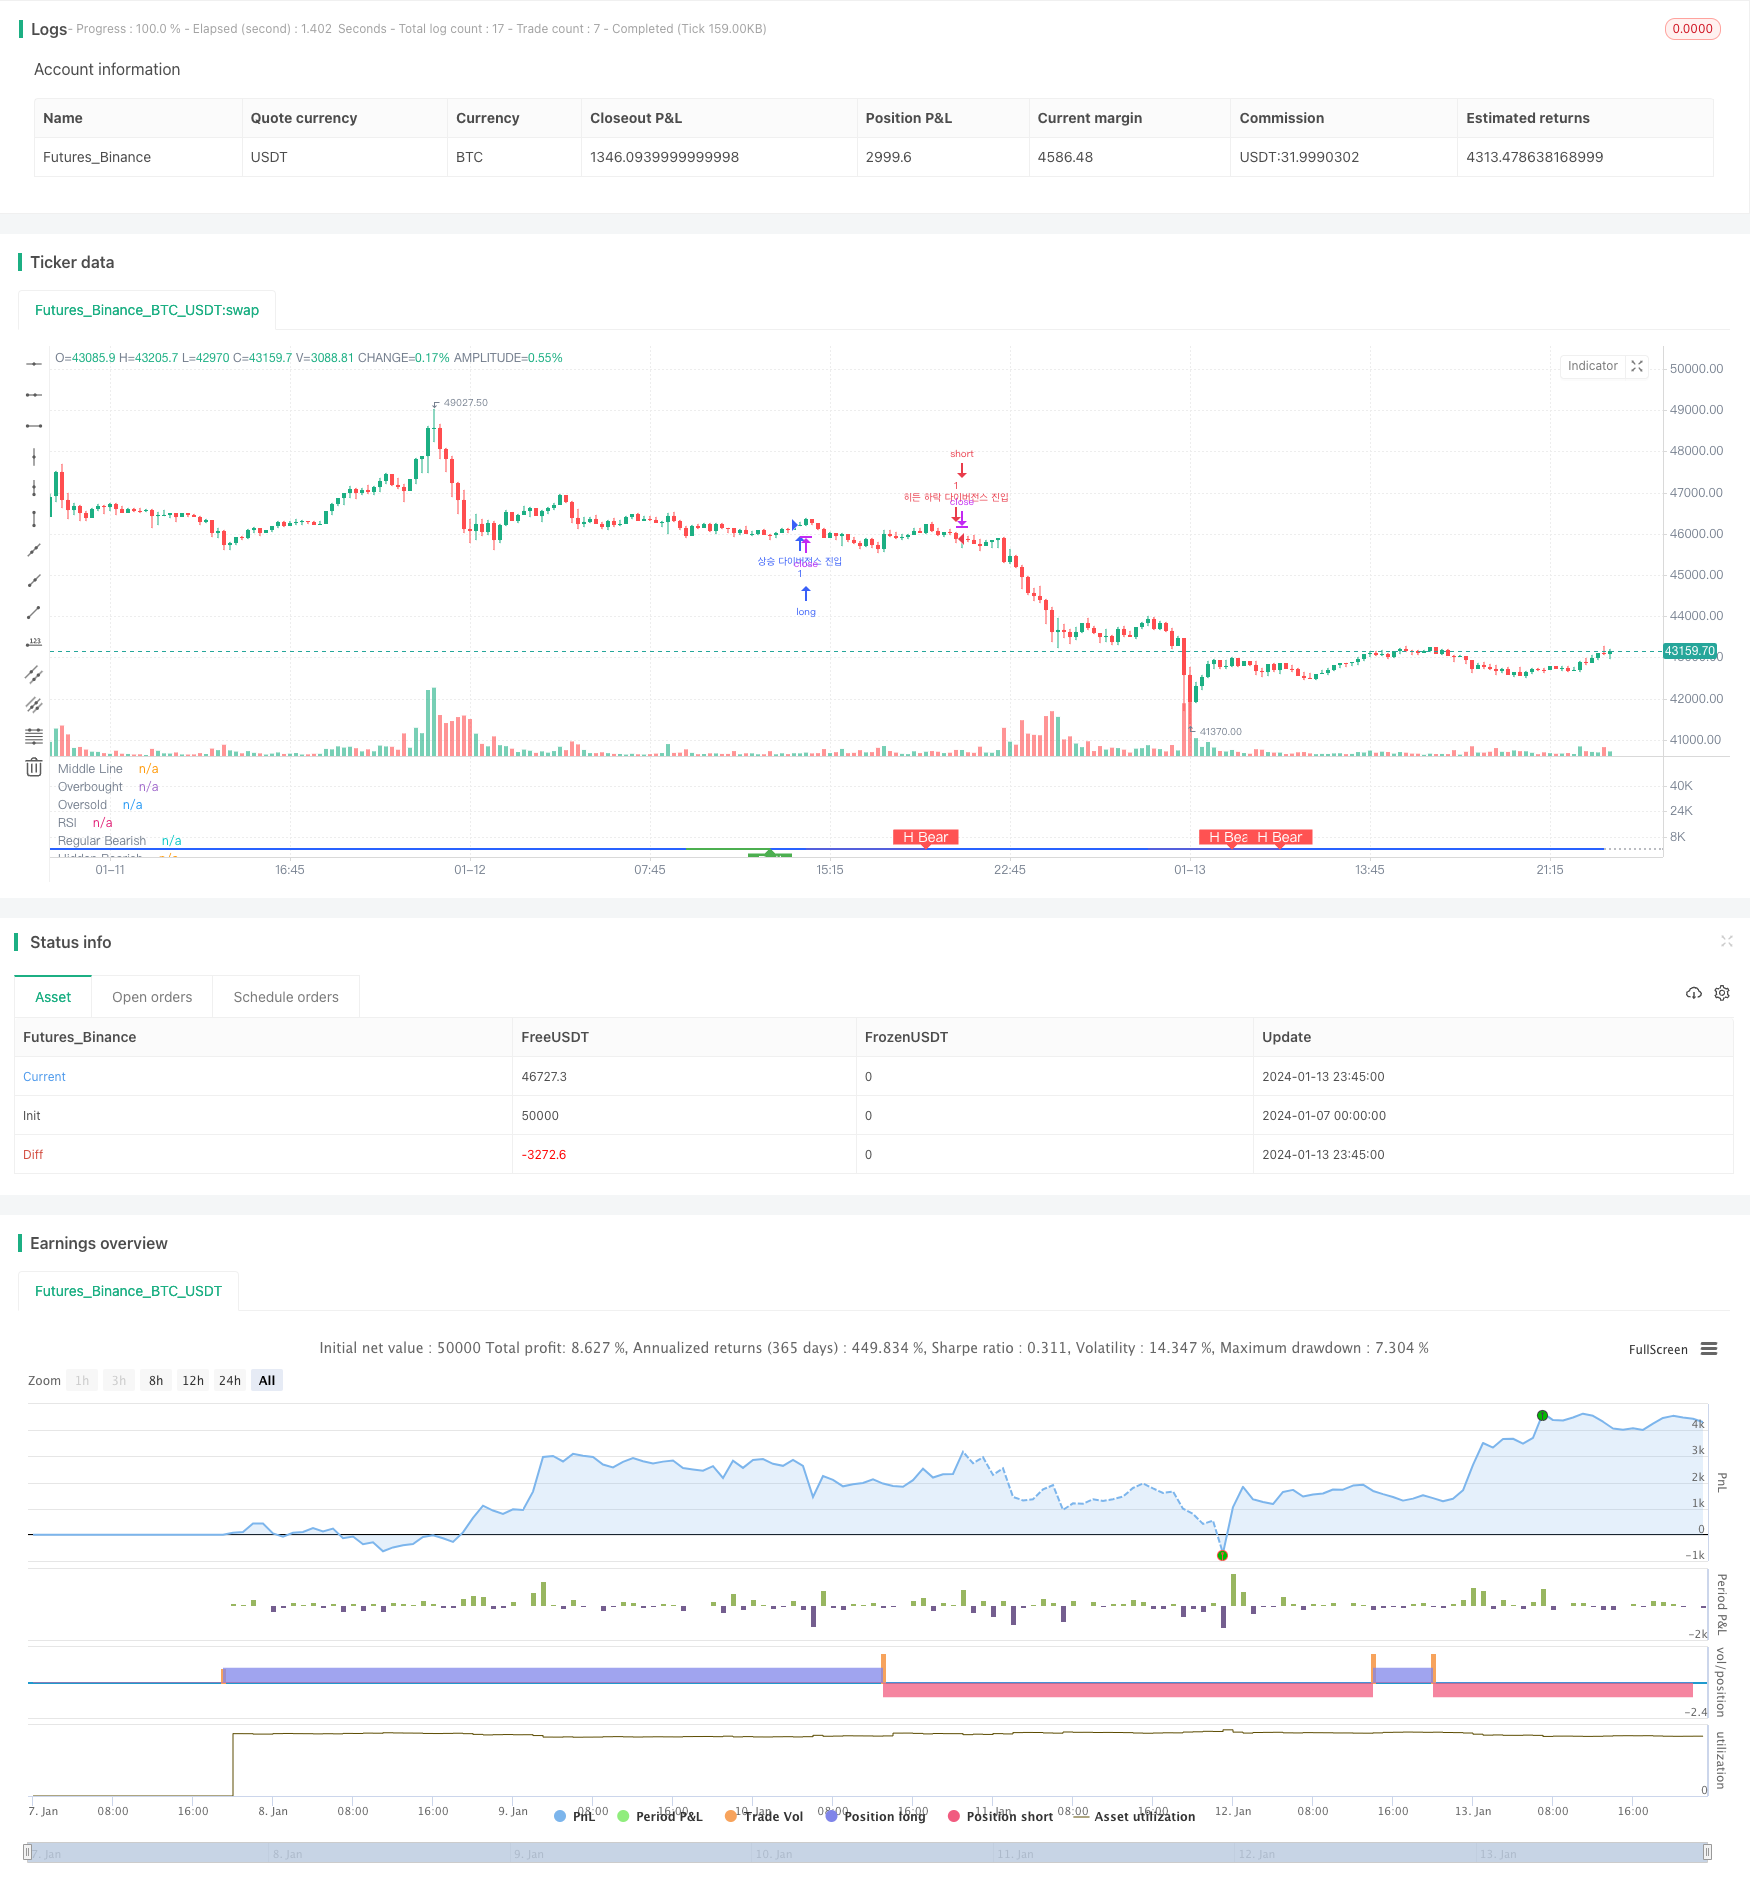
개요
이 전략은 RSI 지표의 상공적 차이를 계산하여 시장의 상공적 경향을 판단하고 거래 결정을 내립니다. 구체적으로, RSI가 낮은 낮은 지점을 형성하지만 가격이 더 높은 낮은 지점을 형성할 때 숨겨진 다중 신호로 판단합니다. RSI가 높은 지점을 형성하지만 가격이 낮은 높은 지점을 형성할 때 숨겨진 상공 신호로 판단합니다.
전략 원칙
이 전략은 주로 RSI 지표의 다중공간 격차 이론을 기반으로 한다. RSI와 가격이 반전된 격차를 형성할 때, 시장의 잠재적인 반전을 예고한다. 구체적으로 다음과 같은 네 가지 상황으로 나눌 수 있다:
정상적인 다면 신호: RSI가 더 높은 낮은 지점을 형성하고 가격이 더 낮은 낮은 지점을 형성한다. RSI가 상승했지만 가격이 완전히 반영되지 않았다는 것을 나타내는 바이어들은 다면 힘이 강화되었다는 것을 예고한다.
숨겨진 다면 신호: RSI가 더 낮은 낮은 지점을 형성하고, 가격이 더 높은 낮은 지점을 형성한다. 판매 상자는 RSI를 낮추었지만 가격에 완전히 반영되지 않았으며, 다면 힘이 강화되었다는 것을 예고한다.
정상 공백 신호: RSI가 더 낮은 고점을 형성하고 가격이 더 높은 고점을 형성한다. 판매가 가격을 높였음을 나타냅니다. 그러나 RSI에 완전히 반영되지 않았으며, 공백 힘이 강화되었다는 것을 예고한다.
숨겨진 공백 신호: RSI가 더 높은 고점을 형성하고, 가격이 더 낮은 고점을 형성한다. RSI가 상승했으나 가격에 완전히 반영되지 않았음을 나타냅니다.
상술된 불일치 상황에 따라 시장의 잠재적인 공백 추세와 구매와 판매의 힘이 증가하는 상황을 판단하여 거래 전략을 수립하십시오.
전략적 이점
- RSI의 다공간 격차 이론을 이용하여 시장의 잠재적인 경향을 판단한다.
- 가격 상황을 확인하는 것과 함께, 잡음 신호를 피하십시오.
- 시장이 급격히 변하기 전에 중요한 신호를 잡을 수 있고, 예측을 미리 판단할 수 있다.
- 가시화 된 다공간 신호提示을 구현하여 조작이 편리하고 직관적입니다.
- 사용자 정의 가능한 매개 변수, 다른 시장 환경에 적응
전략적 위험
- RSI 지표와 가격의 불일치가 반드시 반전을 예고하는 것은 아니며, 정상적인 평형상태일 수 있다.
- 숨겨진 신호는 상대적으로 큰 소음으로 인해 잘못된 판단이 발생할 수 있습니다.
- 신호를 확인하기 위해서는 더 많은 지표나 기술 분석 방법을 사용해야 합니다.
- 신호 변수 설정이 잘못되면 판단에 영향을 미칠 수 있다.
최적화 방향
- 추가 MACD, KDJ 등의 지표가 RSI 지표와 결합하여 entry signal 신호를 결정한다.
- 단독 손실을 줄이기 위해 손실을 막는 전략을 늘리십시오.
- 최적화 변수 설정, 예를 들어 더 적합한 RSI 주기 변수를 검색한다.
- 기계 학습 알고리즘을 추가하여 입력 신호의 정확성을 판단하도록 훈련합니다.
- 신호 확인 지연을 줄이기 위해 websocket 실시간 동작을 추가합니다.
요약하다
이 전략은 주로 RSI의 다공차로 시장의 잠재적인 다공차 경향을 판단하기 위해 의존합니다. 가격 운동에서 거래 대역의 상대적인 힘 변화를 포착하여 예측을하고 역전 거래합니다. 일부 선행 예측 기능이 있습니다. 그러나 일부 잡음 신호 위험도 있습니다.
/*backtest
start: 2024-01-07 00:00:00
end: 2024-01-14 00:00:00
period: 15m
basePeriod: 5m
exchanges: [{"eid":"Futures_Binance","currency":"BTC_USDT"}]
*/

//@version=5
strategy(title="Divergence Indicator")
len = input.int(title="RSI Period", minval=1, defval=20)
src = input(title="RSI Source", defval=close)
lbR = input(title="Pivot Lookback Right", defval=5)
lbL = input(title="Pivot Lookback Left", defval=5)
rangeUpper = input(title="Max of Lookback Range", defval=60)
rangeLower = input(title="Min of Lookback Range", defval=5)
plotBull = input(title="Plot Bullish", defval=true)
plotHiddenBull = input(title="Plot Hidden Bullish", defval=true)
plotBear = input(title="Plot Bearish", defval=true)
plotHiddenBear = input(title="Plot Hidden Bearish", defval=true)
bearColor = color.red
bullColor = color.green
hiddenBullColor = color.new(color.green, 80)
hiddenBearColor = color.new(color.red, 80)
textColor = color.white
noneColor = color.new(color.white, 100)
osc = ta.rsi(src, len)

plot(osc, title="RSI", linewidth=2, color=#2962FF)
hline(50, title="Middle Line", color=#787B86, linestyle=hline.style_dotted)
obLevel = hline(70, title="Overbought", color=#787B86, linestyle=hline.style_dotted)
osLevel = hline(30, title="Oversold", color=#787B86, linestyle=hline.style_dotted)
fill(obLevel, osLevel, title="Background", color=color.rgb(33, 150, 243, 90))

plFound = na(ta.pivotlow(osc, lbL, lbR)) ? false : true
phFound = na(ta.pivothigh(osc, lbL, lbR)) ? false : true
_inRange(cond) =>
	bars = ta.barssince(cond == true)
	rangeLower <= bars and bars <= rangeUpper

//------------------------------------------------------------------------------
// Regular Bullish
// Osc: Higher Low

oscHL = osc[lbR] > ta.valuewhen(plFound, osc[lbR], 1) and _inRange(plFound[1])

// Price: Lower Low

priceLL = low[lbR] < ta.valuewhen(plFound, low[lbR], 1)
// bull : 상승 Condition : 조건
bullCond = plotBull and priceLL and oscHL and plFound // 상승다이버전스?
strategy.entry("상승 다이버전스 진입", strategy.long, when = bullCond)
// strategy.close("상승 다이버전스 진입", when = ta.crossover(osc, 70))
plot(
     plFound ? osc[lbR] : na,
     offset=-lbR,
     title="Regular Bullish",
     linewidth=2,
     color=(bullCond ? bullColor : noneColor)
     )

plotshape(
	 bullCond ? osc[lbR] : na,
	 offset=-lbR,
	 title="Regular Bullish Label",
	 text=" Bull ",
	 style=shape.labelup,
	 location=location.absolute,
	 color=bullColor,
	 textcolor=textColor
	 )

//------------------------------------------------------------------------------
// Hidden Bullish
// Osc: Lower Low

oscLL = osc[lbR] < ta.valuewhen(plFound, osc[lbR], 1) and _inRange(plFound[1])

// Price: Higher Low

priceHL = low[lbR] > ta.valuewhen(plFound, low[lbR], 1)
hiddenBullCond = plotHiddenBull and priceHL and oscLL and plFound
strategy.entry("히든 상승 다이버전스 진입", strategy.long, when = hiddenBullCond)
// strategy.close("히든 상승 다이버전스 진입", when = ta.crossover(osc, 70))
plot(
	 plFound ? osc[lbR] : na,
	 offset=-lbR,
	 title="Hidden Bullish",
	 linewidth=2,
	 color=(hiddenBullCond ? hiddenBullColor : noneColor)
	 )

plotshape(
	 hiddenBullCond ? osc[lbR] : na,
	 offset=-lbR,
	 title="Hidden Bullish Label",
	 text=" H Bull ",
	 style=shape.labelup,
	 location=location.absolute,
	 color=bullColor,
	 textcolor=textColor
	 )

//------------------------------------------------------------------------------
// Regular Bearish
// Osc: Lower High

oscLH = osc[lbR] < ta.valuewhen(phFound, osc[lbR], 1) and _inRange(phFound[1])

// Price: Higher High

priceHH = high[lbR] > ta.valuewhen(phFound, high[lbR], 1)
// bear : 하락
bearCond = plotBear and priceHH and oscLH and phFound
strategy.entry("하락 다이버전스 진입", strategy.short, when = bearCond)
// strategy.close("하락 다이버전스 진입", when = ta.crossunder(osc, 50))
plot(
	 phFound ? osc[lbR] : na,
	 offset=-lbR,
	 title="Regular Bearish",
	 linewidth=2,
	 color=(bearCond ? bearColor : noneColor)
	 )

plotshape(
	 bearCond ? osc[lbR] : na,
	 offset=-lbR,
	 title="Regular Bearish Label",
	 text=" Bear ",
	 style=shape.labeldown,
	 location=location.absolute,
	 color=bearColor,
	 textcolor=textColor
	 )

//------------------------------------------------------------------------------
// Hidden Bearish
// Osc: Higher High

oscHH = osc[lbR] > ta.valuewhen(phFound, osc[lbR], 1) and _inRange(phFound[1])

// Price: Lower High

priceLH = high[lbR] < ta.valuewhen(phFound, high[lbR], 1)

hiddenBearCond = plotHiddenBear and priceLH and oscHH and phFound
strategy.entry("히든 하락 다이버전스 진입", strategy.short, when = hiddenBearCond)
// strategy.close("히든 하락 다이버전스 진입", when = ta.crossunder(osc, 50))
plot(
	 phFound ? osc[lbR] : na,
	 offset=-lbR,
	 title="Hidden Bearish",
	 linewidth=2,
	 color=(hiddenBearCond ? hiddenBearColor : noneColor)
	 )

plotshape(
	 hiddenBearCond ? osc[lbR] : na,
	 offset=-lbR,
	 title="Hidden Bearish Label",
	 text=" H Bear ",
	 style=shape.labeldown,
	 location=location.absolute,
	 color=bearColor,
	 textcolor=textColor
	 )