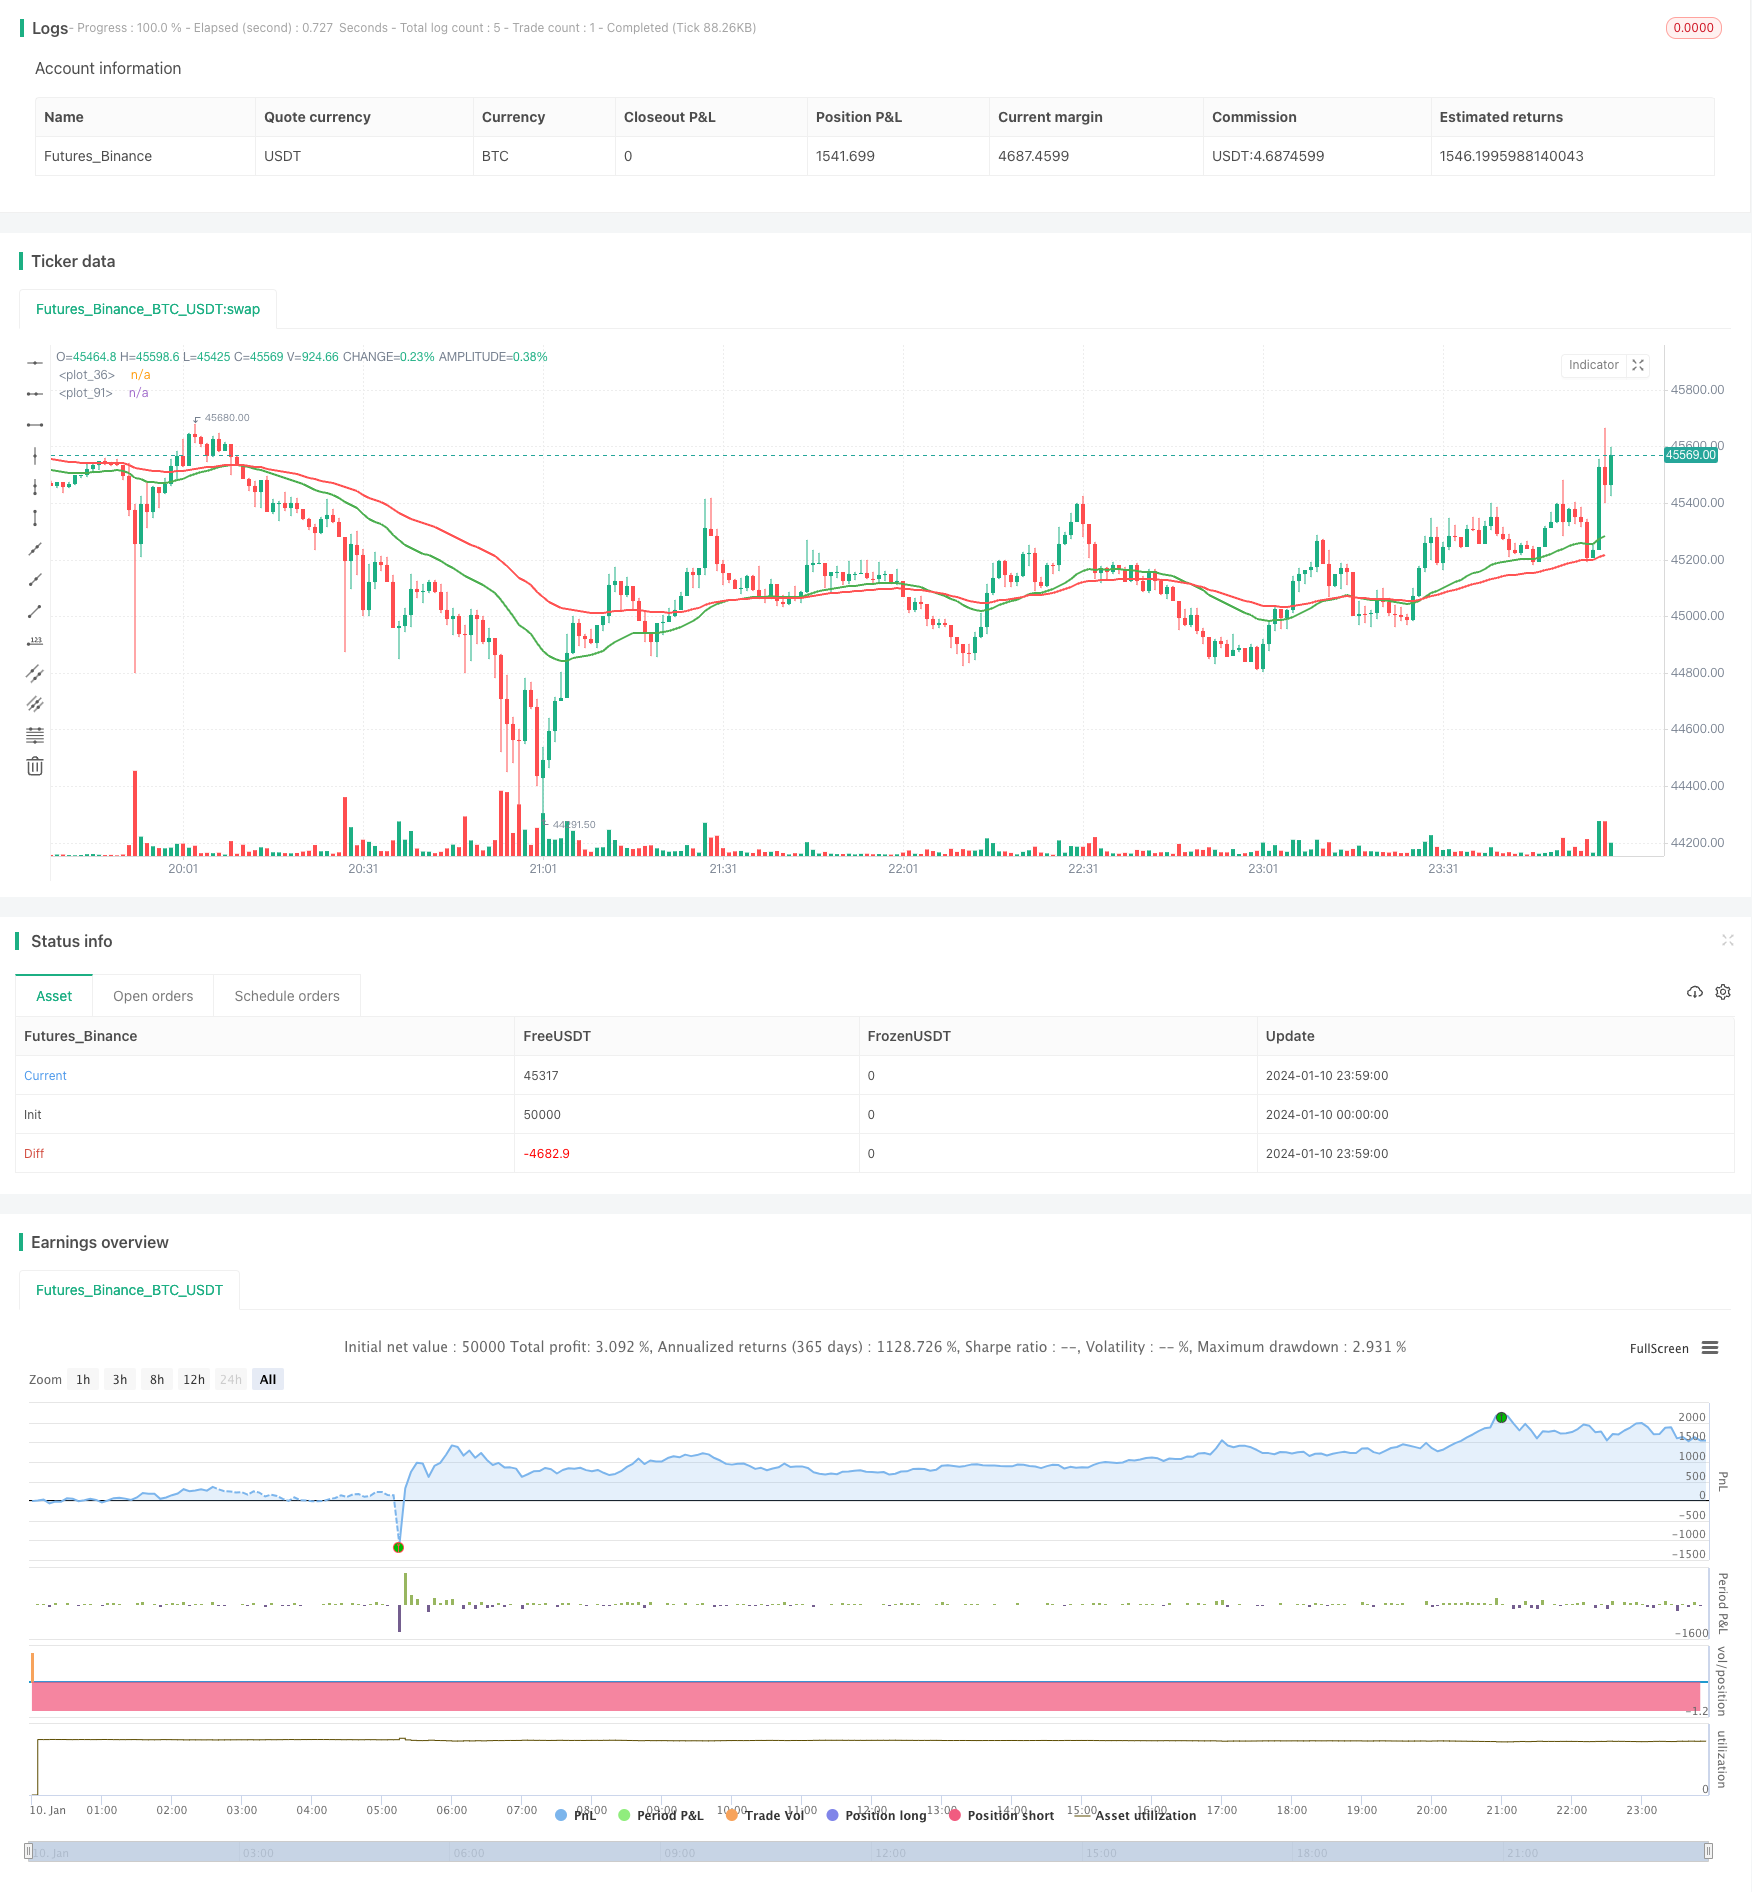
概述
双均线交叉策略是一种典型的趋势跟踪策略。它利用两条不同周期的EMA均线,当短周期均线上穿长周期均线时做多,当短周期均线下穿长周期均线时做空,以捕捉价格趋势的转折点。
策略原理
该策略的核心指标是两条EMA均线,分别为30周期和60周期。代码中通过自定义函数计算两条EMA均线:
emaLen1 = emaFuncOne(close, lenMA1)
emaLen2 = emaFuncTwo(close, lenMA2)
策略的交易信号来自两条EMA均线的交叉:
currentState = if emaLen2 > emaLen1
    0
else
    1

previousState = if emaLastLen2 > emaLastLen1
    0
else
    1

convergence = if currentState != previousState
    1
else
    0
当短期EMA上穿长期EMA时,currentState与previousState不相等,出现交叉信号。这时做多。 当短期EMA下穿长期EMA时,currentState与previousState不相等,出现交叉信号。这时做空。
优势分析
该策略具有以下优势:
- 策略思路简单直观,容易理解和实现
- 利用EMA均线的平滑特性,有效过滤市场噪音
- 自动跟踪趋势,不容易漏买漏卖
风险分析
该策略也存在一些风险:
- 双均线交叉信号可能滞后,无法及时捕捉转折
- 震荡行情中可能出现多次错误信号
- 参数设置不当可能导致过于敏感或过于滞后
可以通过调整EMA周期,或者增加过滤条件来优化。
优化方向
该策略可以从以下几个方面进行优化:
- 测试不同长度的EMA周期组合
- 增加成交量或波动率条件过滤假信号
- 结合其他指标确认趋势,例如MACD
- 优化资金管理,设置止损止盈
总结
双均线交叉策略整体来说是一种简单实用的趋势跟踪策略。它 straight-forward,易于实现,可以自动跟踪趋势。但也存在一些滞后,假信号的风险。通过参数优化和增加过滤条件,可以进一步完善,使其成为量化交易的基础策略之一。
策略源码
/*backtest
start: 2024-01-10 00:00:00
end: 2024-01-11 00:00:00
period: 1m
basePeriod: 1m
exchanges: [{"eid":"Futures_Binance","currency":"BTC_USDT"}]
*/

//@version=2
strategy("ParkerMAStrat", overlay=true)

lenMA1=input(title="Length 1", defval=30)
lenMA2=input(title="Length 2",  defval=60)

x = 0

checkLines(current, last) =>

    if current > last
        x = 1
    else
        x = 0
    x


//plot ema based on len1
emaFuncOne(src, time_period) =>

    alpha = 2 / (time_period + 1)
    // we have defined the alpha function above
    ema = 0.0
    // this is the initial declaration of ema, since we dont know the first ema we will declare it to 0.0 [as a decimal]
    ema := alpha * src + (1 - alpha) * nz(ema[1])
    // this returns the computed ema at the current time
    // notice the use of : (colon) symbol before =, it symbolises, that we are changing the value of ema,
    // since the ema was previously declared to 0
    // this is called mutable variale declaration in pine script
    ema
    // return ema from the function

emaLen1 = emaFuncOne(close, lenMA1)


plot(emaLen1, color=green, transp=0, linewidth=2)
// now we plot the _10_period_ema

//plot ema based on len2
emaFuncTwo(src, time_period) =>

    alpha = 2 / (time_period + 1)
    // we have defined the alpha function above
    ema = 0.0
    // this is the initial declaration of ema, since we dont know the first ema we will declare it to 0.0 [as a decimal]
    ema := alpha * src + (1 - alpha) * nz(ema[1])
    // this returns the computed ema at the current time
    // notice the use of : (colon) symbol before =, it symbolises, that we are changing the value of ema,
    // since the ema was previously declared to 0
    // this is called mutable variale declaration in pine script
    ema
    // return ema from the function

//plot ema based on len2
emaFuncOneLast(src, time_period) =>

    alpha = 2 / (time_period + 1)
    // we have defined the alpha function above
    ema = 0.0
    // this is the initial declaration of ema, since we dont know the first ema we will declare it to 0.0 [as a decimal]
    ema := alpha * src + (1 - alpha) * nz(ema[0])
    // this returns the computed ema at the current time
    // notice the use of : (colon) symbol before =, it symbolises, that we are changing the value of ema,
    // since the ema was previously declared to 0
    // this is called mutable variale declaration in pine script
    ema
    // return ema from the function

//plot ema based on len2
emaFuncTwoLast(src, time_period) =>

    alpha = 2 / (time_period + 1)
    // we have defined the alpha function above
    ema = 0.0
    // this is the initial declaration of ema, since we dont know the first ema we will declare it to 0.0 [as a decimal]
    ema := alpha * src + (1 - alpha) * nz(ema[0])
    // this returns the computed ema at the current time
    // notice the use of : (colon) symbol before =, it symbolises, that we are changing the value of ema,
    // since the ema was previously declared to 0
    // this is called mutable variale declaration in pine script
    ema
    // return ema from the function


emaLastLen1 = emaFuncOneLast(close, lenMA1)
emaLastLen2 = emaFuncTwoLast(close, lenMA2)
emaLen2 = emaFuncTwo(close, lenMA2)


plot(emaLen2, color=red, transp=30, linewidth=2)
// now we plot the _10_period_ema

//now we compare the two and when green crosses red we buy/sell (line1 vs line2)

previousState = if emaLastLen2 > emaLastLen1
    0
else
    1

currentState = if emaLen2 > emaLen1
    0
else
    1

convergence = if currentState != previousState
    1
else
    0


lineCheck = if convergence == 1
    checkLines(currentState, previousState)

if lineCheck == 1
    strategy.entry("Long", strategy.long)
else
    strategy.entry("Short", strategy.short)