SMA 크로스오버 이치모쿠 시장 깊이 부피 기반 양적 거래 전략
저자:차오장, 날짜: 2024-01-24 14:21:42태그:

전반적인 설명
이 전략은
원칙
이 전략은 주로 다음과 같은 원칙에 기초합니다.
-
다른 매개 변수와 함께 SMA 라인을 사용하여 골든 크로스 및 데드 크로스 거래 신호를 구성합니다. 단기 SMA가 장기 SMA를 넘을 때 구매 신호가 생성되며 단기 SMA가 장기 SMA를 넘을 때 판매 신호가 생성됩니다.
-
이치모쿠 클라우드 차트 지표를 사용하여 시장 깊이와 트렌드를 결정합니다. 매수 신호는 클라우드 차트의 주요 스펜 A와 주요 스펜 B보다 높은 닫기 가격에서 생성되며 판매 신호는 폐쇄 가격이 스펜 A와 스펜 B보다 낮을 때 생성됩니다. 이는 대부분의 잘못된 신호를 필터링합니다.
-
거래량 지표를 사용하여 낮은 거래량으로 인한 잘못된 신호를 필터링합니다. 거래량이 특정 기간 동안 평균 거래량보다 커지면 구매 및 판매 신호가 생성됩니다.
-
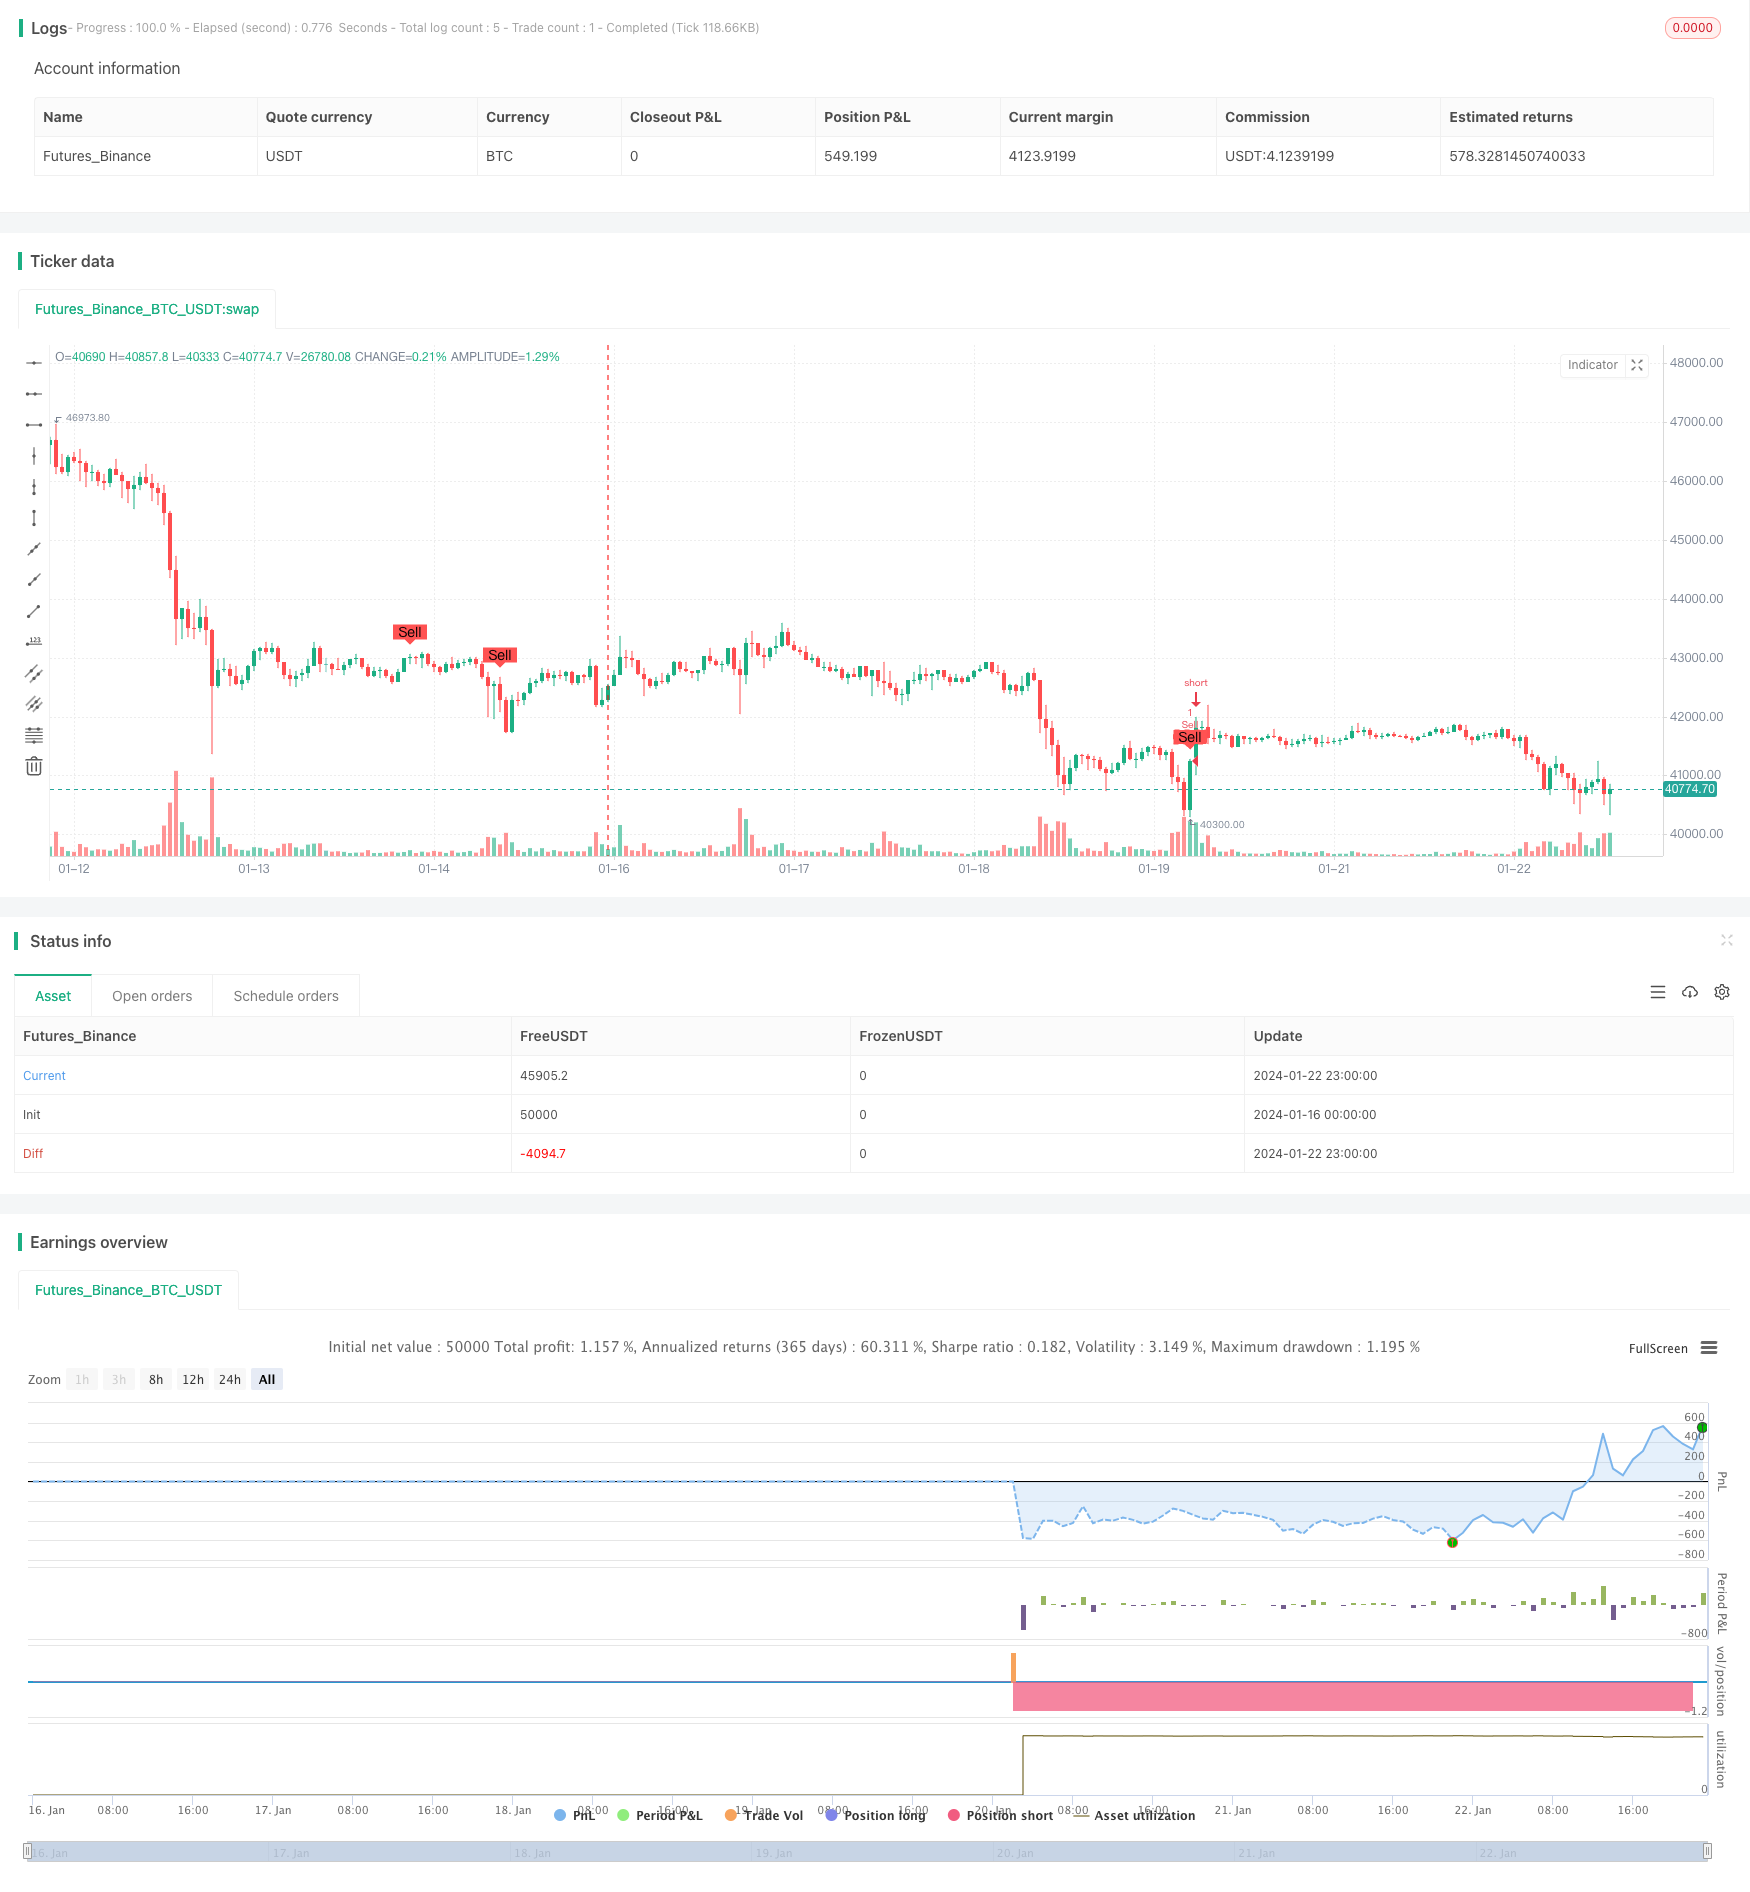
그래프에서 구매 및 판매 신호의 위치를 표시하기 위해 그래프 모양 함수를 사용하십시오.
이 방법으로 전략은 거래 결정을 최적화하기 위해 단기 및 장기적인 경향, 시장 깊이 지표 및 거래량 지표를 고려합니다.
이점 분석
이 전략의 장점은 다음과 같습니다.
- 기본 구매 및 판매 신호를 생성하기 위해 SMA 금색과 죽은 십자가를 사용하십시오. 너무 복잡하지 않도록하십시오.
- 이치모쿠 클라우드 차트를 사용하여 시장 깊이와 중장기 트렌드를 결정하여 소음을 효과적으로 필터 할 수 있습니다.
- 거래량 지표를 결합하여 낮은 거래량으로 거짓 브레이크를 피합니다.
- 다양한 시장에서 최적화를 위한 큰 매개 변수 조정 공간
- 명확한 논리와 이해하기 쉽고 수정하기 쉽습니다.
- 전략 테스트와 최적화를 용이하게 하기 위해 직관적으로 구매 및 판매 신호를 표시합니다.
위험 분석
이 전략의 위험은 또한 다음을 포함합니다.
- SMA 라인은 쉽게 잘못된 신호를 생성하고 필터를 필요로합니다.
- 이치모쿠 클라우드 차트의 시장 구조 판단 효과는 매개 변수 설정에 달려 있습니다.
- 거래량 확대 효과는 거래량 지표 판단에 영향을 줄 수 있습니다.
- 트렌딩과 오스실레이션 시장은 다른 매개 변수를 설정해야 합니다.
- 시간이 조금 늦어졌어요
이러한 위험은 SMA, Ichimoku, 볼륨과 같은 매개 변수를 최적화하고 적절한 거래 제품을 선택함으로써 감소 할 수 있습니다.
최적화 방향
전략은 여러 가지 방법으로 최적화 될 수 있습니다.
- EMA, VIDYA 등과 같은 더 많은 MA 지표를 테스트하십시오.
- 다른 이치모쿠 파라미터 설정을 시도해보세요.
- 추가적인 판단을 위해 추진력 지표를 사용하세요.
- 스톱 손실 메커니즘을 추가합니다.
- 다양한 시장과 제품에 대한 매개 변수를 최적화합니다.
- 매개 변수를 동적으로 최적화하기 위해 기계 학습을 사용하세요.
결론
이 전략은 비교적 안정적이고 신뢰할 수있는 양적 거래 전략을 형성하기 위해 SMA 크로스오버, 시장 깊이 지표 및 볼륨 지표를 통합합니다. 매개 변수 조정, 새로운 기술적 지표 추가 등을 통해 추가로 최적화 할 수 있습니다. 백테스트 및 라이브 결과는 유망합니다. 요약하면이 전략은 초보자에게 좋은 학습 사례를 제공합니다.
/*backtest
start: 2024-01-16 00:00:00
end: 2024-01-23 00:00:00
period: 1h
basePeriod: 15m
exchanges: [{"eid":"Futures_Binance","currency":"BTC_USDT"}]
*/

//@version=4
strategy("SMA Crossover with Ichimoku & Volume", shorttitle="SCIV", overlay=true)

// Define the length of SMA
shortSmaLength = input(14, title="Short SMA Length")
longSmaLength = input(21, title="Long SMA Length")
volumeLength = input(20, title="Volume Moving Average Length")

// Calculate the SMA and Volume MA
shortSma = sma(close, shortSmaLength)
longSma = sma(close, longSmaLength)
volumeMa = sma(volume, volumeLength)

// Define the lengths of the Ichimoku Cloud components
tenkanLength = input(9, title="Tenkan Length")
kijunLength = input(26, title="Kijun Length")
senkouBLength = input(52, title="Senkou B Length")
displacement = input(26, title="Displacement")

// Calculate the Ichimoku Cloud components
tenkan = (highest(high, tenkanLength) + lowest(low, tenkanLength)) / 2
kijun = (highest(high, kijunLength) + lowest(low, kijunLength)) / 2
senkouA = (tenkan + kijun) / 2
senkouB = (highest(high, senkouBLength) + lowest(low, senkouBLength)) / 2

// Define the conditions for entry and exit with Ichimoku filter and Volume filter
buyEntry = crossover(shortSma, longSma) and close > senkouA[displacement] and close > senkouB[displacement] and volume > volumeMa
sellEntry = crossunder(shortSma, longSma) and close < senkouA[displacement] and close < senkouB[displacement] and volume > volumeMa

// Plot buy/sell conditions on the chart for visual inspection
plotshape(buyEntry, style=shape.labelup, location=location.belowbar, color=color.green, text="Buy", size=size.small)
plotshape(sellEntry, style=shape.labeldown, location=location.abovebar, color=color.red, text="Sell", size=size.small)

// Execute the strategy
if (buyEntry)
    strategy.entry("Buy", strategy.long)
if (sellEntry)
    strategy.entry("Sell", strategy.short)
- 다중 지표 결합 정량 거래 전략
- 역동적인 돈치안 채널 터치 엔트리 전략 (Post-Stop Loss Pause and Trailing Stop Loss)
- 내일 단일 촛불 지표 조합 단기 거래 전략
- 이동 평균 크로스오버 거래 전략
- RSI 볼링거 밴드 거래 전략
- 이중 EMA를 기반으로 한 전략을 따르는 경향
- 이중 이동평균 파업 전략
- RSI와 이동 평균의 브레이크업 전략
- EMA 추적 전략
- 이동평균에 기초한 전략을 따르는 경향
- 트렌드 추적 중지 손실 취득 전략
- 양방향 교차 제로 축 Qstick 표시기 역 테스트 전략
- 이동 평균 크로스오버 거래 전략
- 이동평균 격차 전략
- 그림자 선에 기반한 역행 고주파 거래 전략
- 선형 회귀 RSI를 기반으로 한 양적 거래 전략
- 이 전략은 양방향 적응 범위 필터링 모멘텀 추적 전략입니다
- 이중 이동 평균 트렌드 추적 전략
- 힘의 돌파구 전략
- RSI CCI Williams%R 양적 거래 전략