전략에 따라 가격 이동 평균 트렌드를 넘기기
저자:차오장, 날짜: 2024-01-26 15:18:29태그:

전반적인 설명
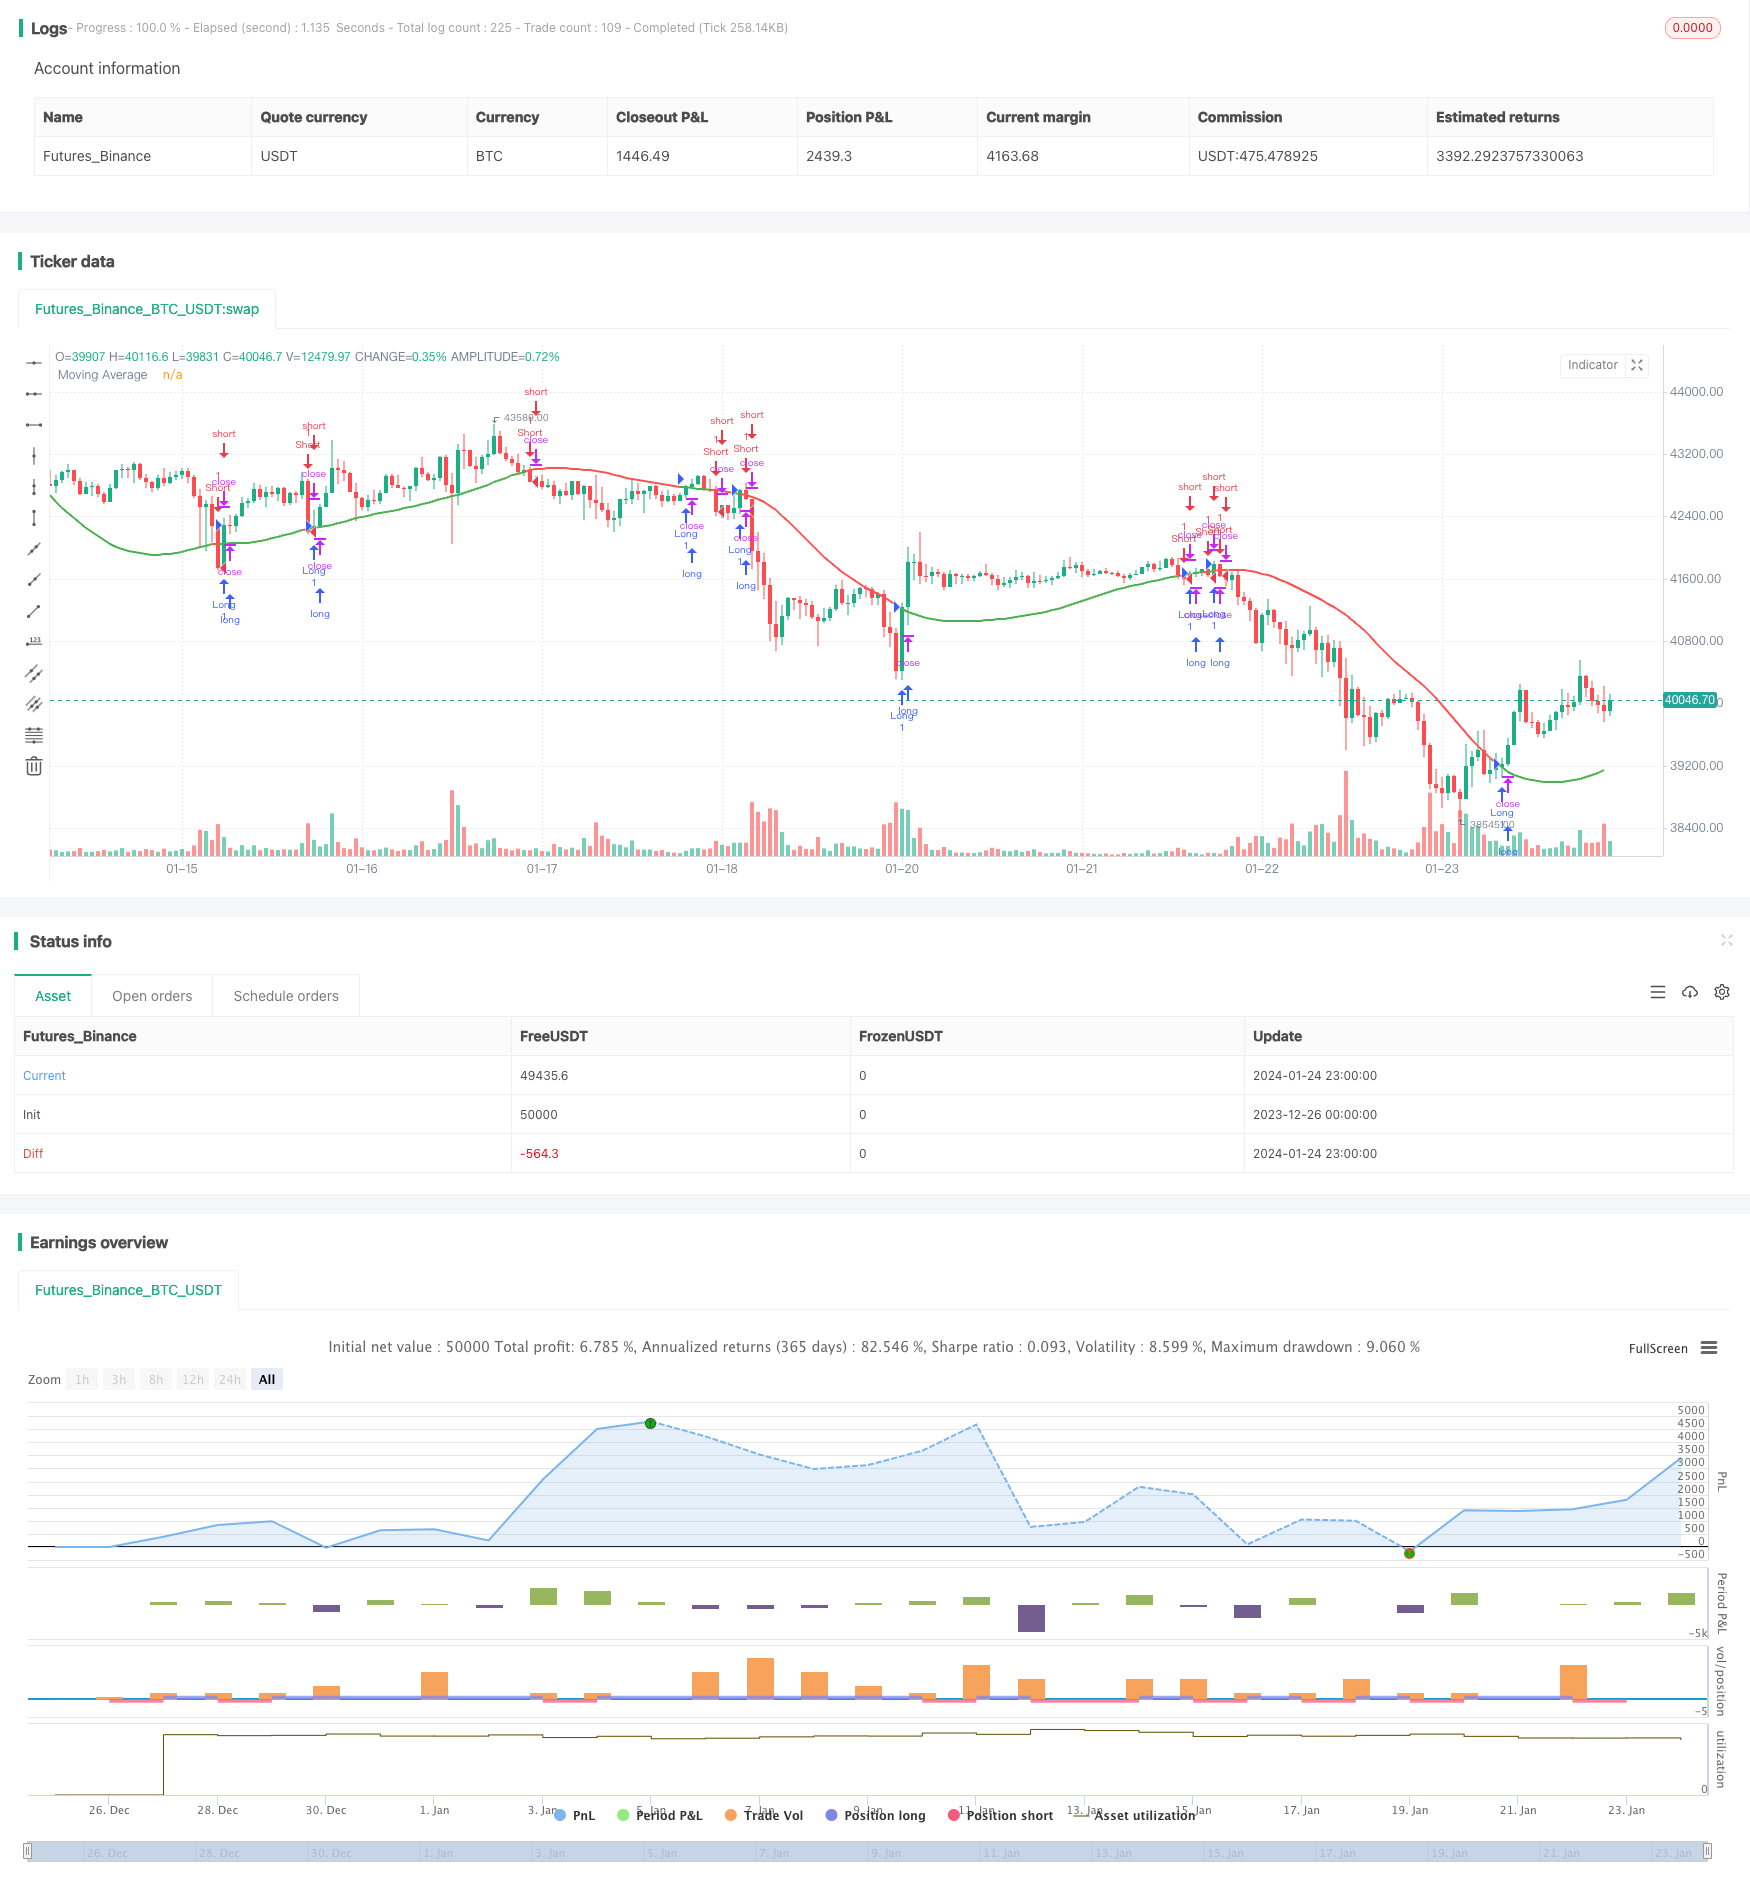
이 전략은 이동 평균과 가격의 교차를 기반으로 구매 및 판매 신호를 생성합니다. 그것은 다양한 유형의 이동 평균과 거짓 브레이크오웃을 필터하기 위한 관용 매개 변수를 제공합니다. 전략은 트렌드를 따르는 가격 트렌드의 전환점을 캡처하는 것을 목표로합니다.
전략 논리
이 전략은 폐쇄 가격에 기초하여 길이 N 이동 평균을 계산한다. 일반적인 이동 평균 유형에는 단순 이동 평균 (SMA), 기하급수적인 이동 평균 (EMA), 가중 이동 평균 (WMA) 등이 있다. 그 다음 허용 수준이 설정되며, 예를 들어 5%이며 상단 대역 (1.05배 이동 평균) 과 하단 대역 (0.95배 이동 평균) 이 계산된다. 폐쇄 가격이 상단 대역을 넘을 때 구매 신호가 생성된다. 폐쇄 가격이 하단 대역을 넘을 때 판매 신호가 생성된다. 이것은 일부 잘못된 브레이크를 필터링하는 데 도움이 된다. 또한,
장점
- 유동평균의 추세를 따라가는 특성을 사용하여 가격 추세를 효과적으로 추적합니다.
- 유연한 조합을 위한 다양한 이동 평균 유형을 제공합니다.
- 허용 매개 변수는 잘못된 브레이크를 필터링하고 불필요한 거래를 피하는 데 도움이됩니다.
- 하향 추세를 잡기 위해 적합한 단축 할 수 있습니다.
위험성
- 이동 평균은 뒤떨어진 효과를 가지고 있으며 가격 전환점을 놓칠 수 있습니다.
- 범위에 제한된 시장 환경에 적합하지 않습니다.
- 부적절한 허용 매개 변수 설정은 유효 신호를 필터링 할 수 있습니다.
- 단축은 더 큰 위험을 초래하고 신중한 거래가 필요합니다.
최적화 방향
- 이동 평균 유형 및 길이 매개 변수를 최적화
- 다른 허용값 설정을 테스트
- 필터 신호에 다른 표시기를 추가합니다.
- 위치 크기를 결정하는 전략을 사용
결론
전체적으로 이것은 트렌드를 따르는 전형적인 전략이다. 그것은 가격과 이동 평균 사이의 관계를 사용하여 어느 정도의 유연성을 가지고 트렌드를 결정한다. 매개 변수 최적화와 적절한 신호 필터링을 통해 괜찮은 양 전략이 될 수 있다. 그러나 단축할 때 하향 리스크를 제어하는 것은 과도한 손실을 피하기 위해 중요하다.
/*backtest
start: 2023-12-26 00:00:00
end: 2024-01-25 00:00:00
period: 1h
basePeriod: 15m
exchanges: [{"eid":"Futures_Binance","currency":"BTC_USDT"}]
*/

// This source code is subject to the terms of the Mozilla Public License 2.0 at https://mozilla.org/MPL/2.0/
// © RafaelPiccolo

//@version=4
strategy("Price X MA Cross", overlay=true)

typ = input("HMA", "MA Type", options=["SMA", "EMA", "WMA", "HMA", "VWMA", "RMA", "TEMA"])
len = input(100, minval=1, title="Length")
src = input(close, "Source", type=input.source)
tol = input(0, minval=0, title="Tolerance (%)", type=input.float)
shortOnly = input(false, "Short only")

tema(src, len)=>
    ema1 = ema(src, len)
    ema2 = ema(ema1, len)
    ema3 = ema(ema2, len)
    return = 3 * (ema1 - ema2) + ema3

getMAPoint(type, len, src)=>
    return = type == "SMA" ? sma(src, len) : type == "EMA" ? ema(src, len) : type == "WMA" ? wma(src, len) : type == "HMA" ? hma(src, len) : type == "VWMA" ? vwma(src, len) : type == "RMA" ? rma(src, len) : tema(src, len)

ma = getMAPoint(typ, len, src)
upperTol = ma * (1 + tol/100)
lowerTol = ma * (1 - tol/100)

longCondition = crossover(close, upperTol)
shortCondition = crossunder(close, lowerTol)

if (shortCondition)
    strategy.entry("Short", strategy.short)

if (longCondition)
    if (shortOnly)
        strategy.close("Short")
    else
        strategy.entry("Long", strategy.long)

plot(ma, "Moving Average", close > ma ? color.green : color.red, linewidth = 2)
t1 = plot(tol > 0 ? upperTol : na, transp = 70)
t2 = plot(tol > 0 ? lowerTol : na, transp = 70)
fill(t1, t2, color = tol > 0 ? color.blue : na)
더 많은
- 핵심 역전 역 테스트 전략
- 반전 촛불 역 테스트 전략
- Ehlers-Smoothed 스토카스틱 RSI 전략
- Swing High Low Price 채널 전략 V.1
- 동력 역전 거래 전략
- 적응형 선형 회귀 채널 전략
- 이동 평균 차이 제로 크로스 전략
- 여러 지표가 전략을 따르고
- 전략에 따른 탄탄한 추세
- 이중 EMA 골든 크로스 브레이크업 전략
- 단계적 BB KC 트렌드 전략
- 트리플 SMA 자동 추적 전략
- 비트코인 선물 포지션 거래 전략
- 기계 학습에 기반한 스토카스틱 최적화와 함께 가격 EMA
- 동적 볼링거 브레이크업 전략
- 2년 새로운 고 리트레이션 이동 평균 전략
- 이중 이동 평균 거래 전략
- 동적 위치 재균형 트렌드 추적 시스템
- 매일 오픈 역전 전략