개요
삼중평균선 파장 전략은 여러 이동 평균 지표를 사용하여 K선에 대한 심층 분석을 통해 가격 변동에 숨겨진 법칙을 파헤쳐 저위험의 중매 거래를 실현합니다.
전략 원칙
이 전략은 부린 라인을 기반으로 여러 개의 EMA 지표를 중첩하여 가격 채널을 구성하고 가격 변동 법칙을 발견합니다. 구체적으로:
- BodyResistanceChannel 지표를 사용하여 K선 엔티티 저항 지점을 매핑한다.
- 지원/저항 지표를 사용하여 다일 지원 및 저항 지점을 도표화하십시오.
- 이중 EMA 시스템을 사용하여 가격 경향 방향을 판단한다.
- 헐 평균선 지표로 가격 곡선을 평평하게 한다.
이 기반을 통해 형태를 파악하고, 역전 기회를 판단하고, 중도 거래 전략을 수립한다.
우위 분석
이 전략은 다음과 같은 장점을 가지고 있습니다.
- 다중 EMA를 사용하여 가격 통로를 구성하여 가격 변동 방향을 명확하게 판단 할 수 있습니다.
- 헐 평균선 지표를 적용하면 평평한 가격 돌파구를 효과적으로 판단할 수 있다.
- 반전 형태와 통로 지표와 결합하여 높은 확률과 낮은 위험 거래를 실현한다.
- 다층 지표 시스템을 구축하여 거래 신호가 안정적이고 신뢰할 수 있습니다.
위험 분석
이 전략에는 다음과 같은 위험도 있습니다.
- 가격 채널의 파열은 엄청난 손실을 초래할 위험이 있다. 타겟팅 된 해결책은 이동적 손실을 적용하여 단독 손실을 줄이는 것이다.
- 역형태 판단 오류가 잘못된 신호를 유발할 위험이 있다. 타겟팅 솔루션은 매개 변수를 최적화하여 형태 판단 정확도를 높이는 것이다.
- 지표 변수 불일치로 인해 거래 신호 품질이 떨어질 위험이 있다. 타겟팅 솔루션은 다중 조합 변수 최적화 테스트이다.
최적화 방향
이 전략은 다음과 같은 방향으로 최적화될 수 있습니다.
- EMA 주기의 변수 조합을 최적화하여 지표가 시장 특성에 더 잘 맞도록 한다.
- 단편적 손실 위험을 최소화하기 위해 단편적 손실을 최소화하기 위해 단편적 손실 위치를 조정합니다.
- 변동성에 기반한 동적 포지션 조정 모듈을 추가하여 위험을 효과적으로 제어한다.
- 더 많은 가격 법칙을 파헤치기 위해 딥러닝 기술을 사용하여 신호 품질을 향상시킵니다.
요약하다
삼중평평선파구 전략은 가격 변동 법칙을 깊이 파고들며, 안정적이고 효율적이며, 장기간 적용 및 지속적인 최적화를 할 가치가 있다. 투자에는 합리성과 인내심이 필요하며, 점진적으로 수행하는 것이 승리하는 길이다.
전략 소스 코드
/*backtest
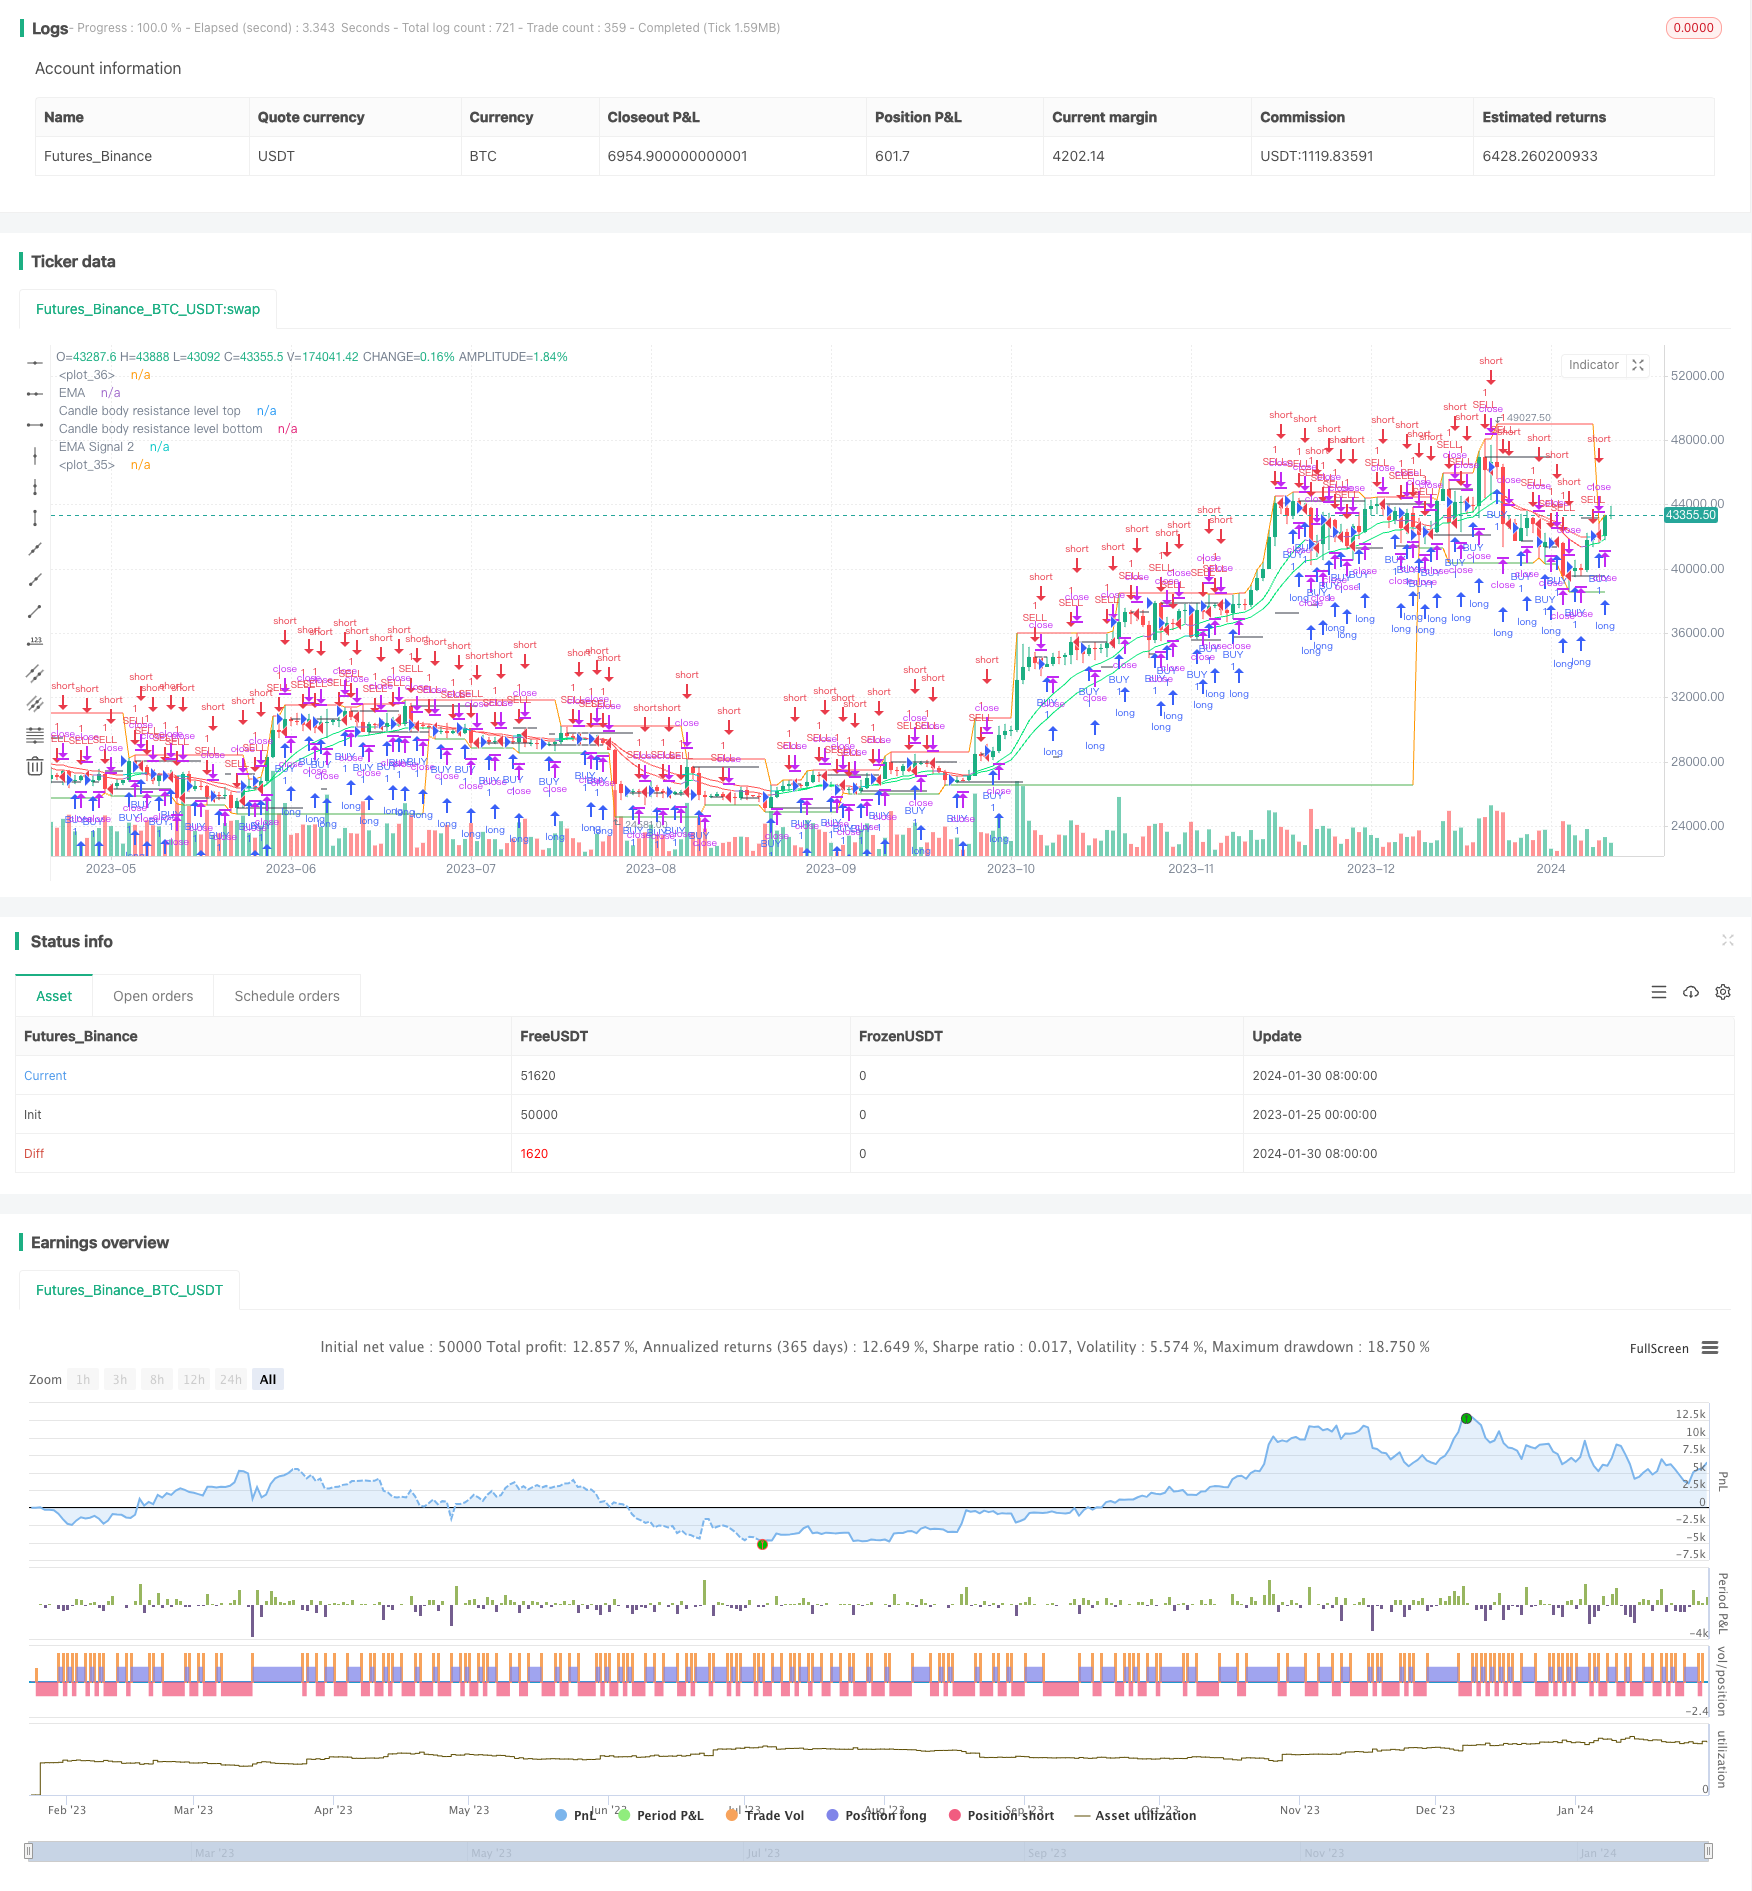
start: 2023-01-25 00:00:00
end: 2024-01-31 00:00:00
period: 1d
basePeriod: 1h
exchanges: [{"eid":"Futures_Binance","currency":"BTC_USDT"}]
*/
//@version=3
//╭╮╱╱╭╮╭╮╱╱╭╮
//┃╰╮╭╯┃┃┃╱╱┃┃
//╰╮┃┃╭┻╯┣╮╭┫╰━┳╮╭┳━━╮
//╱┃╰╯┃╭╮┃┃┃┃╭╮┃┃┃┃━━┫
//╱╰╮╭┫╰╯┃╰╯┃╰╯┃╰╯┣━━┃
//╱╱╰╯╰━━┻━━┻━━┻━━┻━━╯
//╭━━━┳╮╱╱╱╱╱╱╱╭╮
//┃╭━╮┃┃╱╱╱╱╱╱╱┃┃
//┃┃╱╰┫╰━┳━━┳━╮╭━╮╭━━┫┃
//┃┃╱╭┫╭╮┃╭╮┃╭╮┫╭╮┫┃━┫┃
//┃╰━╯┃┃┃┃╭╮┃┃┃┃┃┃┃┃━┫╰╮
//╰━━━┻╯╰┻╯╰┻╯╰┻╯╰┻━━┻━╯
//━╯
// http://www.vdubus.co.uk/
strategy(title='Vdub FX SniperVX3 / Strategy v3', shorttitle='Vdub_FX_SniperVX3_Strategy', overlay=true, pyramiding=0, initial_capital=1000, currency=currency.USD)
//Candle body resistance Channel-----------------------------//
len = 34
src = input(close, title="Candle body resistance Channel")
out = sma(src, len)
last8h = highest(close, 13)
lastl8 = lowest(close, 13)
bearish = cross(close,out) == 1 and falling(close, 1)
bullish = cross(close,out) == 1 and rising(close, 1)
channel2=input(false, title="Bar Channel On/Off")
ul2=plot(channel2?last8h:last8h==nz(last8h[1])?last8h:na, color=black, linewidth=1, style=linebr, title="Candle body resistance level top", offset=0)
ll2=plot(channel2?lastl8:lastl8==nz(lastl8[1])?lastl8:na, color=black, linewidth=1, style=linebr, title="Candle body resistance level bottom", offset=0)
//fill(ul2, ll2, color=black, transp=95, title="Candle body resistance Channel")
//-----------------Support and Resistance
RST = input(title='Support / Resistance length:', defval=10)
RSTT = valuewhen(high >= highest(high, RST), high, 0)
RSTB = valuewhen(low <= lowest(low, RST), low, 0)
RT2 = plot(RSTT, color=RSTT != RSTT[1] ? na : red, linewidth=1, offset=+0)
RB2 = plot(RSTB, color=RSTB != RSTB[1] ? na : green, linewidth=1, offset=0)
//--------------------Trend colour ema------------------------------------------------//
src0 = close, len0 = input(13, minval=1, title="EMA 1")
ema0 = ema(src0, len0)
direction = rising(ema0, 2) ? +1 : falling(ema0, 2) ? -1 : 0
plot_color = direction > 0 ? lime: direction < 0 ? red : na
plot(ema0, title="EMA", style=line, linewidth=1, color = plot_color)
//-------------------- ema 2------------------------------------------------//
src02 = close, len02 = input(21, minval=1, title="EMA 2")
ema02 = ema(src02, len02)
direction2 = rising(ema02, 2) ? +1 : falling(ema02, 2) ? -1 : 0
plot_color2 = direction2 > 0 ? lime: direction2 < 0 ? red : na
plot(ema02, title="EMA Signal 2", style=line, linewidth=1, color = plot_color2)
//=============Hull MA//
show_hma = input(false, title="Display Hull MA Set:")
hma_src = input(close, title="Hull MA's Source:")
hma_base_length = input(8, minval=1, title="Hull MA's Base Length:")
hma_length_scalar = input(5, minval=0, title="Hull MA's Length Scalar:")
hullma(src, length)=>wma(2*wma(src, length/2)-wma(src, length), round(sqrt(length)))
plot(not show_hma ? na : hullma(hma_src, hma_base_length+hma_length_scalar*6), color=black, linewidth=2, title="Hull MA")
//============ signal Generator ==================================//
Piriod=input('720')
ch1 = request.security(syminfo.tickerid, Piriod, open)
ch2 = request.security(syminfo.tickerid, Piriod, close)
longCondition = crossover(request.security(syminfo.tickerid, Piriod, close),request.security(syminfo.tickerid, Piriod, open))
if (longCondition)
strategy.entry("BUY", strategy.long)
shortCondition = crossunder(request.security(syminfo.tickerid, Piriod, close),request.security(syminfo.tickerid, Piriod, open))
if (shortCondition)
strategy.entry("SELL", strategy.short)
///////////////////////////////////////////////////////////////////////////////////////////