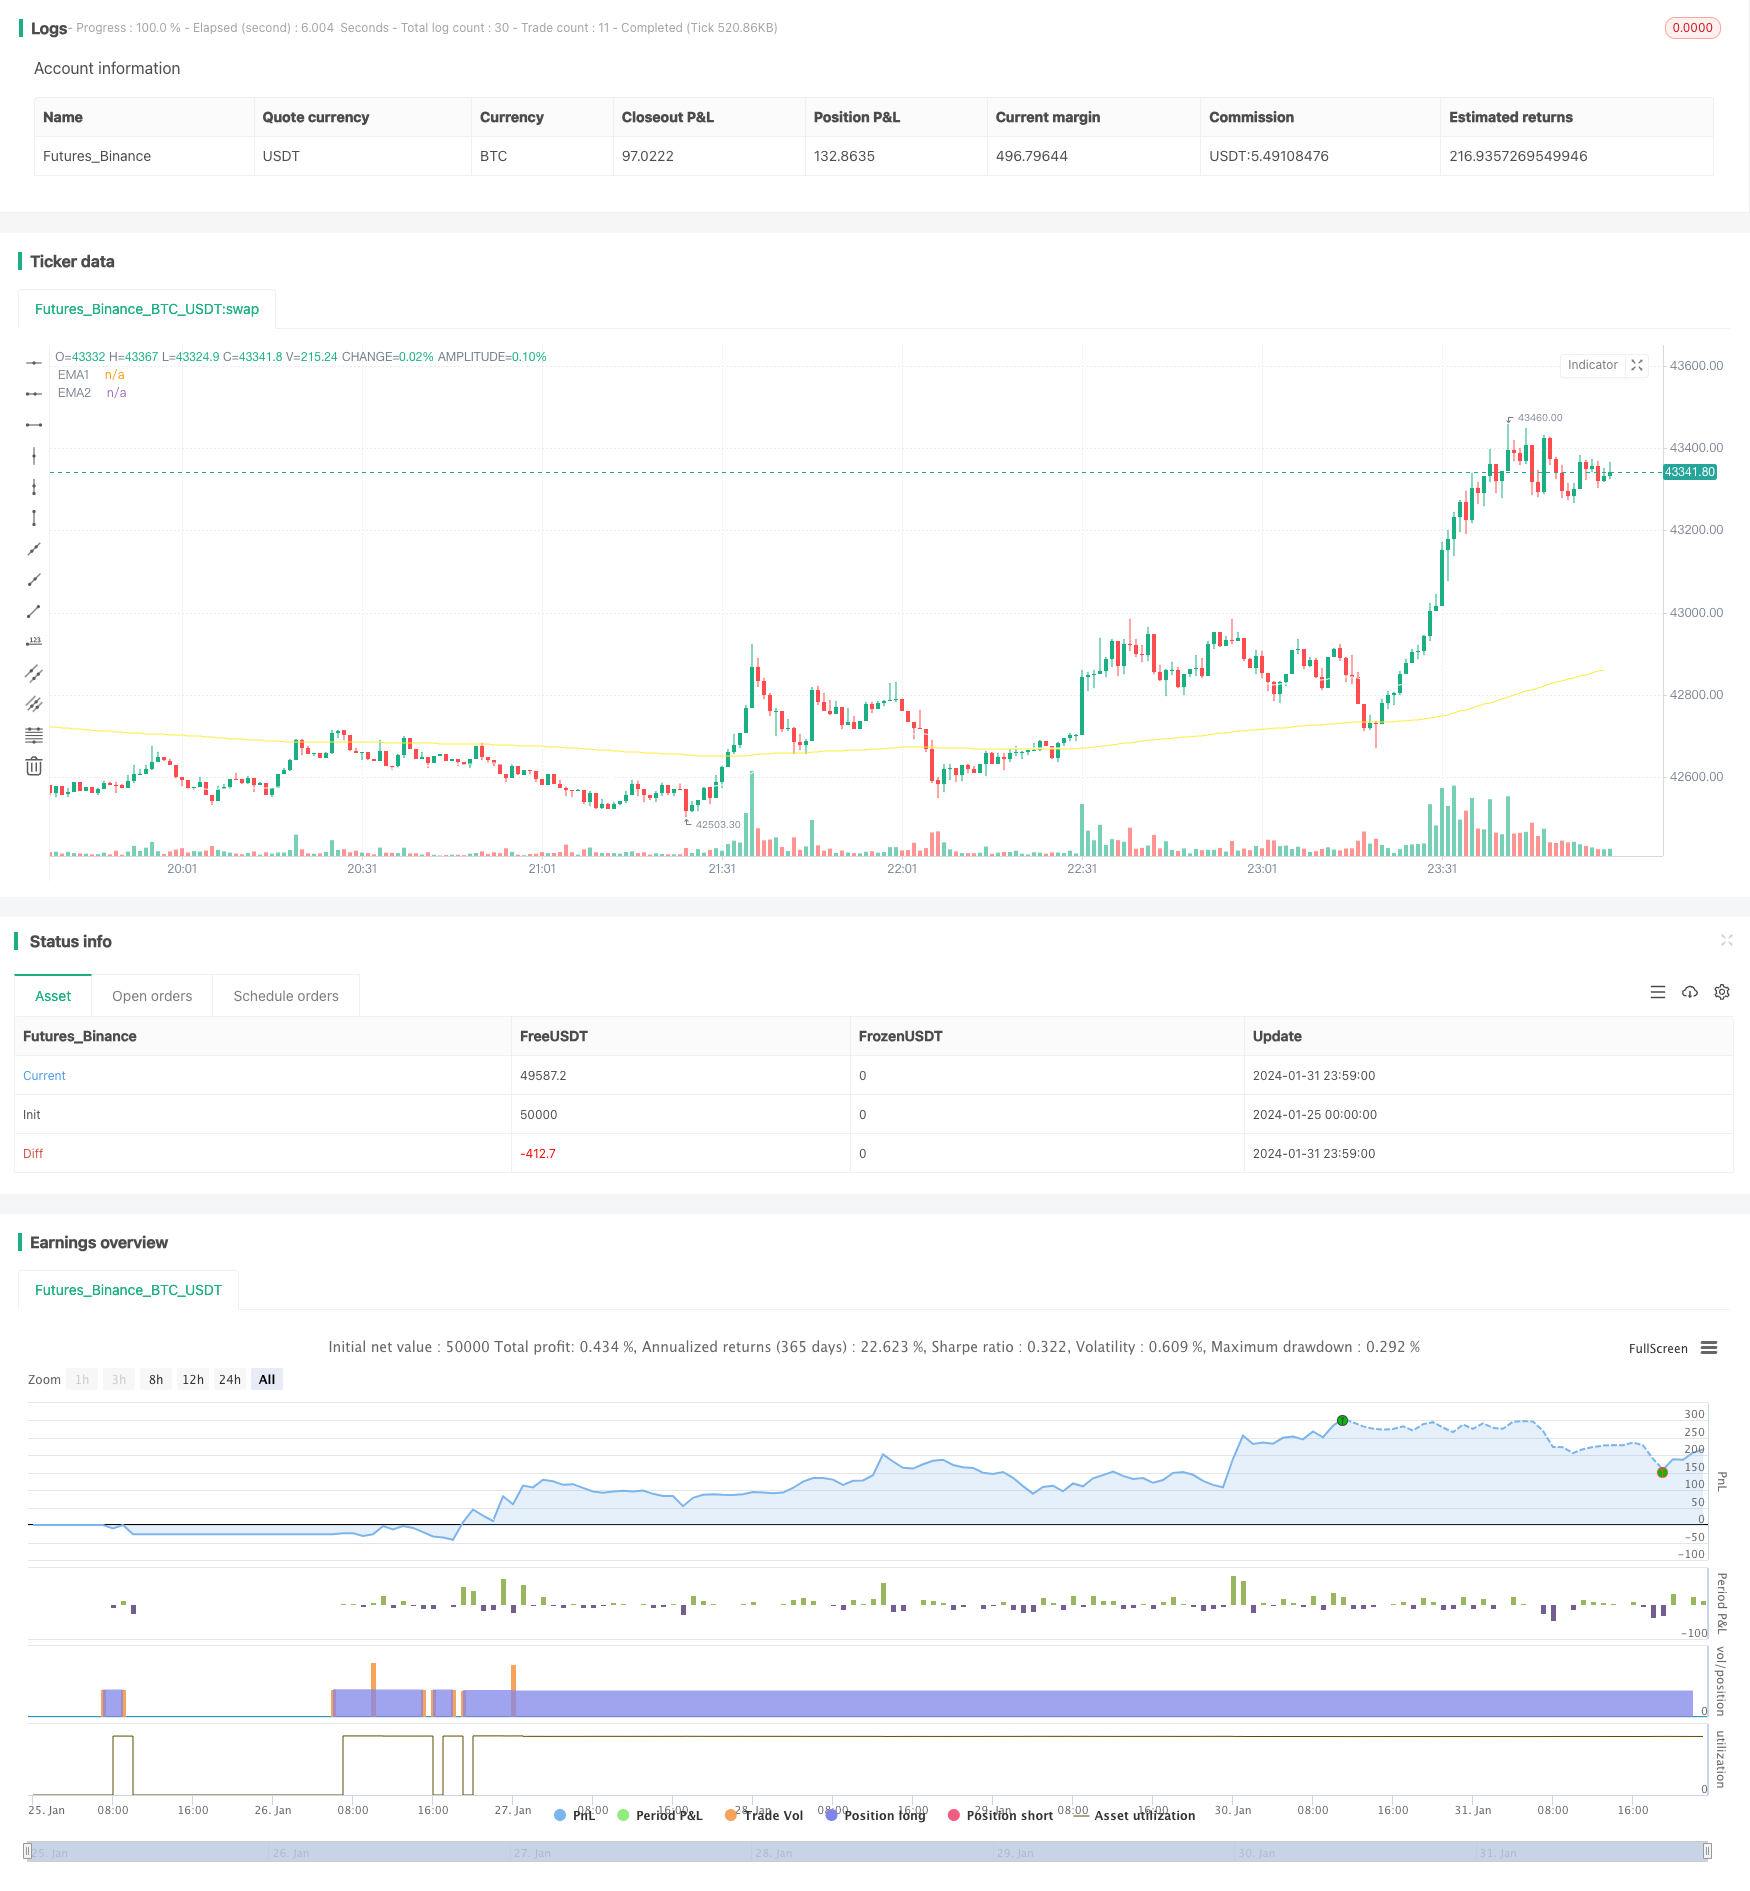
전략에 따른 EMA RSI 숨겨진 격차 추세
저자:차오장, 날짜: 2024-02-02 16:54:27태그:

전반적인 설명
이 전략은 상승 추세의 시작을 식별하기 위해 EMA 크로스오버 및 RSI 숨겨진 상승성 분산 신호에 기반하여 긴 포지션을 개척합니다. EMA 라인, RSI 지표 및 K 라인 폐쇄 가격의 조합은 상승 동력을 보장하기 위해 이중 확인을 제공합니다. 이 전략은 중장기 트렌드를 따르고 가격 통합 후 긴 포지션을 개척하는 데 적합합니다.
전략 논리
-
EMA 전략: 트렌드 방향을 결정하기 위해 50주기 EMA와 250주기 EMA의 황금 십자가를 사용한다. 50주기 EMA 이상의 폐쇄는 긴 신호를 준다.
-
RSI 숨겨진 분산 전략: RSI는 낮은 최저치를 형성하고 가격은 높은 최저치를 형성하며 초기에는 트렌드 반전을 신호합니다. 피보트 포인트 수를 제한하면 잘못된 신호를 필터합니다.
-
K 라인 클로징 전략: 클로징 가격이 50 EMA 라인을 넘을 때 긴 라인을 선택합니다.
위의 세 가지 전략의 조합은 상승 추세의 시작을 확인하고 그에 따라 긴 포지션을 개설합니다.
이점 분석
-
트렌드 방향을 결정하는 EMA 라인을 RSI 반전 신호와 함께 사용하면 트렌드의 시작에서 일찍 진입 할 수 있습니다.
-
EMA 라인, RSI 지표 및 K 라인 폐쇄 가격의 이중 확인은 잘못된 신호를 효과적으로 필터링합니다.
-
중장기 동향을 따라가는 것은 통합 후 새로운 상승 동향을 식별하는 것이 적합합니다.
위험 분석
-
EMA 라인이 죽음의 십자가가 있을 때 포지션을 닫습니다.
-
숨겨진 RSI 분리를 식별하는 데는 경험이 필요합니다. 잘못된 매개 변수 조정으로 인해 신호가 누락되거나 잘못된 신호가 발생할 수 있습니다.
-
매개 변수는 다른 거래 도구에 최적화되어야 합니다.
최적화 방향
-
더 나은 트렌드 결정 정확성을 위해 EMA 매개 변수를 동적으로 조정합니다.
-
더 나은 숨겨진 디버전스 신호 정확성을 위해 RSI 매개 변수를 정렬하십시오.
-
ATR 또는 비율 중지와 같은 스톱 손실 메커니즘을 추가하여 위험을 제어합니다.
-
하락 트렌드를 거래하기 위해 단기 포지션에 대한 전략을 개발하십시오.
결론
이 전략은 트렌드 결정 및 RSI 신호를 결합하여 정확도를 높인다. 통합 후 새로운 상승 추세를 식별한다. 적절한 매개 변수 조정 및 위험 관리로 좋은 결과를 얻을 수 있다. 간단한 이동 평균 전략에 비해, 더 나은 승률을 가진 추세를 잡는 데 더 높은 정확성을 가지고 있다. 전반적으로 이것은 전략에 따른 실용적인 추세이다.
/*backtest
start: 2024-01-25 00:00:00
end: 2024-02-01 00:00:00
period: 1m
basePeriod: 1m
exchanges: [{"eid":"Futures_Binance","currency":"BTC_USDT"}]
*/

//@version=4

strategy(title="EMA RSI ATR Hidden Div Strat", shorttitle="Hidden Div Strat", overlay = true, pyramiding = 0, max_bars_back=3000, calc_on_order_fills = false, commission_type =  strategy.commission.percent, commission_value = 0, default_qty_type = strategy.percent_of_equity, default_qty_value = 10, initial_capital=5000, currency=currency.USD)

// Time Range
FromMonth=input(defval=1,title="FromMonth",minval=1,maxval=12)
FromDay=input(defval=1,title="FromDay",minval=1,maxval=31)
FromYear=input(defval=2020,title="FromYear",minval=2016)
ToMonth=input(defval=1,title="ToMonth",minval=1,maxval=12)
ToDay=input(defval=1,title="ToDay",minval=1,maxval=31)
ToYear=input(defval=9999,title="ToYear",minval=2017)
start=timestamp(FromYear,FromMonth,FromDay,00,00)
finish=timestamp(ToYear,ToMonth,ToDay,23,59)
window()=>true

// Bar's time happened on/after start date?
afterStartDate = time >= start and time<=finish?true:false

//EMA'S
emasrc = close

len1 = input(50, minval=1, title="EMA1")
ema1 = ema(emasrc, len1)
col1 = color.white

len2 = input(250, minval=1, title="EMA2")
ema2 = ema(emasrc, len2)
col2 = color.yellow

//Plots
plot(ema1, title="EMA1", linewidth=1, color=col1)
plot(ema2, title="EMA2", linewidth=1, color=col2)

//Stoch
periodK = input(4, title="K", minval=1)
periodD = input(4, title="D", minval=1)
smoothK = input(3, title="Smooth", minval=1)
k = sma(stoch(close, high, low, periodK), smoothK)
d = sma(k, periodD)

//Hidden Divergence Indikator

len = input(title="RSI Period", minval=1, defval=14)
src = input(title="RSI Source", defval=close)
lbR = input(title="Pivot Lookback Right", defval=1)
lbL = input(title="Pivot Lookback Left", defval=19)
rangeUpper = input(title="Max of Lookback Range", defval=20)
rangeLower = input(title="Min of Lookback Range", defval=4)
hiddenBullColor = color.new(color.green, 80)
textColor = color.white
noneColor = color.new(color.white, 100)
osc = rsi(src, len)

plFound = na(pivotlow(osc, lbL, lbR)) ? false : true
phFound = na(pivothigh(osc, lbL, lbR)) ? false : true
_inRange(cond) =>
	bars = barssince(cond == true)
	rangeLower <= bars and bars <= rangeUpper

//------------------------------------------------------------------------------
// Hidden Bullish
// Osc: Lower Low

oscLL = osc[lbR] < valuewhen(plFound, osc[lbR], 1) and _inRange(plFound[1])

// Price: Higher Low

priceHL = low[lbR] > valuewhen(plFound, low[lbR], 1)
hiddenBullCond = priceHL and oscLL and plFound

//buy Conditions
buyhiddenbull = hiddenBullCond[1] or hiddenBullCond[2] or hiddenBullCond[3] or hiddenBullCond[4] or hiddenBullCond[5] or hiddenBullCond[6] or hiddenBullCond[7] or hiddenBullCond[8] or hiddenBullCond[9] or hiddenBullCond[10]
emacondition = ema1 > ema2
upcondition = close[1] > ema1[1] and ema2[1] and close[2] > ema1[2] and ema2[2] and close[3] > ema1[3] and ema2[3]
crossup = k[0] >= d[0] and k[1] <= d[1]
longcondition = emacondition and upcondition and crossup and buyhiddenbull

if (afterStartDate)
    strategy.entry("Long", strategy.long, when = longcondition)

//TakeProfit, StopLoss lowest low
profitfactor = input(title="Profitfactor", type=input.float, step=0.1, defval=1.6)
loLen = input(title="Lowest Low Lookback", type=input.integer,
  defval=38, minval=2)
stop_level = lowest(low, loLen)[1]
bought = strategy.position_size[1] < strategy.position_size
barsbought = barssince(bought)

if strategy.position_size>0
    profit_level = strategy.position_avg_price + ((strategy.position_avg_price - stop_level[barsbought])*profitfactor)
    strategy.exit(id="TP/ SL", stop=stop_level[barsbought], limit=profit_level)
- 트렌드 예측 이중 이동 평균 전략
- 이중 이동 평균 역전 전략
- 이중 돌파구 이동 평균 거래 전략
- 눈부신 볼트 트렌드 전략
- VRSI 및 MARSI 전략
- 도지 패턴에 기반한 손해를 멈추고 수익을 취하는 전략
- 이중 기하급수적 이동 평균 트렌드 전략
- DMI 잔액 구매/판매 전략
- 이동 평균 이동 봉투 전략
- 시장 잠재력 이치모쿠 상승 구름 전략
- 포용 패턴과 양적 지표에 기초한 고급 트렌드 추적 전략
- 알파트렌드 이중 추적 전략
- 피셔 유리크 후속 정지 전략
- RSI 스칼핑 전략의 추세
- 이동평균 확증과 함께 나선형 십자 전략
- 골드 크로스 데드 크로스 양적 거래 전략
- 이중 이동 평균 전략 360°
- 오픈 하이 클로즈 로우 브레이크오프 거래 전략
- 이중 기하급수적 이동 평균 양상 거래 전략
- 동적 SMMA 및 SMA 크로스오버 전략