개요
이 전략은 쌍방향 운동량 지수 DI+, DI- 및 평균 방향 지수 ADX를 계산하여 지수 이동 평균 EMA와 결합하여 거래 신호를 생성한다. DI+ 상위 DI-를 통과하고 ADX가 20보다 높을 때 구매 신호를 생성한다. DI- 아래 DI+를 통과하고 ADX가 25보다 높을 때 판매 신호를 생성한다. 거래 중지 신호는 DI- 상위 DI+를 통과하고 ADX가 30 이상이다.
전략 원칙
DI+, DI-, ADX 계산
- ta.dmi() 함수를 호출하여 DI+, DI- 및 ADX를 계산합니다.
- DI+/DI- 가격의 방향을 반영
- ADX는 가격의 평균 변화를 나타냅니다.
지수 이동 평균 EMA 계산
- 사용자 정의 my_ema () 함수를 호출하여 EMA를 계산합니다.
- EMA는 가격 데이터를 효율적으로 평형시킬 수 있습니다.
거래 신호 생성
- 구매 신호: DI+ 상의 DI-를 착용하고 ADX>20과 종식 가격>EMA
- 가격의 상승과 큰 변화의 경향을 설명합니다.
- 팔기 신호: DI-하의 DI+와 ADX>25와 종결 가격
- 가격 추세가 하락하고 변동이 큰 것으로 나타났습니다.
- 구매 신호: DI+ 상의 DI-를 착용하고 ADX>20과 종식 가격>EMA
거래 중단
- 구매한 지연: DI-에 DI+를 착용하고 ADX>30
- 가격의 역전
- 매매 중지: DI+ 아래로 DI-를 뚫고 ADX>30
- 가격의 역전
- 구매한 지연: DI-에 DI+를 착용하고 ADX>30
종합적으로, 이 전략은 종합 운동량 지표와 트렌드 지표로, 가격 트렌드가 강할 때 거래 신호를 생성한다. 동시에 스톱로스 조건을 설정하여 손실을 제한한다.
우위 분석
- 이중 DI를 사용하여 가짜 신호를 피하십시오.
- 단일 DI는 잘못된 신호를 발생시킬 수 있으며, DI+와 DI-의 조합은 트렌딩성을 보장합니다.
- ADX 조건은 가격 변동이 큰 것을 보장합니다.
- 가격 변동이 심할 때만 거래하고, 흔들리는 시장을 피하십시오.
- EMA 조건 DI
- EMA는 가격의 중장선 트렌드를 효과적으로 식별할 수 있습니다.
- 엄격한 상쇄 조건
- 적자를 막고 큰 손실을 피하는 방법
위험 분석
- 빈번한 상쇄
- 만약 상황이 급격하게 흔들리면, 손실이 너무 자주 발생할 수 있습니다.
- 변수 의존
- DI와 ADX 변수는 최적의 조합을 찾기 위해 최적화해야 합니다.
- 거래 빈도가 낮습니다.
- 더 엄격한 거래 조건은 거래 빈도를 낮출 수 있습니다.
스톱로스 범위를 확장하거나, 파라미터 집합을 조정하거나, 추가 필터링 조건을 추가하여 거래 빈도를 높여 최적화할 수 있다.
최적화 방향
- 변수 최적화
- 최적화된 DI와 ADX 변수를 사용하여 최적의 조합을 찾아내는 방법
- 필터를 추가
- 트랜지션 양을 추가하거나, 이탈하는 등의 조건 필터링 신호
- 더 큰 손해배상
- 적당히 느슨한 휴식 조건, 빈번한 휴식
요약하다
이 전략은 운동량 지표와 트렌드 분석 지표를 통합하여 가격 추세가 강할 때 거래 신호를 발생시킨다. 엄격한 중지 조건 제어 위험을 설정한다. 파라미터를 최적화하고 신호 필터를 추가하고 중지 범위를 적절하게 확장함으로써 전략 효과를 더욱 향상시킬 수 있다.
전략 소스 코드
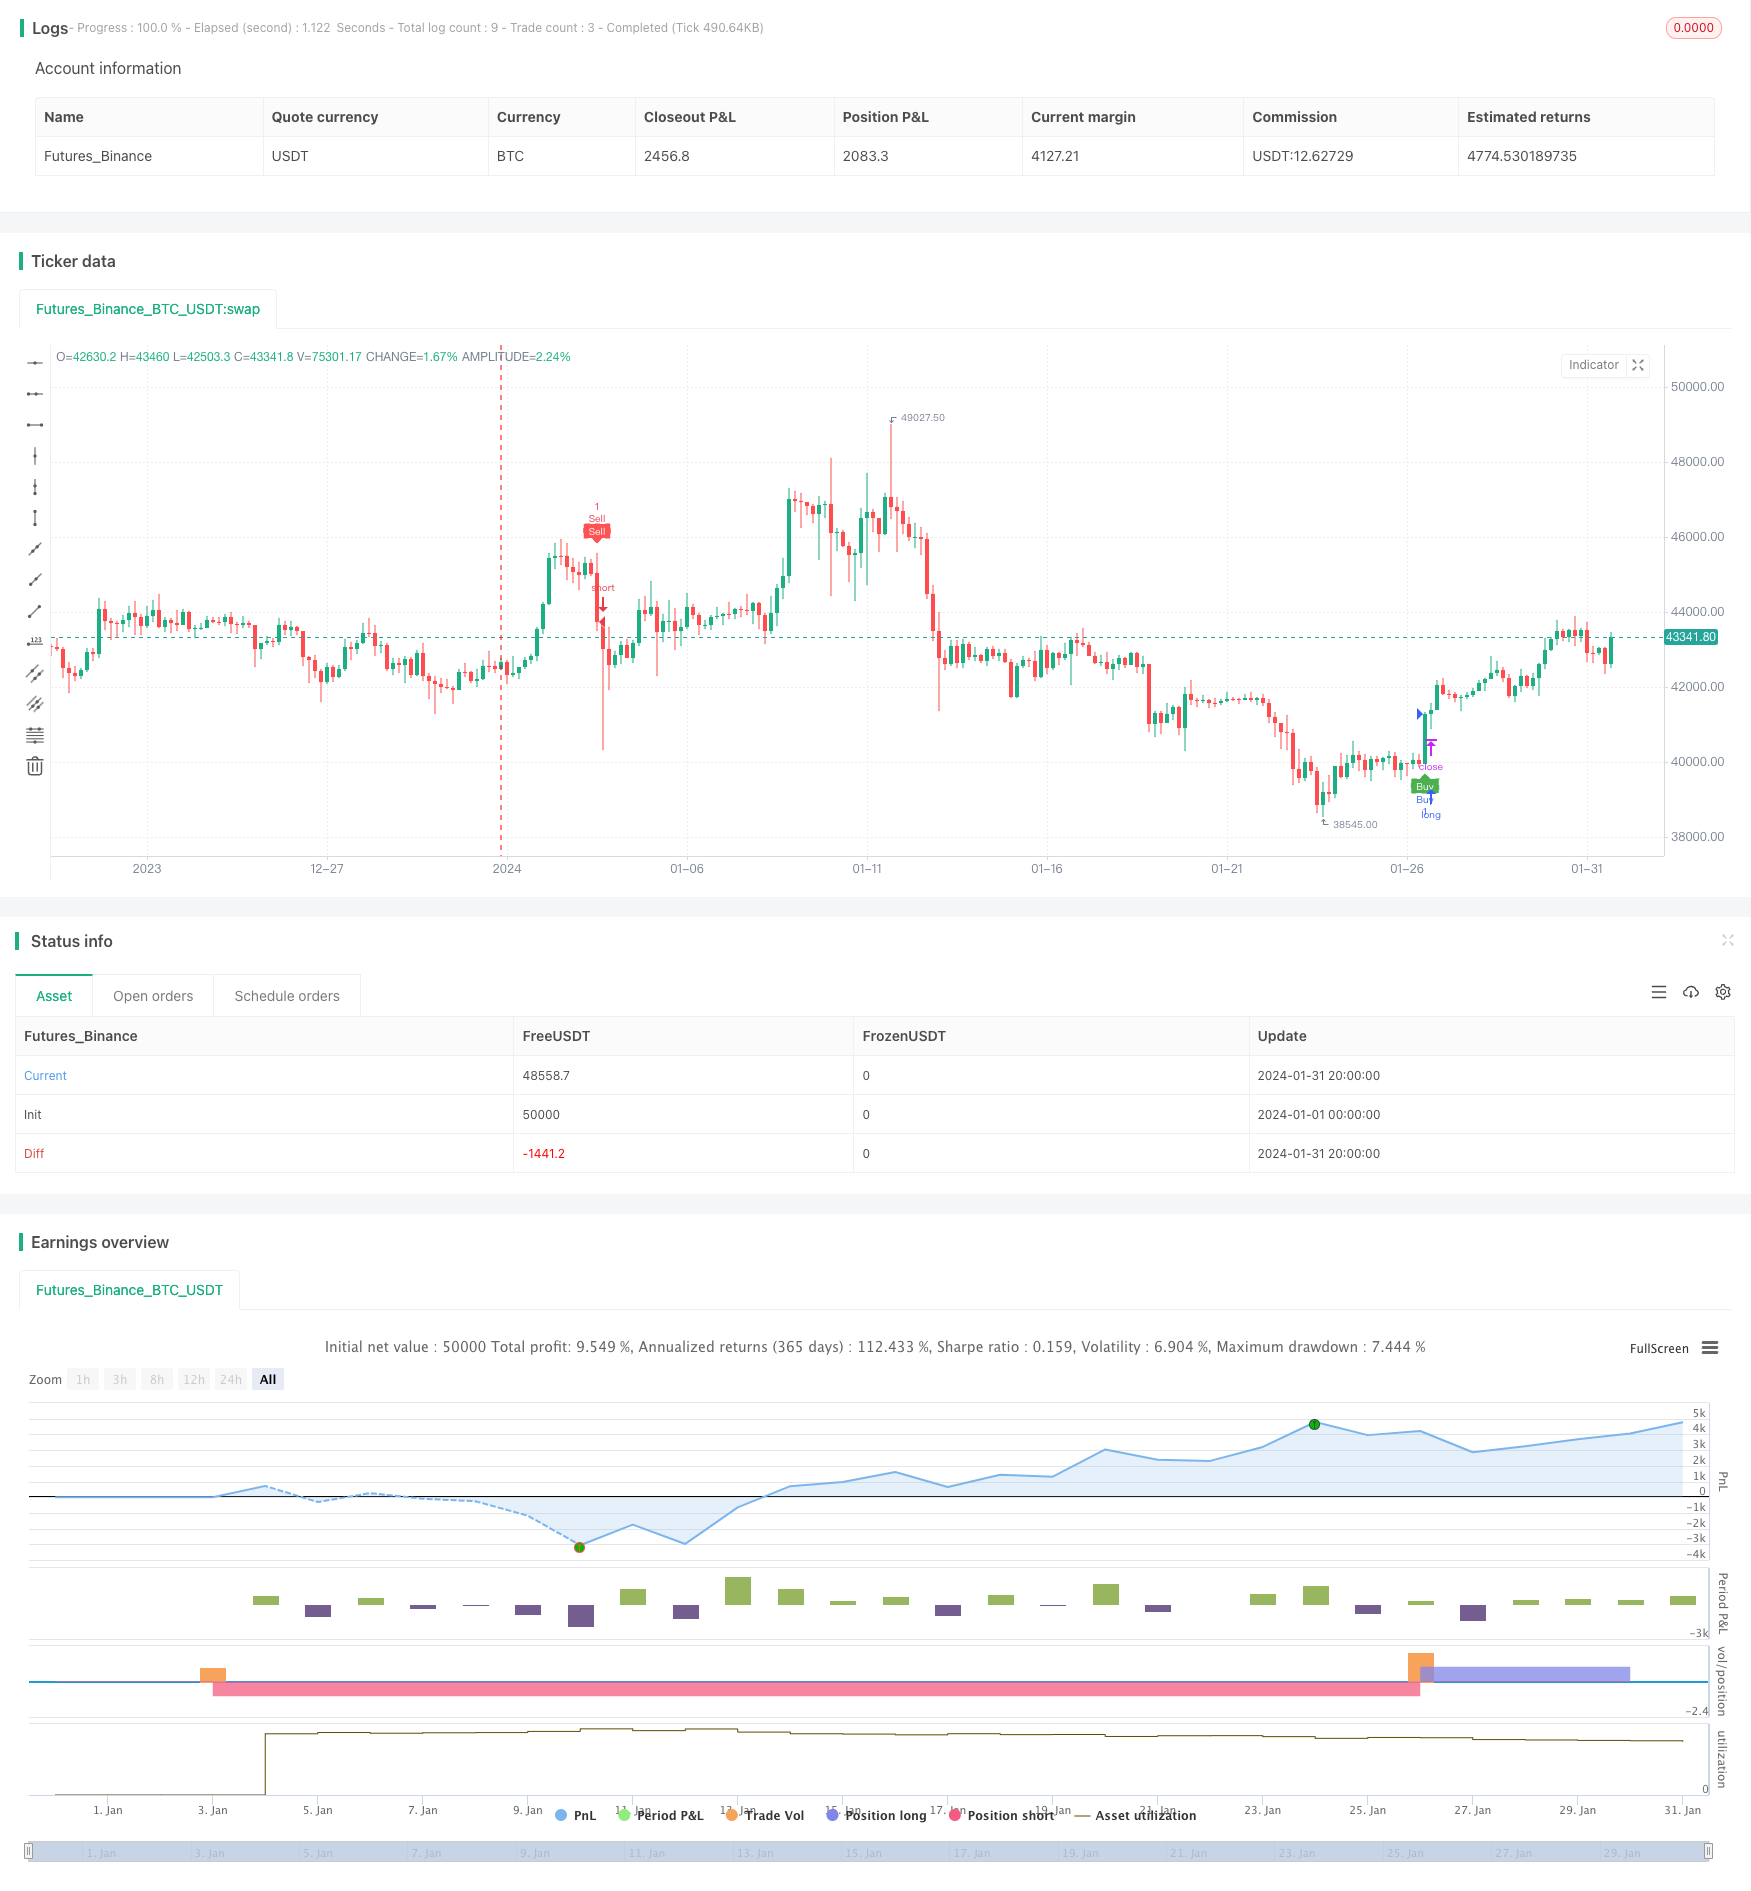
/*backtest
start: 2024-01-01 00:00:00
end: 2024-01-31 23:59:59
period: 4h
basePeriod: 15m
exchanges: [{"eid":"Futures_Binance","currency":"BTC_USDT"}]
*/

// This Pine Script™ code is subject to the terms of the Mozilla Public License 2.0 at https://mozilla.org/MPL/2.0/
// © Tamil_FNO_Trader

//@version=5
strategy("Overlay Signals by TFOT", overlay=true)

// Calculate DMI
len = input.int(14, minval=1, title="DI Length")
lensig = input.int(14, title="ADX Smoothing", minval=1, maxval=50)
[diplus, diminus, adx] = ta.dmi(len, lensig)

// Get EMA
emalen = input.int(26, minval=1, title = "EMA Length")
emasrc = input.source(close, title = "EMA Source")

my_ema(src, length) =>
    alpha = 2 / (length + 1)
    sum = 0.0
    sum := na(sum[1]) ? src : alpha * src + (1 - alpha) * nz(sum[1])
EMA2 = my_ema(emasrc, emalen)

// Variables
var bool buycondition1 = false
var bool sellcondition1 = false

var int firstbuybar = na
var int firstsellbar = na

var int buyexitbar = na
var int sellexitbar = na

var bool buyexit1 = false
var bool sellexit1 = false

// Buy & Sell Conditions
buycondition1 := (ta.crossover(diplus, diminus)) and (adx > 20) and (close > EMA2) and na(firstbuybar)
sellcondition1 := (ta.crossover(diminus, diplus)) and (adx > 25) and (close < EMA2) and na(firstsellbar)

buyexit1 := ta.crossover(diminus, diplus) and (adx > 30) and na(buyexitbar)
sellexit1 := ta.crossover(diplus, diminus) and (adx > 30) and na(sellexitbar)

if buycondition1
    if(na(firstbuybar))
        firstbuybar := bar_index
        buyexitbar := na
        firstsellbar := na
        strategy.entry("Buy", strategy.long)

if sellcondition1
    if(na(firstsellbar))
        firstsellbar := bar_index
        sellexitbar := na
        firstbuybar := na
        strategy.entry("Sell", strategy.short)

if buyexit1 and not na(firstbuybar)
    if(na(buyexitbar))
        buyexitbar := bar_index
        firstbuybar := na
        firstsellbar := na
        strategy.close("Buy")

if sellexit1 and not na(firstsellbar)
    if(na(sellexitbar))
        sellexitbar := bar_index
        firstsellbar := na
        firstbuybar := na
        strategy.close("Sell")

// Plot signals on chart
hl = input.bool(defval = true, title = "Signal Labels")

plotshape(hl and buycondition1 and bar_index == firstbuybar ? true : na, "Buy", style = shape.labelup, location = location.belowbar, color = color.green, text = "Buy", textcolor = color.white, size = size.tiny)
plotshape(hl and sellcondition1 and bar_index == firstsellbar ? true : na, "Sell", style = shape.labeldown, location = location.abovebar, color = color.red, text = "Sell", textcolor = color.white, size = size.tiny)

plotshape(hl and buyexit1 and bar_index == buyexitbar ? true : na, "Buy Exit", style = shape.labelup, location = location.belowbar, color = color.red, text = "Buy X", textcolor = color.white, size = size.tiny)
plotshape(hl and sellexit1 and bar_index == sellexitbar ? true : na, "Sell Exit", style = shape.labeldown, location = location.abovebar, color = color.red, text = "Sell X", textcolor = color.white, size = size.tiny)