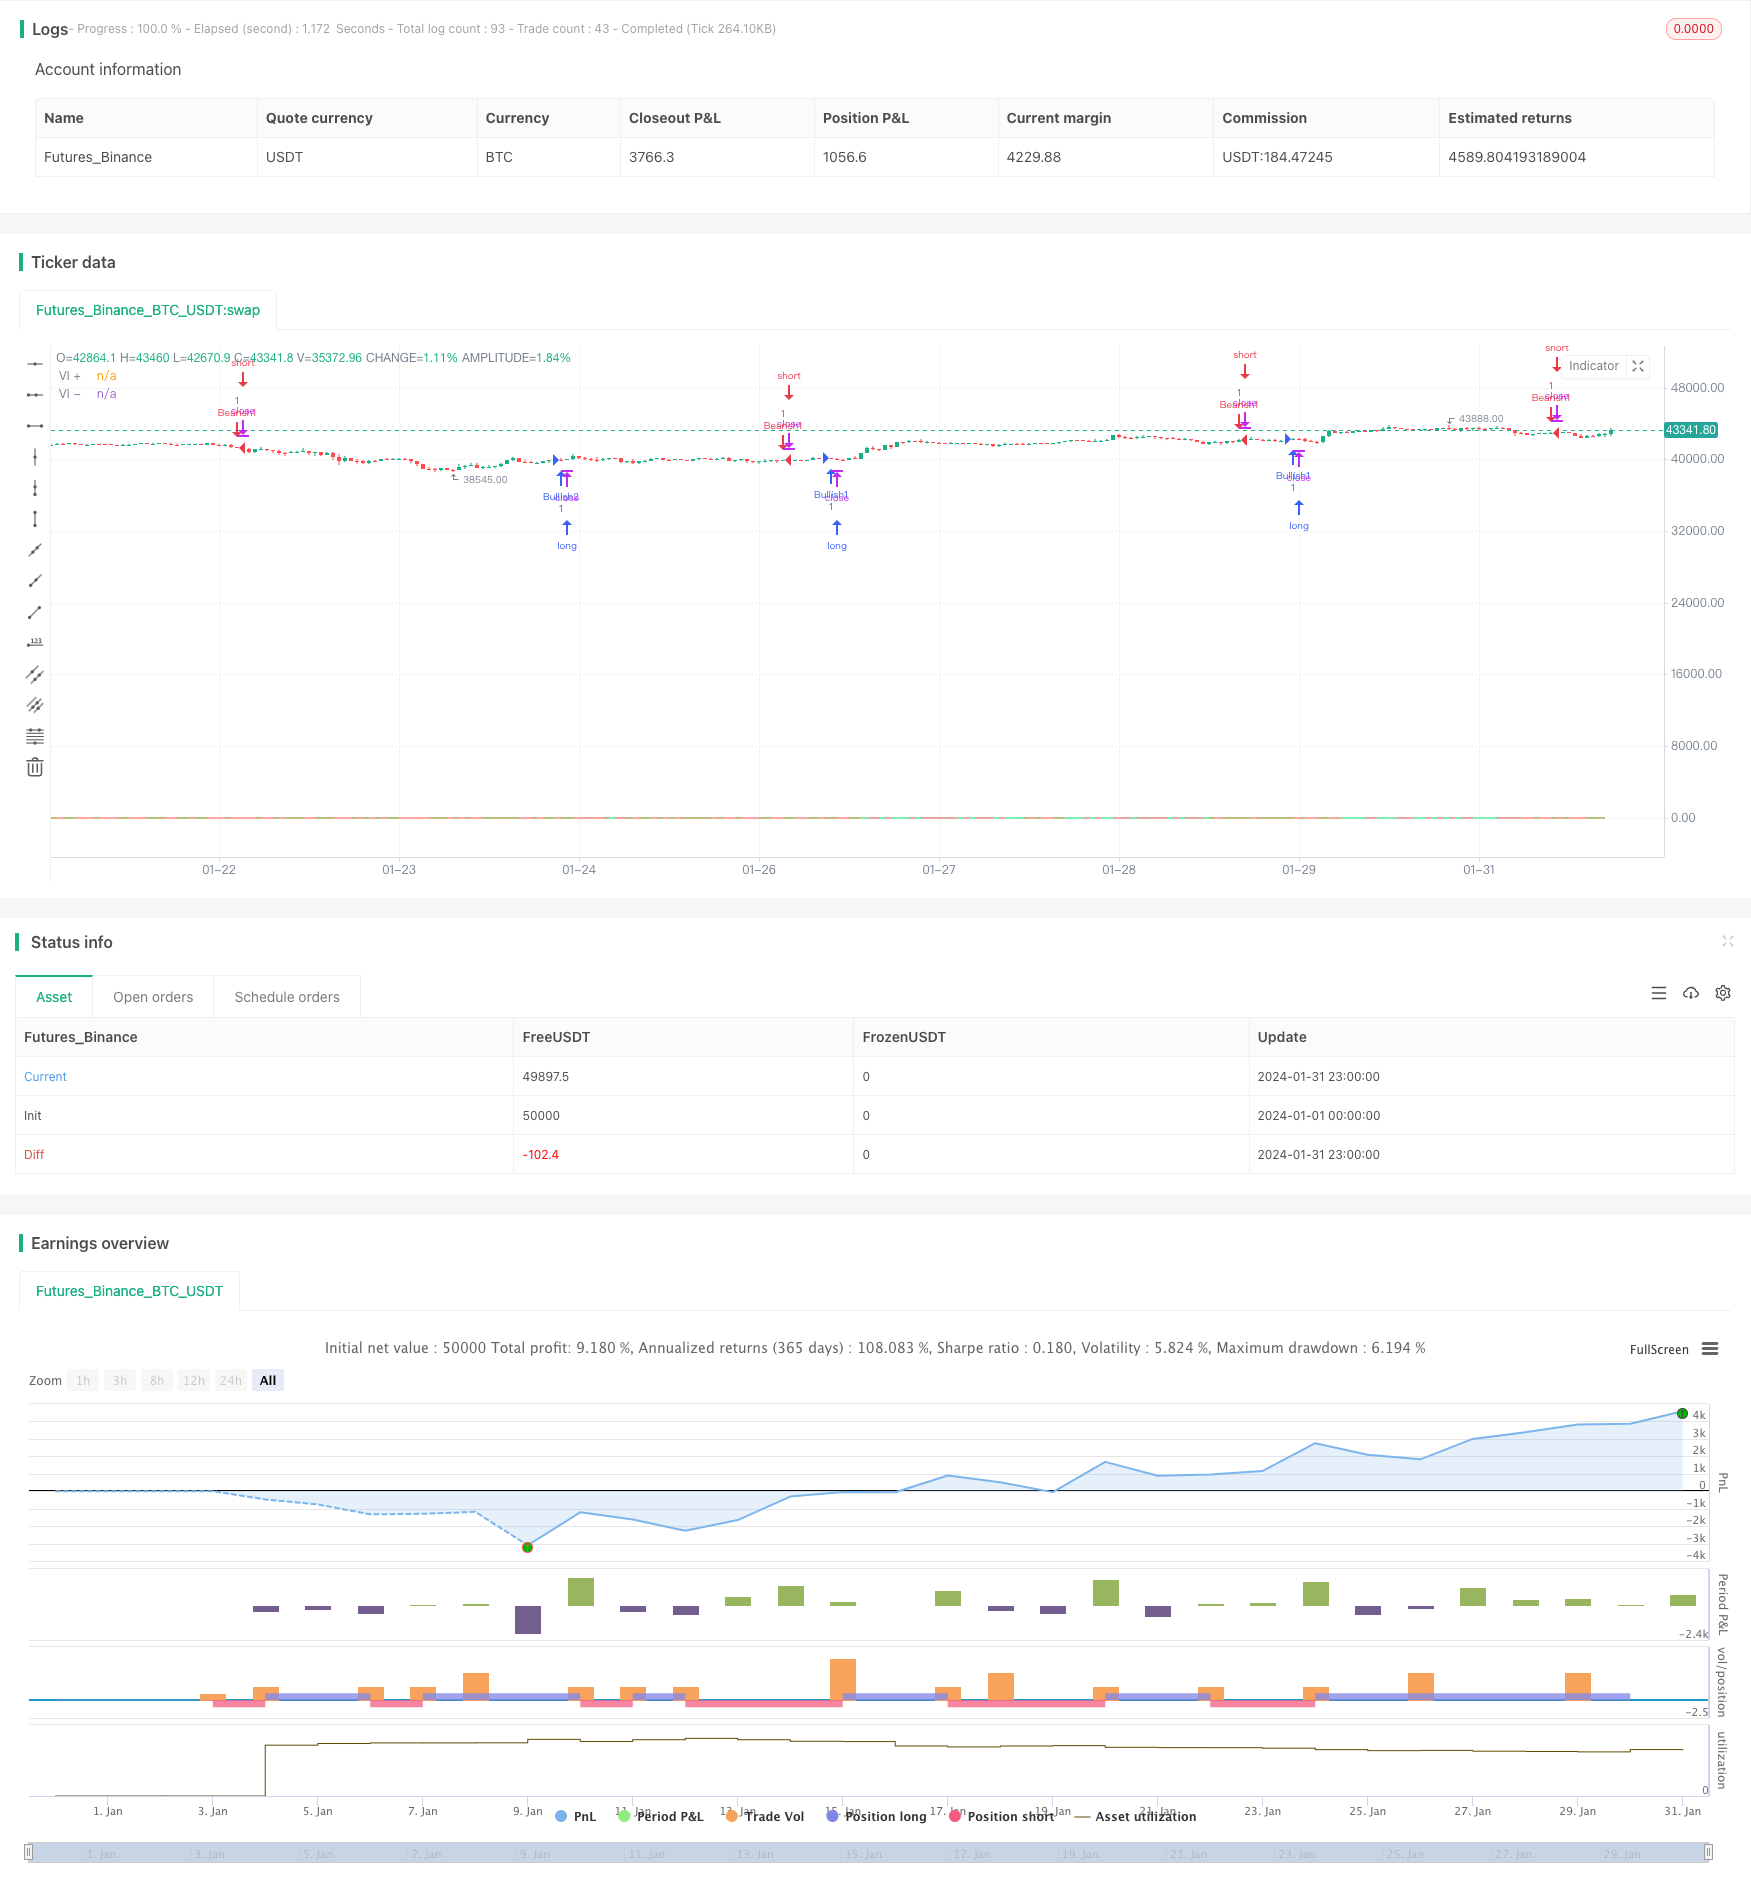
V-회전 SMA 전략
저자:차오장, 날짜: 2024-02-18 15:04:34태그:

전반적인 설명
V-회전 SMA 전략은 14일 절댓값과 전날 최저값 사이의 14일 절댓값 차이, 그리고 최저값과 전날 최저값 사이의 14일 절댓값 차이 등을 계산한다. 그 다음 14일 단순한 이동평균을 계산하여 VI+와 VI- 곡선을 형성한다. VI+가 VI를 넘을 때 구매 신호가 생성된다. VI-가 VI+를 넘을 때 판매 신호가 생성된다.
원칙
이 전략의 핵심 지표는 VI+ 및 VI-입니다. VI-는 상승 동력을 반영하고 VI-는 하락 동력을 반영합니다. 구체적인 계산 공식은 다음과 같습니다.
VMP = SUM(ABS(HIGH - LOW[1]),14)
VMM = SUM(ABS(LOW - HIGH[1]),14)
STR = SUM(ATR(1),14)
VI+ = VMP/STR
VI- = VMM/STR
곡선에서의 진동을 제거하기 위해, 14일 간 간단한 이동 평균은 VI+와 VI-를 계산하여 SMA ((VI+) 와 SMA ((VI-) 를 얻습니다. SMA ((VI+) 가 SMA ((VI-) 를 넘을 때 상승 신호가 생성됩니다. SMA ((VI-) 가 SMA ((VI-) 를 넘을 때 하락 신호가 생성됩니다.
또한, 전략은 또한 추세를 판단하고 신호를 필터하기 위해 VI + 및 VI-의 상승과 하락 상태를 결합합니다. 추세가 하락 할 때만 길고 추세가 상승 할 때만 짧습니다.
이점 분석
트렌드 상태와 VI 지표의 황금/죽은 십자가를 결합함으로써 이 전략은 잘못된 신호를 효과적으로 필터링하고 수익성을 향상시킬 수 있습니다. 간단한 이동 평균 전략에 비해 파업 신호는 더 신뢰할 수 있습니다.
위험 분석
이 전략의 주요 위험은 다음과 같습니다.
-
VI 지표는 특정 기간에 잘못된 신호를 생성할 수 있습니다. 트렌드 필터링과 스톱 로스는 위험을 제어하기 위해 사용되어야 합니다.
-
높은 거래 비용과 미끄러짐이 있는 시장은 이 전략에 적합하지 않습니다. 이 전략은 수익률을 크게 줄일 수 있기 때문입니다.
최적화 방향
이 전략은 다음과 같은 측면에서 최적화 될 수 있습니다.
-
VI 지표의 매개 변수를 최적화하여 가장 좋은 매개 변수 조합을 찾습니다.
-
기계 학습 방법을 사용하여 잘못된 신호를 자동으로 식별하고 신호 품질을 향상시킵니다.
-
단일 거래 손실을 통제하기 위해 Stop Loss 및 돈 관리로 출구 메커니즘을 최적화하십시오.
-
거래 비용을 낮추는 시장에 초점을 맞추어 거래 제품 선택을 최적화합니다.
결론
V-회전 SMA 전략은 VI+ 및 VI- 지표를 계산하고 트렌드 상태를 결합하여 거래 신호를 결정합니다. 이는 비교적 신뢰할 수있는 트렌드 다음 전략입니다. 그것의 강점은 높은 신호 품질과 소음을 필터하는 능력에 있습니다. 그러나 또한 함락 될 위험이 있으며 시장 변화에 적응하기 위해 지속적인 최적화가 필요합니다.
/*backtest
start: 2024-01-01 00:00:00
end: 2024-01-31 23:59:59
period: 1h
basePeriod: 15m
exchanges: [{"eid":"Futures_Binance","currency":"BTC_USDT"}]
*/

//@version=4
//@author=SIDD
//Sidd-Vortex strategy is using Vortex formula  to generate 4 signals Bullish1 Bullish2 and Bearish1 Bearish2.

//Bullish1 signal is getting generated when smooth ma of VIP is crossing over smooth ma of VIM and smooth VIM is falling from previous bar smooth VIM

//Bullish2 signal is getting generated when smooth ma of VIP is crossing over smooth ma of VIM and smooth VIP is rising from previous bar smooth VIP

//Bearish1 signal is getting generated when smooth ma of VIM is crossing over smooth ma of VIP and smooth VIP is falling from previous bar smooth VIP

//Bearish2 signal is getting generated when smooth ma of VIM is crossing over smooth ma of VIP and smooth VIM is rising from previous bar smooth VIM

//This strategy can be converted into study un-commenting the plotshape and 15th line strategy replace with study and overlay=false

strategy(title = "SIDD-Vortex", shorttitle="SIDD-VORTEX", format=format.price, precision=4,overlay=true)
period_ = input(14, title="Period", minval=2)
len = input(14, minval=1, title="WMA Length")

VMP = sum( abs( high - low[1]), period_ ) // sum of absolute current high and previous low with 14 period default
VMM = sum( abs( low - high[1]), period_ ) // sum of absolute current low and previous high with 14 period default
STR = sum( atr(1), period_ )  //sum of daily atr for 14 days
VIP = VMP / STR
VIM = VMM / STR

simpleMAVIP=wma(VIP, len)
smmaVIP = 0.0
smmaVIP := na(smmaVIP[1]) ? simpleMAVIP : (smmaVIP[1] * (len - 1) + VIP) / len // finding the Smoothing average

simpleMAVIM=wma(VIM, len)
smmaVIM = 0.0
smmaVIM := na(smmaVIM[1]) ? simpleMAVIM : (smmaVIM[1] * (len - 1) + VIM) / len // finding the Smoothing average


risingVIP = rising(smmaVIP, 1)
fallingVIP = falling(smmaVIP, 1)

lineColorVIP = smmaVIP > 0.95 and risingVIP  ? color.lime : smmaVIP > 0.95 ? #d65240 : smmaVIP < 0.95 and fallingVIP ? color.red : color.olive

risingVIM = rising(VIM, 1)
fallingVIM = falling(VIM, 1)

lineColorVIM = smmaVIM > 0.95 and risingVIM  ? color.red : smmaVIM > 0.95 ? color.olive : smmaVIM < 0.95 and fallingVIM ? color.lime : #d65240

plot(VIP, title="VI +", color=lineColorVIP)
plot(VIM, title="VI -", color=lineColorVIM)

longCondition = crossover(smmaVIP,smmaVIM)
shortCondition = crossover(smmaVIM,smmaVIP)


if (longCondition and fallingVIM)
    strategy.entry("Bullish1", strategy.long)
if (shortCondition and fallingVIP)
    strategy.entry("Bearish1", strategy.short)

if (longCondition and risingVIP)
    strategy.entry("Bullish2", strategy.long)
if (shortCondition and risingVIM)
    strategy.entry("Bearish2", strategy.short)

//plotshape(longCondition and fallingVIM, color=color.lime, location=location.belowbar, style=shape.triangleup,size= size.large,text="Bullish",offset=0,textcolor=color.white)
//plotshape(longCondition and risingVIP, color=color.lime, location=location.belowbar, style=shape.labelup,size= size.large,text="Bullish",offset=0,textcolor=color.white)
//plotshape(Diff > 0 and direction>0, color=color.lime, location=location.belowbar, style=shape.arrowup,size= size.normal,offset=0)

//plotshape(shortCondition and fallingVIP  , color=color.red, location=location.abovebar, style=shape.triangledown, size= size.large,text="Bearish",offset=0,textcolor=color.white)
//plotshape( shortCondition and risingVIM  , color=color.red, location=location.abovebar, style=shape.labeldown, size= size.large,text="Bearish",offset=0,textcolor=color.white)


//band1 = hline(1.0  , title="Upper Line", linestyle=hline.style_dashed, linewidth=3, color=color.red)
//band0 = hline(0.5, title="Lower Line", linestyle=hline.style_dashed, linewidth=3, color=color.lime)
//fill(band1, band0, color=color.purple, transp=70)
- ATR, EOM 및 VORTEX에 기반한 장기 트렌드 전략
- 이중 이동 평균 지능 추적 거래 전략
- 고용량 저출력 복합 포지션 사이징 전략
- BEAM 대역에 기초한 비트코인 달러 비용 평균
- 바이런 뱀 클라우드 양자 전략
- 이중 시간 프레임 변동성 스프레드 거래 전략
- 시일레이터 프로파일 반전 전략 다중 시간 프레임 MACD 제로 크로싱 기반
- MACD EMA 크로스오버 트렌드 추적 전략
- 이중 이동 평균 거래 전략
- 이중 이동 평균 골든 크로스 트렌드 거래 전략
- 선형 회귀 채널 브레이크업 거래 전략
- 이중 EMA 지표 기반 트렌드 전략
- 진짜 거북이
암 거북이 처럼 굳건 한 전략 - 오픈 하이스 로프 스톱 로스 추적 전략
- 장기 및 단기 모두에 대한 포괄적인 선물 자동 거래 전략
- 슈퍼트렌드 브레이크아웃 거래 전략
- 3 이동 평균 변동 간격 역전 전략
- 동력 평균 역반응 풀백 전략
- 멀티타임프레임 트렌드 헌터 전략
- DCCI 탈퇴 전략