개요
이 전략은 MACD 지표의 평균선 조합을 기반으로, 시간 주기 간 동적 추세를 판단하고, 더 고전적인 추세 추적 전략에 속한다. 주로 빠른 느린 평균선의 차치 MACD와 그것의 신호 선의 관계를 통해, 현재 추세 방향과 강도를 판단한다. 동시에 정확성을 높이기 위해, 동적으로 위치 조정하는 범주간 판단을 도입한다.
전략 원칙
- MACD 지표의 급속도 평균선 차치와 그 신호선 관계를 기반으로 현재 트렌드 방향을 판단
- MACD 차이는 상단 신호선을 다중 신호로, 하단 신호를 공백 신호로
- MACD 격차와 MACD 기둥선을 도입하여 동방향으로 전략 신호를 강화합니다.
- 초주기 판단 모듈을 추가하고, 높은 시간주기 MACD 지표를 신호 파와 포지션 조절의 기초로 사용한다
- 포지션 동적 조정, 초주기 신호가 약할 때 포지션 규모를 줄이고, 신호가 강화될 때 포지션을 증가
우위 분석
- MACD 지표 자체는 트렌드 방향을 판단하는 데 더 효과적입니다.
- 조합 MACD 변수와 기둥선 이중 검증으로 신호 정확도를 향상시킬 수 있다.
- 초주기 판단은 전략의 안정성을 높이고, 고주파 신호에 의해 오도되는 것을 방지합니다.
- 역동적인 포지션 조정으로 전략이 더 나은 기회를 잡을 수 있고, 초과 수익을 올릴 수 있습니다.
위험 분석 및 해결 방법
- MACD 신호가 지연되어 신호가 약간 부실해질 수 있습니다.
- 해결 방법: 빠른 평균선과 느린 평균선 차이를 추가하여 미리 신호를 잡기
- 초주기적 신호는 정확하지 않아 전략에 착각할 수 있습니다.
- 해결 방법: 주주기 전략이 지배적으로 작용하는 포지션 역동적 조정 장치를 도입합니다.
- 다인자 조합 전략의 전체적인 안정성은 부족할 수 있다.
- 해결방안: 전체적인 안정성을 보장하기 위해 정책의 요소를 신중하게 조정하는 방법
최적화 방향
- 다른 주기 변수 조합의 효과를 테스트합니다.
- 전략 효과에 대한 다양한 주기 간 조합의 영향을 테스트
- MACD 지표 파라미터를 조정합니다. 예를 들어, 속속 평균선 주기, 신호선 주기 등
- 다른 포지션 조절 요소의 효과를 테스트하는 것
- 다른 품종에 대한 테스트 결과
요약하다
이 MACD는 평행한 조합으로 크로스 사이클 동적인 트렌드 전략으로, 클래식 지표 판단과 다중 시간 프레임 참조의 장점을 통합한다. 변수 최적화 및 조합 테스트를 통해, 보다 안정적이고, 수익 좋은 트렌드 추적 전략을 구축할 수 있다. 실장 테스트 및 투입 적용 가치가 있다.
전략 소스 코드
/*backtest
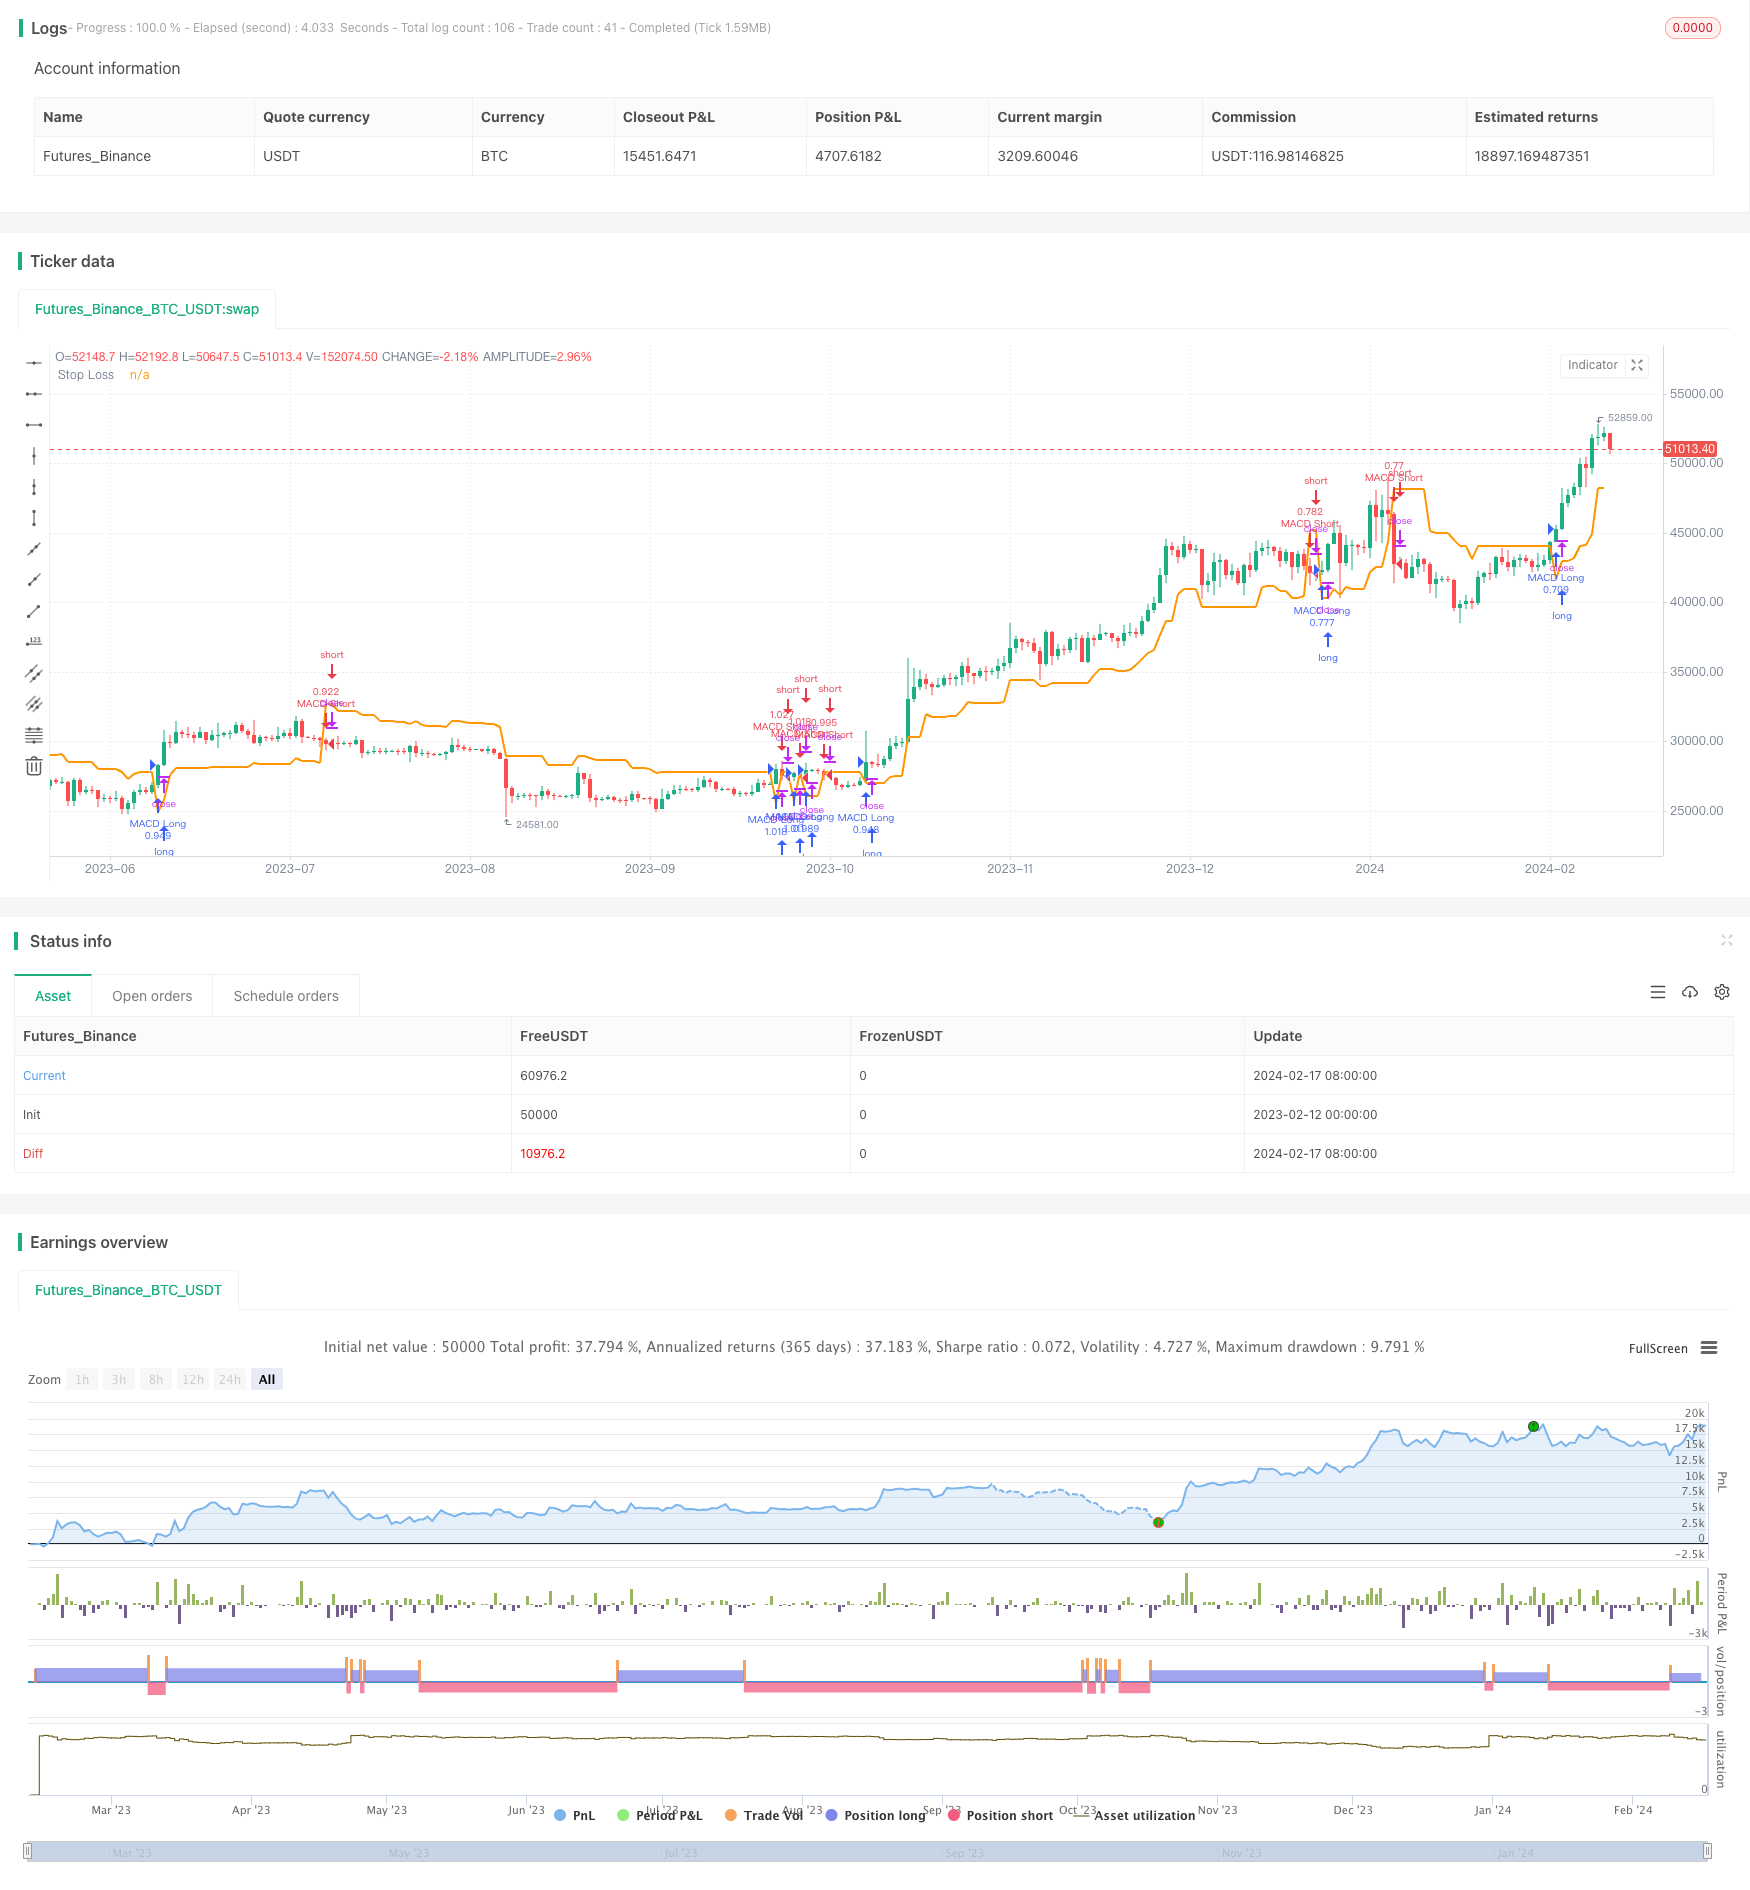
start: 2023-02-12 00:00:00
end: 2024-02-18 00:00:00
period: 1d
basePeriod: 1h
exchanges: [{"eid":"Futures_Binance","currency":"BTC_USDT"}]
*/
//@temelbulut
//@version=5
strategy('MACD Strategy %80', overlay=true, default_qty_type=strategy.percent_of_equity, default_qty_value=50)
fastLength = input.int(title='MACD Fast Length', defval=12, minval=1)
slowLength = input.int(title='MACD Slow Length', defval=26, minval=1)
signalLength = input.int(title='MACD Signal Length', defval=9, minval=1)
crossscore = input(title='Cross (buy/sell) Score', defval=10.)
indiside = input(title='indicator Direction Score', defval=8)
histside = input(title='Histogram Direction Score', defval=2)
shotsl = input(title='Show Stop Loss Line', defval=false)
Mult = input.float(title='Stop Loss Factor', defval=1.2, minval=0.1, maxval=100)
Period = input.int(title='Stop Loss Period', defval=10, minval=1, maxval=100)
lookaheadi = input(title='Lookahead', defval=true)
HTF = timeframe.period == '1' ? '5' : timeframe.period == '3' ? '15' : timeframe.period == '5' ? '15' : timeframe.period == '15' ? '60' : timeframe.period == '30' ? '60' : timeframe.period == '45' ? '60' : timeframe.period == '60' ? '240' : timeframe.period == '120' ? '240' : timeframe.period == '180' ? '240' : timeframe.period == '240' ? 'D' : timeframe.period == 'D' ? 'W' : 'W'
calc = timeframe.period == '1' ? 5 : timeframe.period == '3' ? 5 : timeframe.period == '5' ? 3 : timeframe.period == '15' ? 4 : timeframe.period == '30' ? 4 : timeframe.period == '45' ? 4 : timeframe.period == '60' ? 4 : timeframe.period == '120' ? 3 : timeframe.period == '180' ? 3 : timeframe.period == '240' ? 6 : timeframe.period == 'D' ? 5 : 1
count() =>
indi = ta.ema(close, fastLength) - ta.ema(close, slowLength)
signal = ta.ema(indi, signalLength)
Anlyse = 0.0
// direction of indi and histogram
hist = indi - signal
Anlyse := indi > indi[1] ? hist > hist[1] ? indiside + histside : hist == hist[1] ? indiside : indiside - histside : 0
Anlyse += (indi < indi[1] ? hist < hist[1] ? -(indiside + histside) : hist == hist[1] ? -indiside : -(indiside - histside) : 0)
Anlyse += (indi == indi[1] ? hist > hist[1] ? histside : hist < hist[1] ? -histside : 0 : 0)
// cross now earlier ?
countcross = indi >= signal and indi[1] < signal[1] ? crossscore : indi <= signal and indi[1] > signal[1] ? -crossscore : 0.
countcross += nz(countcross[1]) * 0.6
Anlyse += countcross
nz(Anlyse)
Anlys = count()
AnlysHfrm = lookaheadi ? request.security(syminfo.tickerid, HTF, count(), lookahead=barmerge.lookahead_on) : request.security(syminfo.tickerid, HTF, count(), lookahead=barmerge.lookahead_off)
Result = (AnlysHfrm * calc + Anlys) / (calc + 1)
longCondition = ta.change(Result) != 0 and Result > 0
if longCondition
strategy.entry('MACD Long', strategy.long,alert_message = 'MACD Long')
shortCondition = ta.change(Result) != 0 and Result < 0
if shortCondition
strategy.entry('MACD Short', strategy.short,alert_message = 'MACD Short')
countstop(pos) =>
Upt = hl2 - Mult * ta.atr(Period)
Dnt = hl2 + Mult * ta.atr(Period)
TUp = 0.
TDown = 0.
TUp := close[1] > TUp[1] ? math.max(Upt, TUp[1]) : Upt
TDown := close[1] < TDown[1] ? math.min(Dnt, TDown[1]) : Dnt
tslmtf = pos == 1 ? TUp : TDown
tslmtf
pos = longCondition ? 1 : -1
stline = 0.
countstop__1 = countstop(pos)
security_1 = request.security(syminfo.tickerid, HTF, countstop__1)
stline := ta.change(time(HTF)) != 0 or longCondition or shortCondition ? security_1 : nz(stline[1])
plot(stline, color=shotsl ? color.rgb(148, 169, 18) : na, style=plot.style_line, linewidth=2, title='Stop Loss')