개요
이 전략은 동적 이동 지표 ((DMI) 를 기반으로 여러 개의 긴 라인 전략을 설계하고, 평균 실제 파장 ((ATR) 과 결합하여 손실 위험을 제어하기 위해 후속 손실을 수행합니다. 추가 최적화를 위해 이 전략은 거래 시간 및 S&P 500 지수의 계절적 필터링 조건을 통합하고 있습니다.
전략 원칙
이 전략은 지정된 거래일 (월요일부터 금요일까지) 과 거래 시간 (현지 시간 9시 30분부터 20시 30분까지) 에만 포지션을 열 수 있습니다.
ADX가 27보다 크면 현재 가격 트렌드 상태임을 나타냅니다. 이 때 +DI 라인이 DI 라인을 통과하면 멀티 신호가 발생한다.
포지션을 개시한 후, ATR의 5.5배로 스톱로스를 설정하고, 스톱 라인은 가격 상승에 따라 올라갈 수 있도록 하여 수익을 보장한다.
선택적으로 스탠퍼드 500 지수의 계절적 규칙을 적용하고, 역사적으로 더 잘하는 시기에만 포지션을 개설한다.
우위 분석
트렌드 지표와 스톱 로드 메커니즘을 결합하여 트렌드를 효과적으로 추적하고 각각의 포지션의 손실을 제어할 수 있습니다.
거래시간과 계절적 필터링 조건을 활용하여 시장의 비정상적인 변동기를 피할 수 있고, 잘못된 보고율을 줄일 수 있다.
DMI와 ATR은 모두 정교한 기술 지표이며, 파라미터를 조정할 수 있으며, 양적 최적화에 적합하다.
위험 분석
DMI 및 ATR 파라미터를 잘못 설정하면 신호가 너무 많거나 너무 적을 수 있다. 테스트를 위해 파라미터를 조정해야 한다.
스톱로스는 불필요한 스톱로스를 크게 설정하고, 작은 스톱로스는 손실을 효과적으로 제어할 수 없다.
거래 시간 및 계절적 규칙은 수익의 일부를 필터링 할 수 있습니다.
최적화 방향
MACD, 브린 띠 등과 같은 다른 지표와 결합하여 기입 및 출전 규칙을 설계할 수 있다.
다른 ATR 곱수 상쇄 방법을 테스트할 수 있으며, 동적으로 상쇄량을 조정하는 것도 고려할 수 있다.
거래 시기를 조정하거나, 계절적 거래의 시작 및 종료 시간을 최적화 할 수 있습니다.
기계 학습 방법을 적용하여 자동 최적화 파라미터를 시도할 수 있다.
요약하다
이 전략은 트렌드 분석과 리스크 제어 기술을 통합하여 트렌드 추적 전략의 급격한 변동 문제를 어느 정도 극복합니다. 동시에 거래 시간 및 계절적 필터를 추가하여 잘못된 신호를 줄일 수 있습니다. 이 전략은 파라미터 조정 및 기능 확장을 통해 더 나은 안정적인 수익을 얻을 수 있습니다.
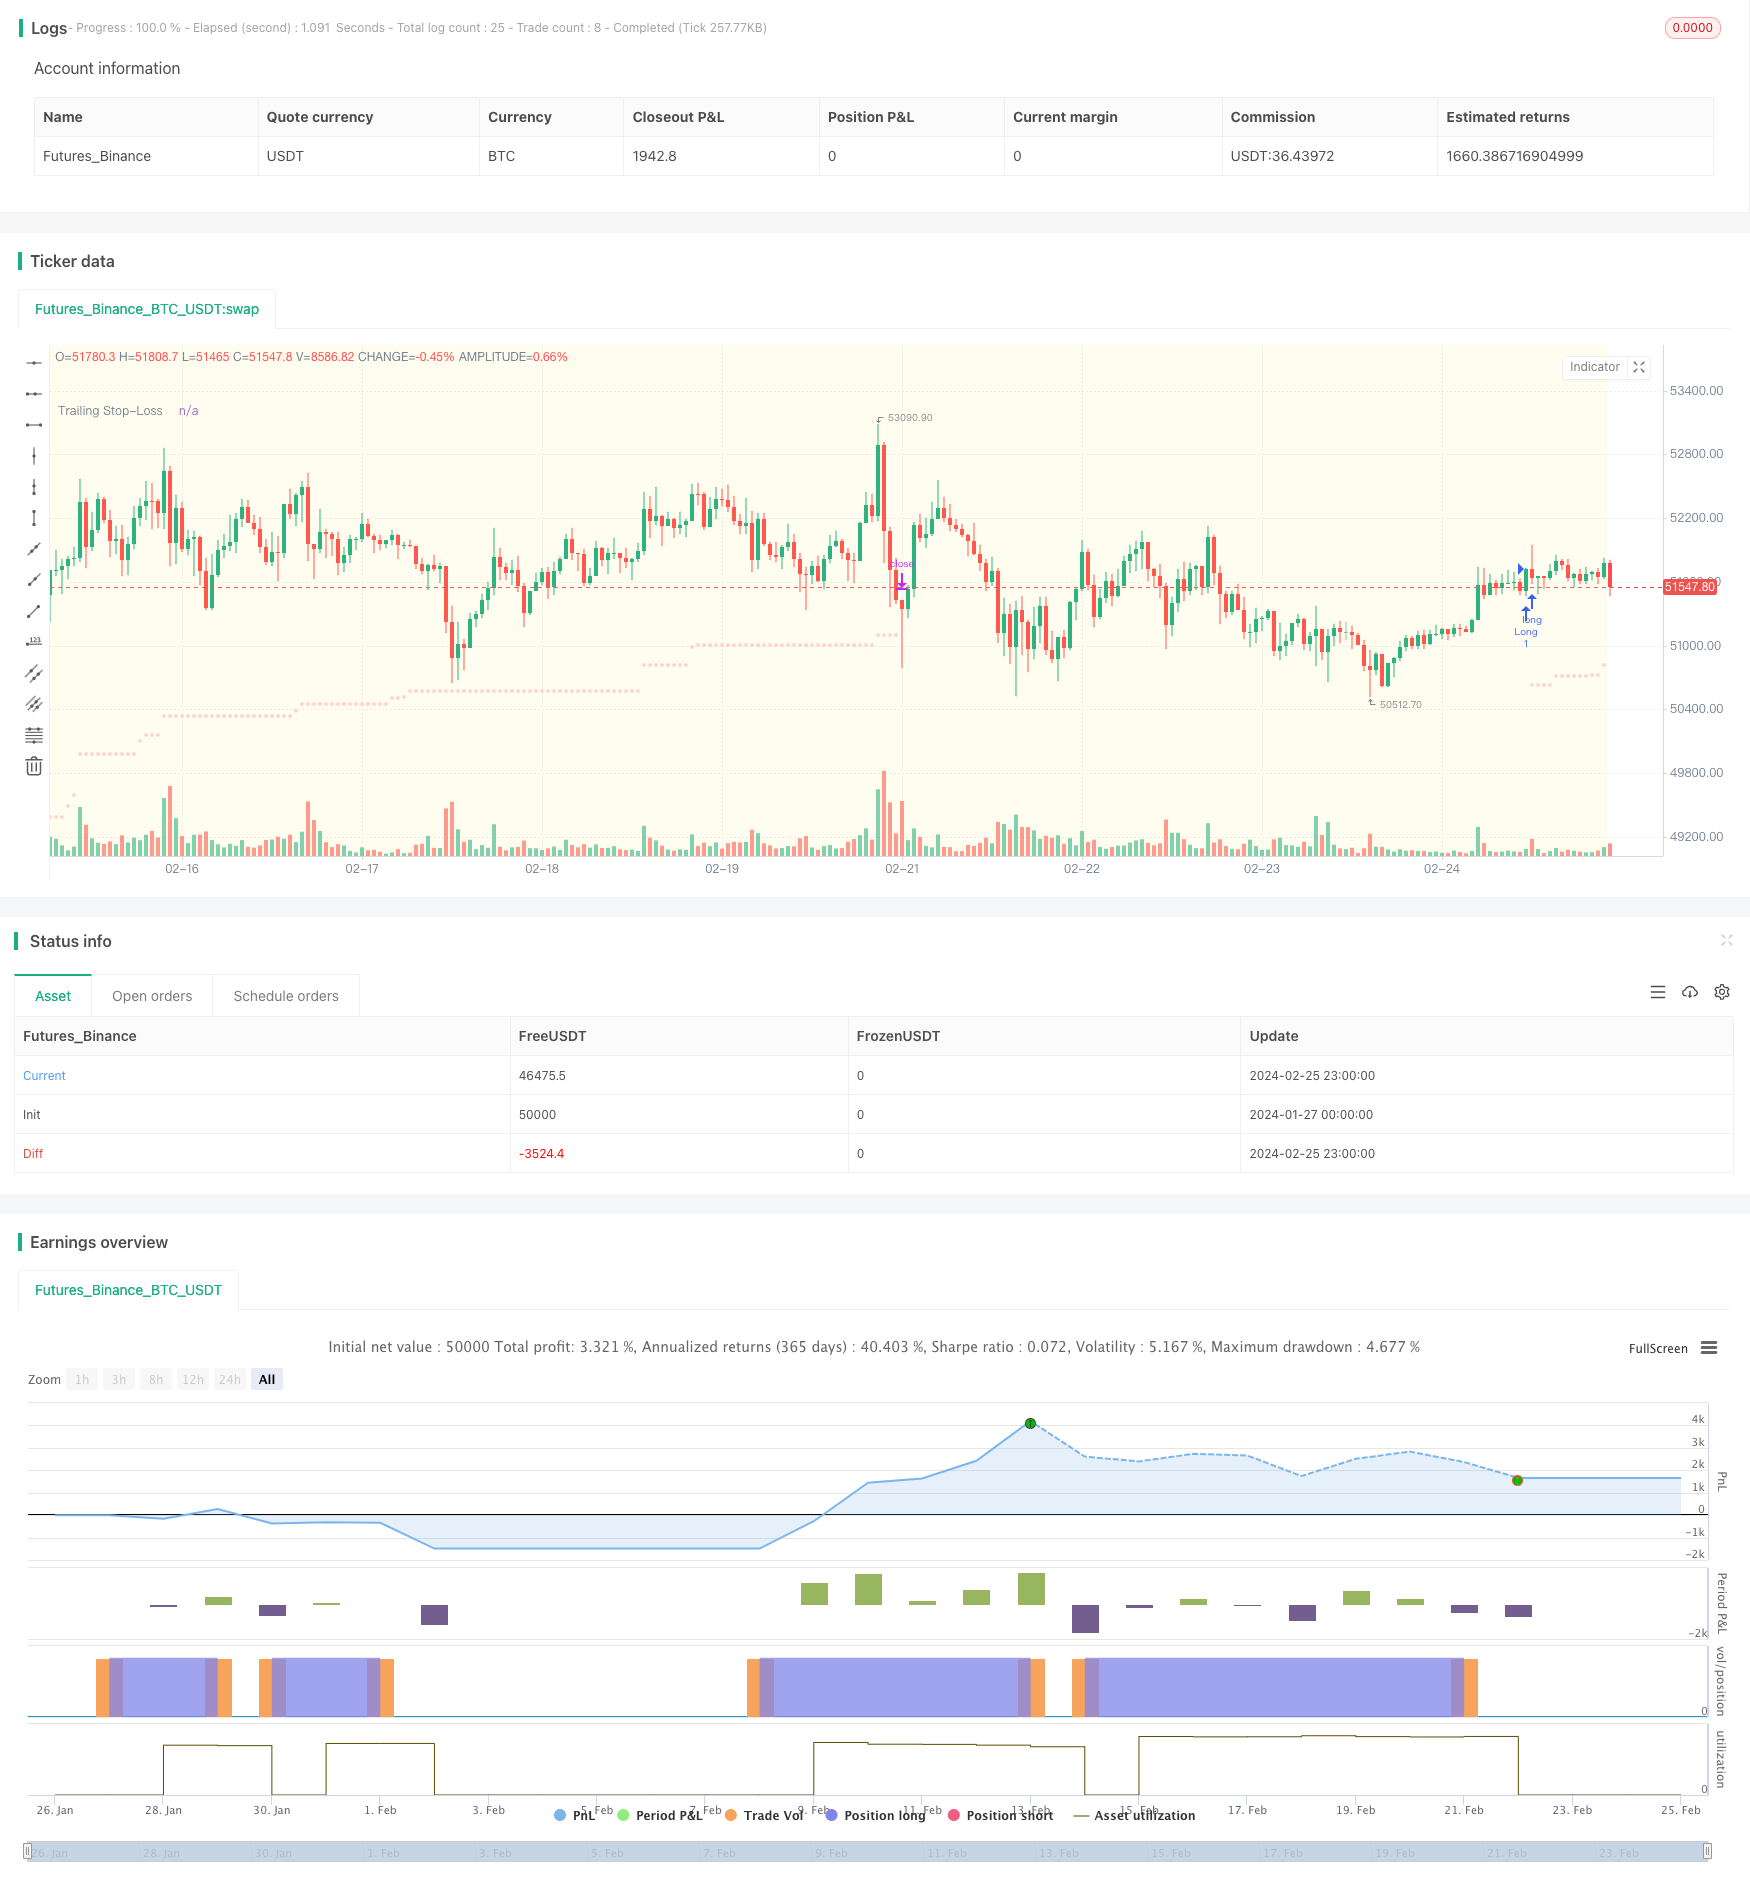
/*backtest
start: 2024-01-27 00:00:00
end: 2024-02-26 00:00:00
period: 1h
basePeriod: 15m
exchanges: [{"eid":"Futures_Binance","currency":"BTC_USDT"}]
*/

//@version=5
strategy(title="DMI Strategy with ADX and ATR-based Trailing SL (Long Only) and Seasonality", shorttitle="MBV-SP500-CLIMBER", overlay=true)

// Eingabeparameter für Long-Positionen
len = input.int(14, minval=1, title="DI Length")
lensig = input.int(14, title="ADX Smoothing", minval=1, maxval=50)
adxLongThreshold = input.float(27.0, title="ADX Threshold for Long", minval=0)
atrLength = input.int(14, title="ATR Length")
atrLongMultiplier = input.float(5.5, title="ATR Multiplier for Trailing SL (Long)")

startTimeHH = input.int(09, title="startTime hh")
startTimeMM = input.int(30, title="startTime mm")

endTimeHH = input.int(20, title="endTime hh")
endTimeMM = input.int(30, title="endTime mm")

// Zeitzone des Nutzers als Eingabeparameter
timezoneOffset = input.int(1, title="Timezone Offset (Hours from UTC)", minval=-12, maxval=14)


// Zusätzliche Einstellung für SP500-Saisonalität
enableSeasonality = input.bool(false, title="Enable SP500 Seasonality")
seasonColor = color.new(color.blue, 90)
activeTimeColor = color.new(color.yellow, 90) // Farbe für aktive Handelszeiten

// Handelstage und -zeiten
tradeMonday = input.bool(true, title="Trade on Monday")
tradeTuesday = input.bool(true, title="Trade on Tuesday")
tradeWednesday = input.bool(true, title="Trade on Wednesday")
tradeThursday = input.bool(true, title="Trade on Thursday")
tradeFriday = input.bool(true, title="Trade on Friday")

// Konvertierung der Uhrzeit in Unix-Zeitstempel
getUnixTime(hour, minute) =>
    adjustedHour = hour - timezoneOffset
    sessionDate = timestamp(year, month, dayofmonth, 0, 0)
    sessionDate + adjustedHour * 60 * 60000 + minute * 60000

// Start- und Endzeit als Unix-Zeitstempel
// + 1 Stunde wegen UTC
startTime = getUnixTime(startTimeHH, startTimeMM)
endTime = getUnixTime(endTimeHH, endTimeMM)


// Überprüfen, ob der aktuelle Zeitpunkt innerhalb der Handelszeit liegt
isTradingTime() => true

// Saisonale Zeiträume definieren
isSeason(time) =>
    m = month(time)
    d = dayofmonth(time)
    (m == 1 and d >= 1) or (m == 2 and d <= 15) or (m == 3 and d >= 23) or (m == 4 and d <= 17) or (m == 5 and d >= 12) or (m == 6 and d >= 27 and d <= 8) or (m == 7 and d <= 29) or (m == 10 and d >= 15) or (m == 11 and d >= 1) or (m == 12 and d <= 2) or (m == 12 and d >= 20 and d <= 27)

// Hintergrundfarbe für saisonale Bereiche und aktive Handelszeiten
bgcolor(enableSeasonality and isSeason(time) ? seasonColor : na)
bgcolor(isTradingTime() ? color.new(activeTimeColor, 90) : na)

// Berechnung von +DM, -DM, ATR
up = ta.change(high)
down = -ta.change(low)
plusDM = na(up) ? na : (up > down and up > 0 ? up : 0)
minusDM = na(down) ? na : (down > up and down > 0 ? down : 0)
trur = ta.rma(ta.tr, len)
atr = ta.atr(atrLength)

// Berechnung von +DI, -DI und ADX
plus = fixnan(100 * ta.rma(plusDM, len) / trur)
minus = fixnan(100 * ta.rma(minusDM, len) / trur)
sum = plus + minus
adx = 100 * ta.rma(math.abs(plus - minus) / (sum == 0 ? 1 : sum), lensig)

// Logik für LONG Signale unter Berücksichtigung der Saisonalität und Zeitfilter
longSignal = ta.crossover(adx, adxLongThreshold) and plus > minus and isTradingTime()
longSignal := longSignal and (not enableSeasonality or (enableSeasonality and isSeason(time)))


// Variable für Trailing Stop-Loss
var float longTrailingSL = na

// Variablen für die Eröffnungszeit und den Eröffnungspreis der Position
var int openBarIndex = na
var float openPrice = na

// Handelslogik für Long-Positionen
// ohne strategy.position_size == 0 gilt die Kondition für ALLE Signale und nicht nur für das erste
if (longSignal and strategy.position_size == 0)
    strategy.entry("Long", strategy.long)
    openBarIndex := bar_index
    openPrice := close
    longTrailingSL := close - atr * atrLongMultiplier

//if (longSignal)
   //longTrailingSL := close - atr * atrLongMultiplier

// Aktualisierung des Trailing Stop-Loss
if strategy.position_size > 0
    longTrailingSL := math.max(longTrailingSL, close - atr * atrLongMultiplier)

// Ausstieg aus Long-Positionen
strategy.exit("Close Long", "Long", stop=longTrailingSL)

// Anzeige des ATR-basierten Trailing Stops für Long-Positionen
//plot(strategy.position_size > 0 ? longTrailingSL : na, color=color.red, title="ATR Trailing Stop Long")

// Anzeige des ATR-basierten Trailing Stops für Long-Positionen
plot(strategy.position_size > 0 ? longTrailingSL : na, color=color.new(color.red, 75), style=plot.style_circles, linewidth=1, title="Trailing Stop-Loss")


// Wenn eine Position geschlossen wird, zeichnen Sie die Linie
// if strategy.position_size[1] > 0 and strategy.position_size == 0
//     lineColor = longTrailingSL > openPrice ? color.new(color.green, 50) : color.new(color.red, 50) // Hellgrün für Gewinne, Hellrot für Verluste
//     line.new(openBarIndex, openPrice, bar_index, longTrailingSL, width=3, color=lineColor)