개요
이 전략은 전형적인 이동평균선 교차전략으로, 동시에 두 개의 평균선, 한 개의 빠른 평균선, 한 개의 느린 평균선을 사용한다. 빠른 평균선 상에서 느린 평균선을 통과할 때 구매 신호를 생성한다. 빠른 평균선 아래에서 느린 평균선을 통과할 때 판매 신호를 생성한다. 이 전략은 동시에 EMA와 SMA 두 가지의 평균선을 사용하며, 두 개의 빠른 느린 평균선을 구성한다. 빠른 평균선은 EMA를 사용하며, 느린 평균선은 SMA를 사용한다.
전략 원칙
이 전략의 주요 논리는 두 개의 빠른 느린 평균선의 교차를 기반으로 입지와 출전의 시간을 판단하는 것이다.
먼저, 두 개의 속속 평균선을 각각 계산해 봅시다.
- 첫 번째 급속한 EMA, 8일
- 두 번째 급속한 EMA, 21일
- 첫 번째 그룹은 느린 SMA로 50일 동안 지속됩니다.
- 2단계 느린 SMA, 200일
그 다음으로, 빠른 EMA가 금포가 되었는지 느린 SMA가 되었는지 판단합니다:
- 만약 8일 EMA가 50일 SMA를 통과한다면
- 만약 8일 EMA 아래에서 50일 SMA를 통과한다면,
가짜 신호를 필터링하기 위해 두 번째 EMA와 SMA의 확인이 추가되었습니다.
- 거래 신호는 21일 EMA가 50일 SMA를 넘거나 넘었을 때만 발송됩니다.
이렇게, 두 개의 조속한 평선 확인을 통해, 많은 가짜 신호를 필터링할 수 있고, 따라서 신호의 신뢰성을 높일 수 있다.
판단이 구매 신호를 생성할 때, 더 많은 입장을 취하고, 판단이 판매 신호를 생성할 때, 공백 입장을 취한다.
또한, 이 전략은 스톱 스톱 손실 논리를 설정한다. 포지션을 보유할 때, 설정된 이득과 손실 비율에 따라 스톱 스톱 및 스톱 손실 가격을 추적한다.
우위 분석
이 전략에는 다음과 같은 장점이 있습니다.
- 쌍평선 조합을 사용하여 가짜 신호를 효과적으로 필터링하여 신호 정확도를 향상시킵니다.
- 최신 가격 변동에 대한 EMA의 민감성과 SMA의 부드러움을 결합한 EMA와 SMA의 조합
- 스톱 스톱 손실을 설정하여 수익을 고정하고 위험을 제어합니다.
- 간단하고 명확한 원리, 이해하기 쉽고 수정할 수 있습니다.
- 사용자 정의 가능한 매개 변수, 다른 시장 환경에 적용
위험 분석
이 전략에는 몇 가지 위험도 있습니다.
- 평평선 전략은 더 많은 흔들림, 작은 이익과 작은 손실을 초래할 수 있습니다.
- 추세가 급격히 변할 경우 더 큰 손실이 발생할 수 있습니다.
- 잘못된 매개 변수 설정은 수익성 저하를 초래할 수 있습니다.
위험을 통제하기 위해, 다음과 같은 것이 권장됩니다.
- 다양한 시장 환경에 적합한 변수 모음
- 응답 결과에 따라 최적화 변수, 전략이 목표 시장에 더 적합하도록
- 단위 손실의 크기를 제어하기 위해 스톱 손실을 설정합니다.
최적화 방향
이 전략은 다음과 같은 부분에서 최적화될 수 있습니다.
- 더 많은 속도와 평균의 조합을 테스트하여 최적의 변수 조합을 찾습니다.
- 기계 학습이나 유전 알고리즘을 사용하여 우수 변수를 자동으로 찾아내는 방법
- 트렌드 판단 지표를 늘리고 역동적인 거래를 피하십시오.
- 이동 상쇄 또는 이동 상쇄를 늘리고 수익을 더 잘 고정합니다.
- 거래량이나 변동성 지표와 결합하여 신호의 신뢰성을 강화
- 다중 전략/다중 품종 조합, 비관계성을 이용한 분산 위험
요약하다
전체적으로, 이 쌍평선 금叉死叉 전략은 빠른 느린 평선의 교차로 거래 신호를 형성하고, 스톱 스톱 손실 제어 위험을 설정하며, 단순하고 직관적이며, 쉽게 구현할 수 있습니다. 이 전략은 시장과 요구에 따라 매개 변수를 최적화 할 수 있으며, 다른 기술 지표 또는 전략 조합과 함께 사용할 수 있으며, 정량 거래에서 매우 실용적입니다.
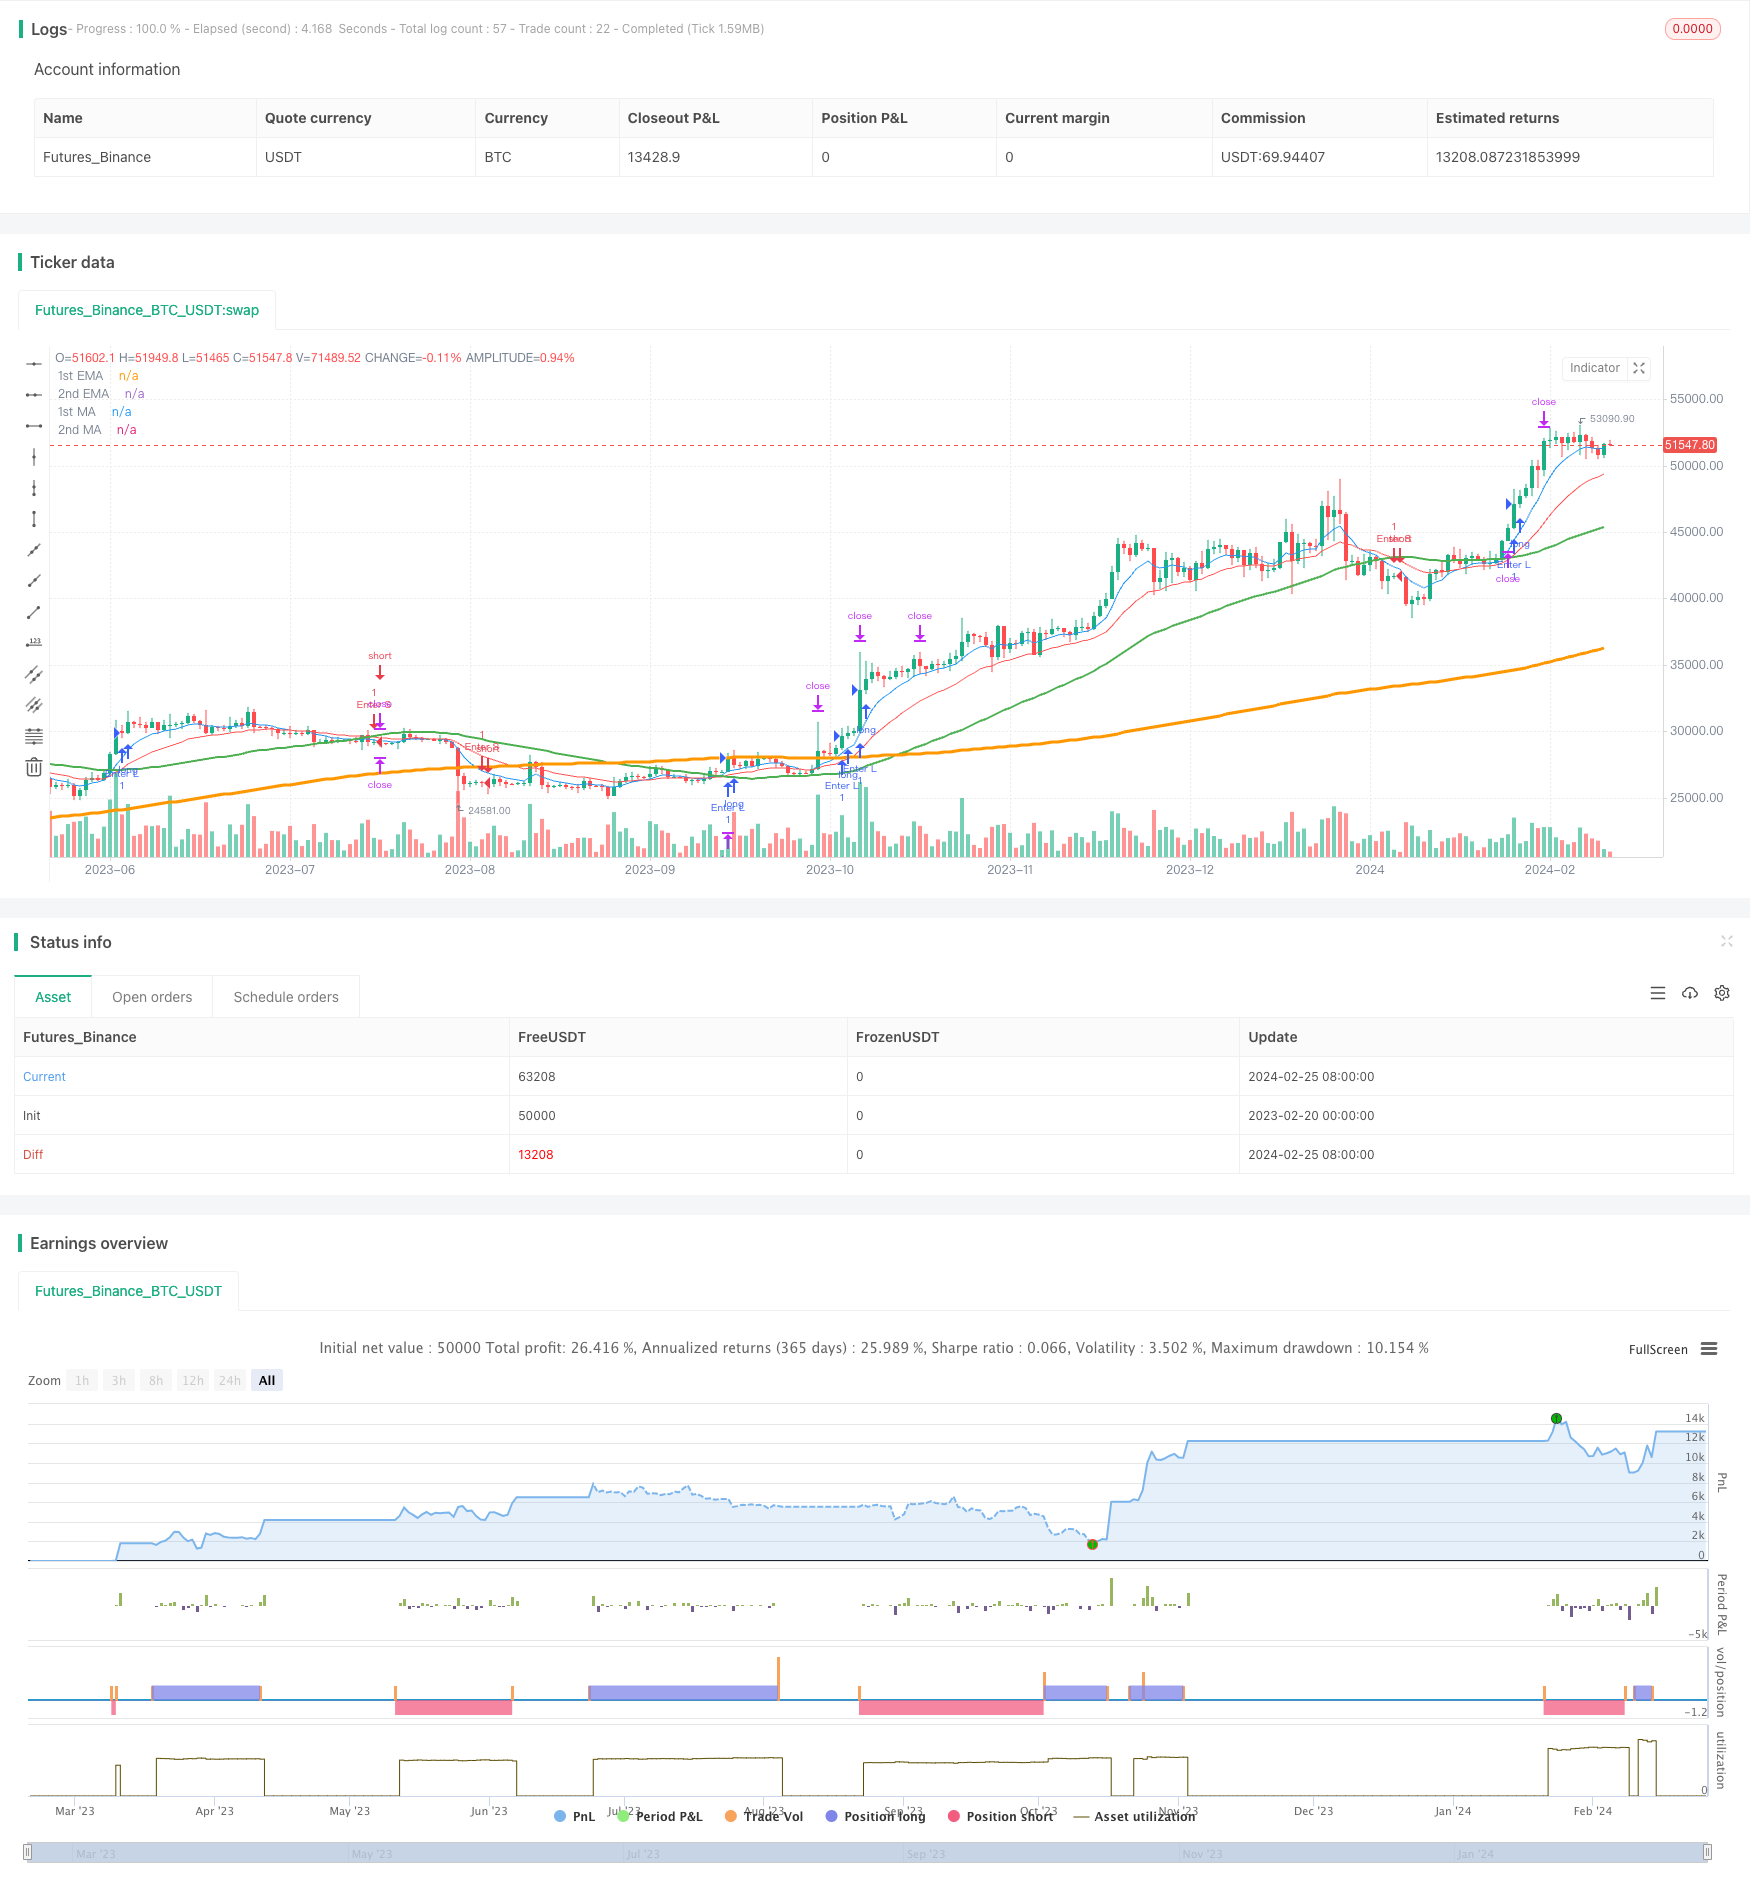
/*backtest
start: 2023-02-20 00:00:00
end: 2024-02-26 00:00:00
period: 1d
basePeriod: 1h
exchanges: [{"eid":"Futures_Binance","currency":"BTC_USDT"}]
*/

// This source code is subject to the terms of the Mozilla Public License 2.0 at https://mozilla.org/MPL/2.0/
// © JMLSlop

//@version=4

src = close
strategy("Crossover moving averages", shorttitle="Cross MA-EMA", overlay=true, calc_on_order_fills=false)

// first fast EMA
len = input(8, "Length", type=input.integer, minval=1)
doma1 = input(true, title="EMA")
out1 = ema(src, len)

//Second fast EMA
len2 = input(21, minval=1, title="Length")
doma2 = input(true, title="EMA")
out2 = ema(src, len2)

//First slow MA
len3 = input(50, minval=1, title="Length")
doma3 = input(true, title="SMA")
out3 = sma(src, len3)

//Second slow MA
len4 = input(200, minval=1, title="Length")
doma4 = input(true, title="SMA")
out4 = sma(src, len4)

// Profit
profit = input(8, "Profit/lost %", type=input.float, minval=1) * 0.01


plot(doma1 and out1 ? out1: na, color=color.blue, linewidth=1, title="1st EMA")
plot(doma2 and out2 ? out2: na, color=color.red, linewidth=1, title="2nd EMA")
plot(doma3 and out3 ? out3: na, color=color.green, linewidth=2, title="1st MA")
plot(doma4 and out4 ? out4: na, color=color.orange, linewidth=3, title="2nd MA")

// Orders config
takeProfitPrice =
     (strategy.position_size > 0) ? strategy.position_avg_price + open*profit : (strategy.position_size < 0) ? strategy.position_avg_price - (open*profit) : na

longStopPrice  = strategy.position_avg_price * (1 - profit)
shortStopPrice = strategy.position_avg_price * (1 + profit)

longCondition2 = (out2>out3 and (crossover(out1, out4) or crossover(out1[1], out4[1]) or crossover(out1[2], out4[2]) or (crossover(out1[3], out4[3]))) or (out2>out3 and (crossover(out1, out3) or crossover(out1[1], out3[1]) or crossover(out1[2], out3[2]) or crossover(out1[3], out3[3]))))
if (longCondition2)
    strategy.entry("Enter L", strategy.long)

shortCondition2 = (out2<out3 and (crossunder(out1, out4) or crossunder(out1[1], out4[1]) or crossunder(out1[2], out4[2]) or crossunder(out1[3], out4[3]))) or (out2<out3 and (crossunder(out1, out3) or crossunder(out1[1], out3[1]) or crossunder(out1[2], out3[2]) or crossunder(out1[3], out3[3])))
if (shortCondition2)
    strategy.entry("Enter S", strategy.short)


if (strategy.position_size > 0)
    strategy.exit("Exit L", limit=takeProfitPrice, stop=longStopPrice)

if (strategy.position_size < 0)
    strategy.exit("Exit S", limit=takeProfitPrice, stop=shortStopPrice)