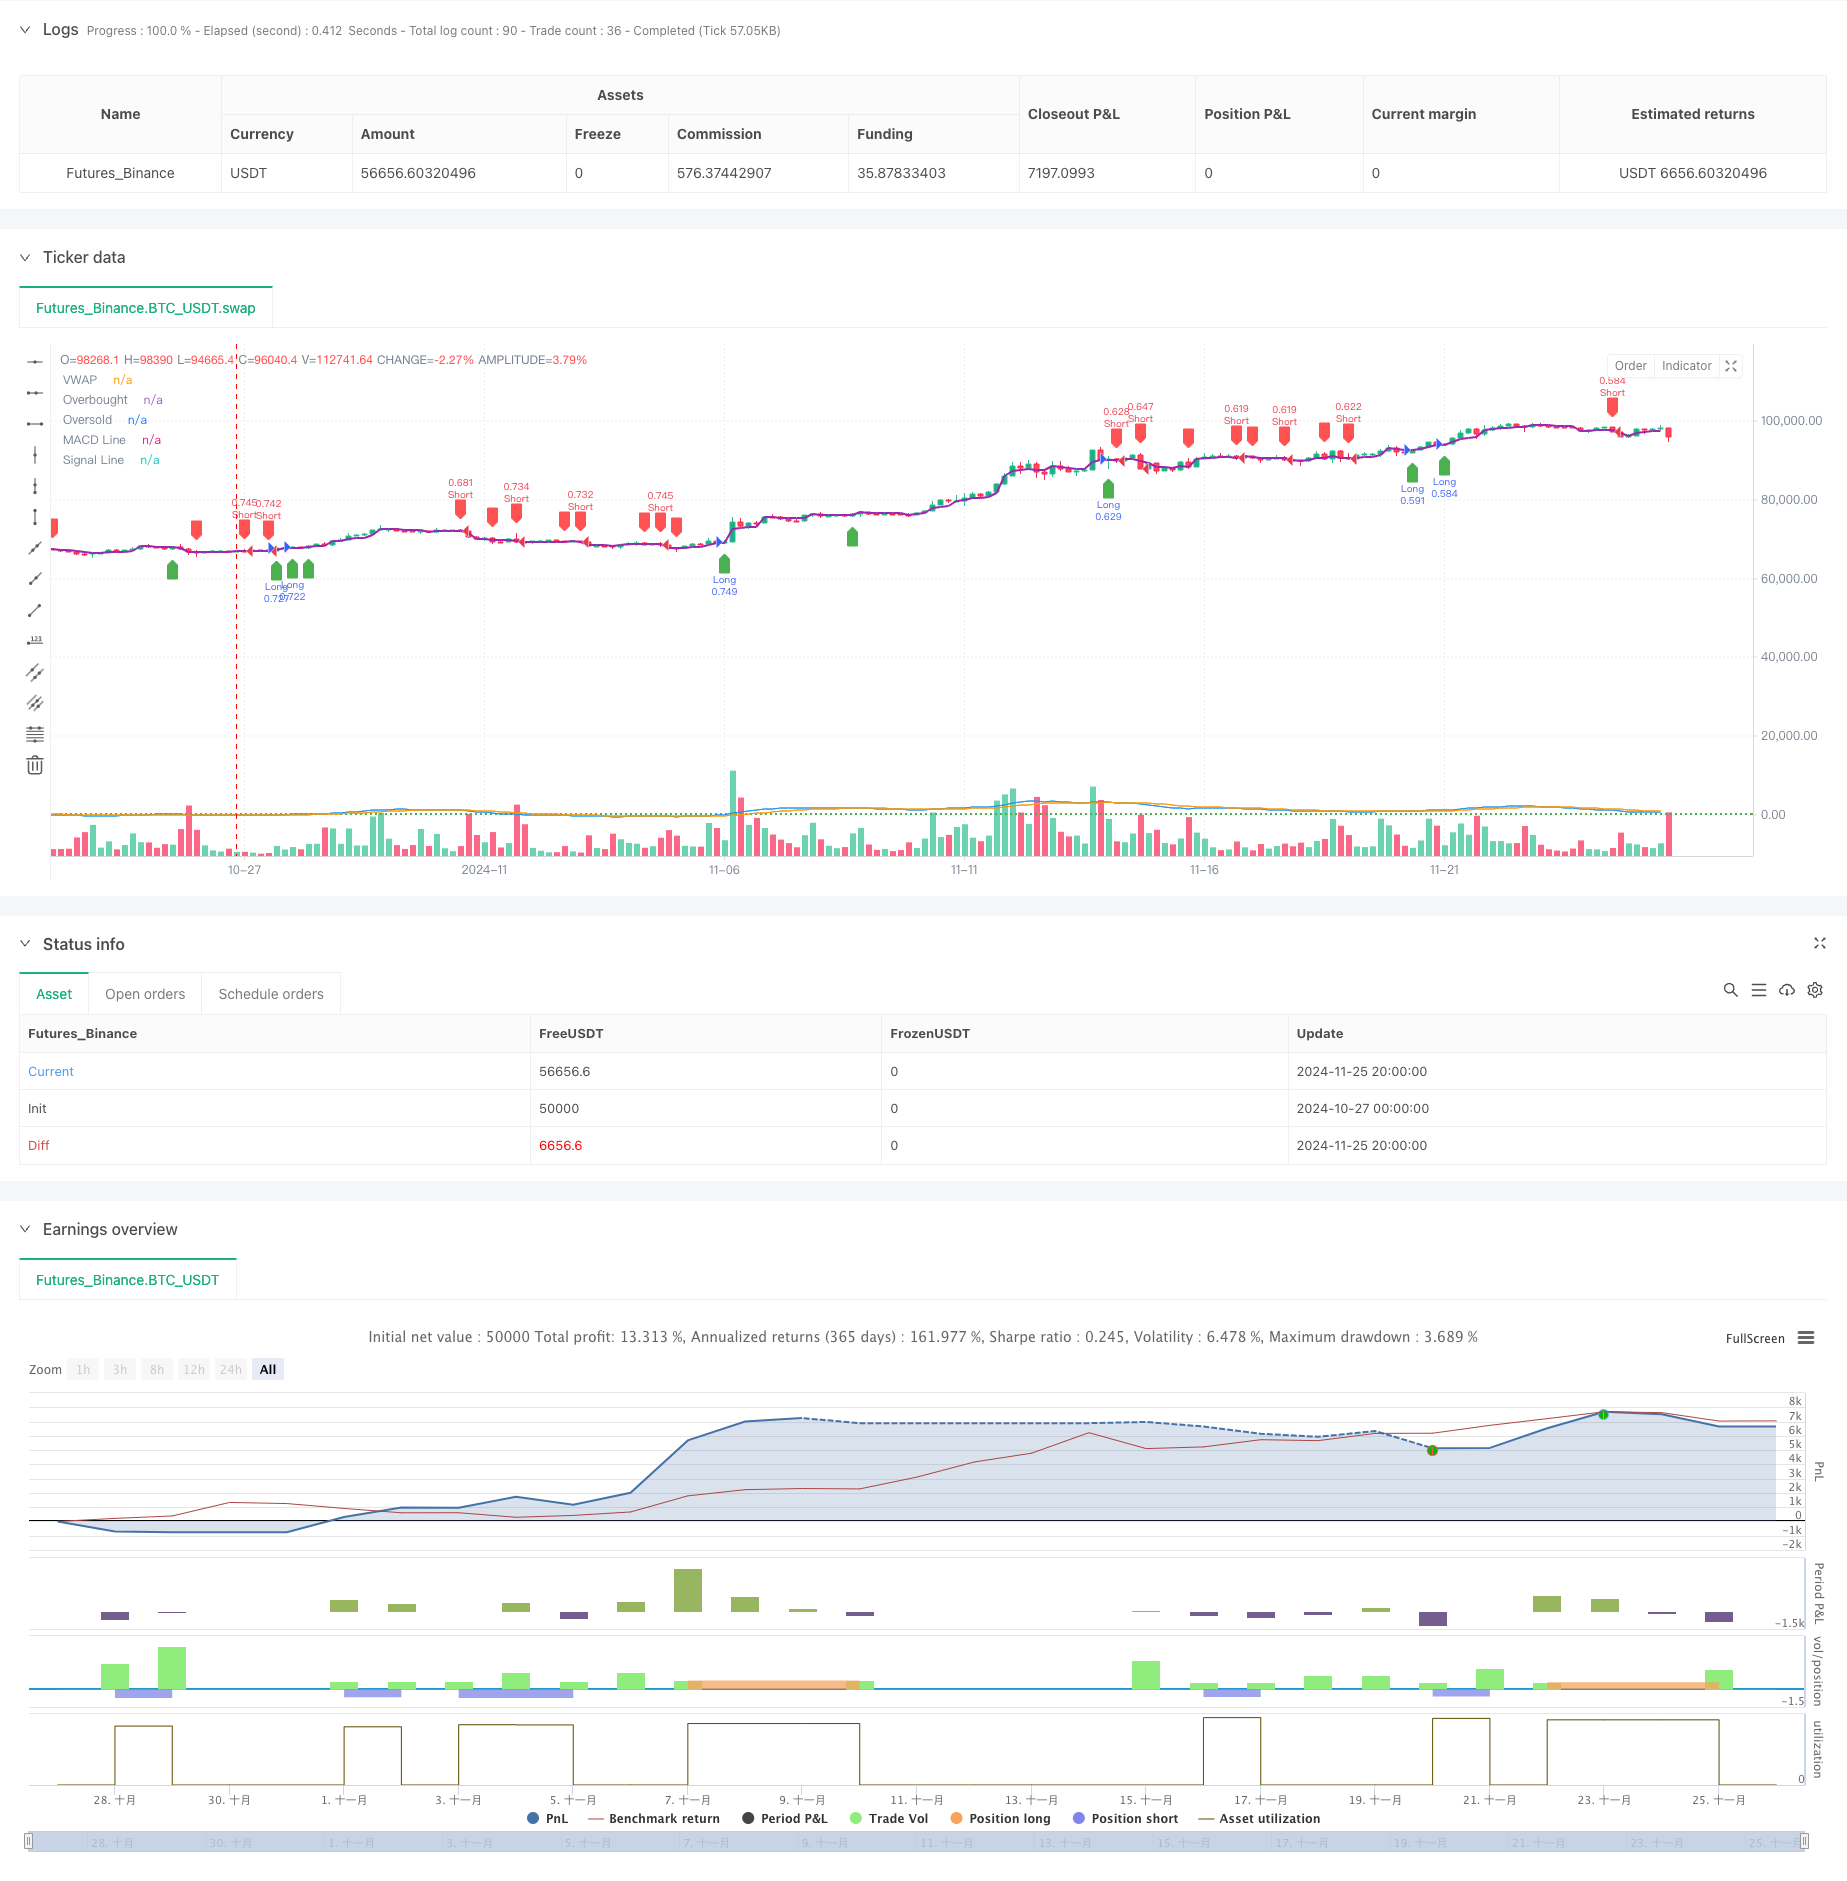
개요
이것은 VWAP, MACD 및 RSI의 삼중 기술 지표에 기반한 양적 거래 전략이다. 이 전략은 VWAP, 이동 평균 동향 분산 지표 (MACD) 및 상대적으로 약한 지표 (RSI) 의 복수의 신호를 결합하여 시장의 매수 기회를 식별한다. 이 전략은 백분율 중지 손실 장치를 사용하여 위험을 관리하고 전략 포지션 관리를 사용하여 자금 사용을 최적화한다.
전략 원칙
이 전략의 핵심 논리는 세 가지 주요 지표에 대한 통합 분석에 기초하고 있습니다.
- VWAP를 주요 트렌드 레퍼런스 라인으로 사용하고, 가격이 VWAP를 뚫을 때 잠재적인 트렌드 전환 신호로 간주
- MACD 기둥 그래프는 트렌드의 강도와 방향을 확인하기 위해 사용되며, 긍정값은 상승 추세를 나타내고, 부정값은 하락 추세를 나타냅니다.
- RSI는 시장이 과매매되거나 과매매되어 있는지 식별하는 데 사용되며, 극단적인 상황에서 입장을 피합니다.
구매 조건은 다음과 같습니다:
- 가격 상승으로 VWAP가 넘어섰다.
- MACD 기둥 그래프는正值
- RSI가 오버 바이를 달성하지 못했습니다.
판매 조건은 다음과 같습니다:
- VWAP가 하락
- MACD 기둥은 마이너스
- RSI가 초매치 수준에 도달하지 않았습니다.
전략적 이점
- 다중 기술 지표 교차 검증, 신호 신뢰성 향상
- VWAP를 통해 거래량 요소를 도입하여 시장의 깊이 분석을 추가합니다.
- RSI를 이용해 극단적인 상황을 필터링하여 가짜 브레이크의 위험을 낮출 수 있습니다.
- %의 스톱 스톱을 사용하여 다양한 가격대에 동적으로 적응합니다.
- 포지션 사이징 (position sizing) 계정 순자치 비율을 기반으로, 동적 포지션 관리를 구현
- 명확하고 이해하기 쉽고 유지하기 쉬운 전략 논리
전략적 위험
- 불안한 시장은 거래의 빈도와 비용을 증가시킬 수 있습니다.
- 복수의 지표로 인해 신호가 지연되어 출입 시기가 영향을 받을 수 있습니다.
- 고정 비율 스톱 로즈는 모든 시장 환경에 적합하지 않을 수 있습니다.
- 시장의 변동성 변화를 고려하지 않고, 높은 변동성 기간 동안 위험을 증가시킬 수 있습니다.
- 트렌드 강도 필터링의 부재로 인해 약한 시장에서 과도한 신호가 발생할 수 있습니다.
전략 최적화 방향
- ATR의 동적 조정 스톱 스톱 손실 폭을 도입하여 시장의 변동에 더 잘 적응합니다.
- 트렌드 강도 필터를 추가하여 흔들리는 시장의 잘못된 신호를 줄여줍니다.
- VWAP 주기 설정을 최적화하여 다주기 VWAP 조합을 고려할 수 있다
- 개통량 확인 메커니즘을 도입하여 뚫림 신호의 신뢰성을 높인다.
- 유동성이 낮은 시기에 거래하는 것을 피하기 위해 시간 필터를 추가하는 것을 고려하십시오.
- 동적으로 조정되는 포지션 사이징 메커니즘, 시장 조건에 따라 포지션 크기를 조정하는
요약하다
이 전략은 VWAP, MACD 및 RSI의 세 가지 클래식 기술 지표를 통합하여 비교적 완전한 거래 시스템을 구축합니다. 전략은 설계에서 신호의 신뢰성 및 위험 관리에 초점을 맞추고, 다중 지표 크로스 검증을 통해 거래 품질을 향상시킵니다. 최적화가 필요한 부분이 있지만, 전체적인 프레임 워크는 합리적이며 확장성이 좋습니다.
전략 소스 코드
/*backtest
start: 2024-10-27 00:00:00
end: 2024-11-26 00:00:00
period: 4h
basePeriod: 4h
exchanges: [{"eid":"Futures_Binance","currency":"BTC_USDT"}]
*/

//@version=5
strategy("pbs", overlay=true, default_qty_type=strategy.percent_of_equity, default_qty_value=100)

// Input for take-profit and stop-loss
takeProfitPercent = input.float(0.5, title="Take Profit (%)", step=0.1) / 100
stopLossPercent = input.float(0.25, title="Stop Loss (%)", step=0.1) / 100


macdFastLength = input.int(12, title="MACD Fast Length")
macdSlowLength = input.int(26, title="MACD Slow Length")
macdSignalLength = input.int(9, title="MACD Signal Length")


rsiLength = input.int(14, title="RSI Length")
rsiOverbought = input.int(70, title="RSI Overbought Level", step=1)
rsiOversold = input.int(30, title="RSI Oversold Level", step=1)


vwap = ta.vwap(close)


[macdLine, signalLine, _] = ta.macd(close, macdFastLength, macdSlowLength, macdSignalLength)
macdHistogram = macdLine - signalLine

rsi = ta.rsi(close, rsiLength)


plot(vwap, color=color.purple, linewidth=2, title="VWAP")
hline(rsiOverbought, "Overbought", color=color.red, linestyle=hline.style_dotted)
hline(rsiOversold, "Oversold", color=color.green, linestyle=hline.style_dotted)
plot(macdLine, color=color.blue, title="MACD Line")
plot(signalLine, color=color.orange, title="Signal Line")

// Buy Condition
longCondition = ta.crossover(close, vwap) and macdHistogram > 0 and rsi < rsiOverbought

// Sell Condition
shortCondition = ta.crossunder(close, vwap) and macdHistogram < 0 and rsi > rsiOversold

// Execute trades based on conditions
if (longCondition)
    strategy.entry("Long", strategy.long)
    strategy.exit("Take Profit/Stop Loss", "Long", limit=close * (1 + takeProfitPercent), stop=close * (1 - stopLossPercent))

if (shortCondition)
    strategy.entry("Short", strategy.short)
    strategy.exit("Take Profit/Stop Loss", "Short", limit=close * (1 - takeProfitPercent), stop=close * (1 + stopLossPercent))

// Plot Buy/Sell Signals
plotshape(series=longCondition, location=location.belowbar, color=color.green, style=shape.labelup, title="Buy Signal")
plotshape(series=shortCondition, location=location.abovebar, color=color.red, style=shape.labeldown, title="Sell Signal")