개요
이 전략은 9일과 20일 지수 이동 평균 ((EMA) 교차 신호에 기반한 트렌드 추적 거래 시스템이다. 빠른 EMA ((9일) 와 느린 EMA ((20일) 의 교차 관계를 모니터링하여 시장 트렌드 전환 시점을 포착한다. 이 전략은 프로그래밍 된 거래 방식을 채택하고 완전히 자동화 된 운영을 구현하여 인간의 감정적 간섭을 효과적으로 피할 수 있습니다.
전략 원칙
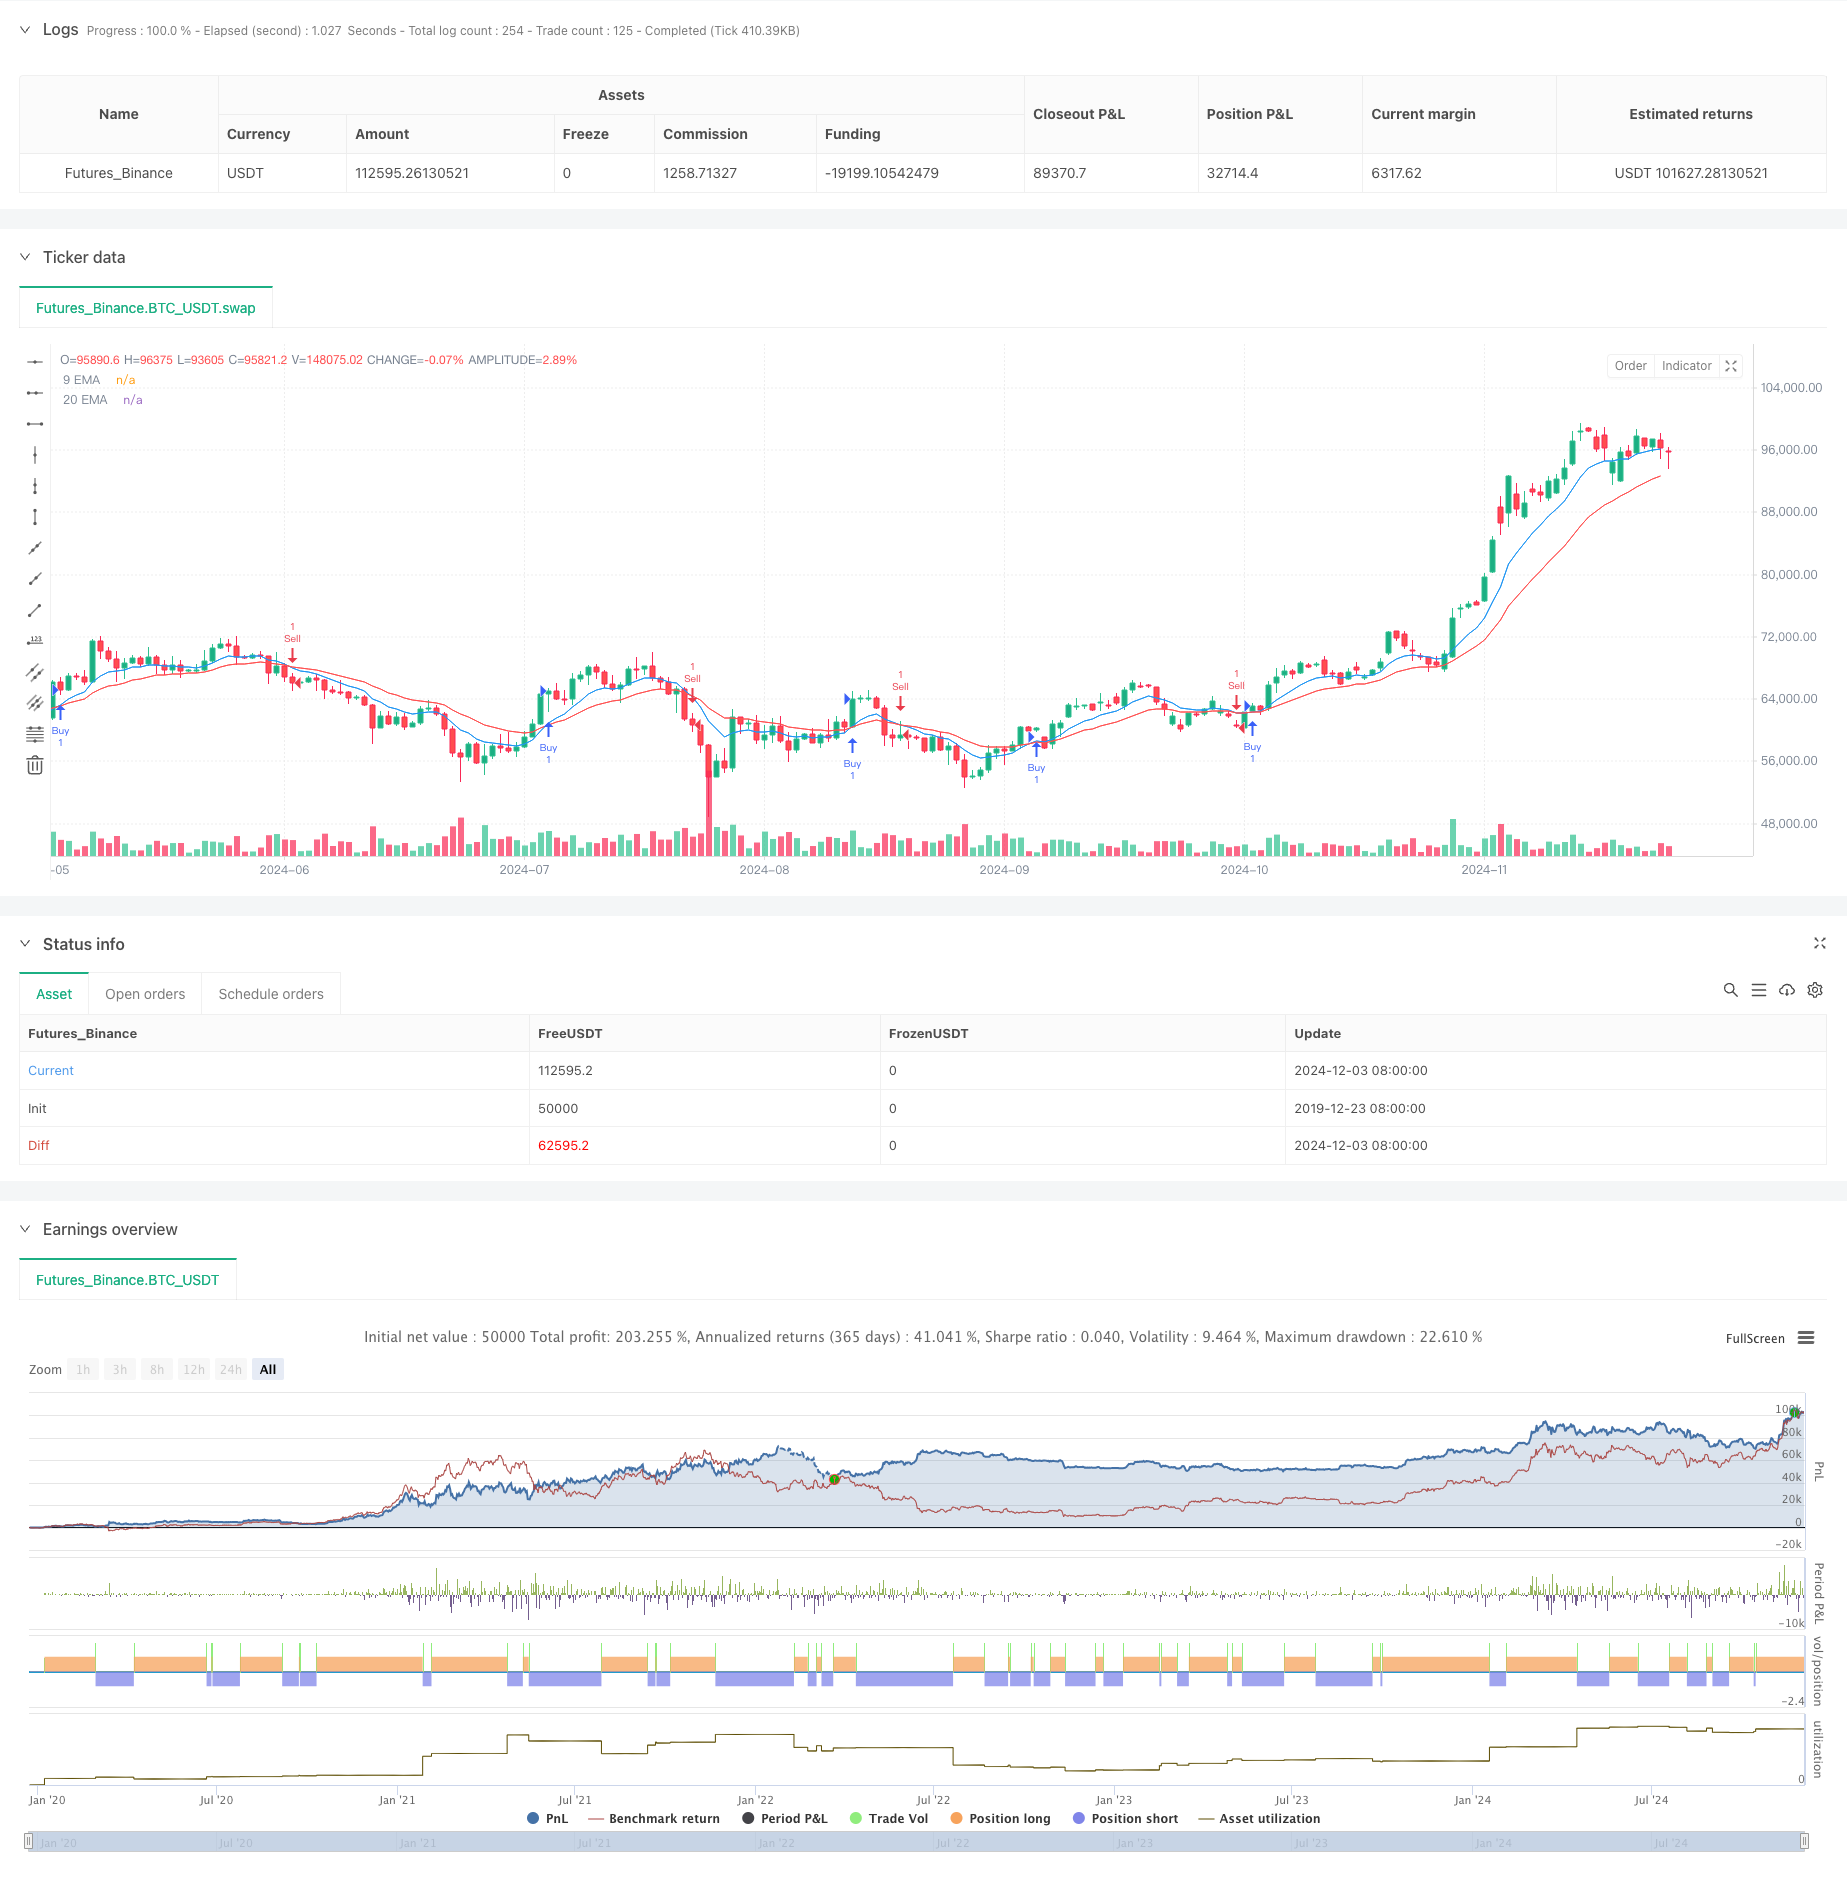
전략의 핵심은 두 개의 다른 주기의 지수 이동 평균을 사용하여 트렌드 방향과 전환점을 식별하는 것입니다. 9일 EMA가 상향으로 20일 EMA를 통과했을 때, 시스템은 여러 신호를 냅니다. 9일 EMA가 하향으로 20일 EMA를 통과했을 때, 시스템은 빈 신호를 냅니다. 지수 이동 평균은 최신 가격에 더 큰 무게를 부여하고, 가격 변화에 더 빨리 반응하여 트렌드 전환 시점을 파악하는 데 도움이됩니다.
전략적 이점
- 운영 규칙이 명확하고, 완전히 절차에 따라 실행되며, 감정적 인 간섭을 피합니다.
- 지수 이동 평균을 사용하여 시장 변화에 민감합니다.
- 트레이드 상기 기능이 설정되어 거래자에게 알릴 수 있습니다.
- 코드 구조가 명확하고 유지 관리 및 최적화가 쉽습니다.
- 다른 시장과 시간대에 적용할 수 있습니다.
- 강력한 트렌드 추적 능력
전략적 위험
- 위기시장에서 빈번하게 잘못된 신호가 발생할 수 있습니다.
- 출입시간이 약간 늦어질 수 있습니다.
- 손해 방지 및 차단 장치가 설정되지 않았습니다.
- 거래비용을 고려하지 않고
- 시장의 급격한 변동으로 인해 부진할 수 있습니다.
- 자금 관리에 주의해야 합니다.
전략 최적화 방향
- 손해 방지 장치가 추가되어 위험을 통제합니다.
- 신호 신뢰성을 높이기 위해 교통량 지표를 도입
- 트렌드 필터를 추가하여 위축 시장의 가짜 신호를 줄여줍니다.
- EMA 파라미터를 최적화하여 전략 적응력을 향상시킵니다.
- 변동성 지표에 추가하여 거래 시기를 최적화합니다.
- 포지션 관리 모듈을 설계하여 수익 위험 비율을 향상시킵니다.
요약하다
이 전략은 클래식 트렌드 추적 시스템으로, EMA를 통해 트렌드 전환 기회를 잡습니다. 전략 논리는 간단하고 명확하며 이해하기 쉽고 실행이 쉽습니다. 그러나 실장 거래에서는 다른 기술 지표와 자금 관리 방법을 결합하여 거래 시스템을 더 개선하는 것이 좋습니다. 동시에, 다양한 시장 특성에 따라 매개 변수를 최적화하면 전략의 실용성을 향상시킬 수 있습니다.
전략 소스 코드
/*backtest
start: 2019-12-23 08:00:00
end: 2024-12-04 00:00:00
period: 1d
basePeriod: 1d
exchanges: [{"eid":"Futures_Binance","currency":"BTC_USDT"}]
*/

//@version=5
strategy("EMA Crossover Strategy with Buttons", overlay=true)

// Input parameters for EMAs
shortEmaLength = input(9, title="Short EMA Length")
longEmaLength = input(20, title="Long EMA Length")

// Calculate EMAs
shortEma = ta.ema(close, shortEmaLength)
longEma = ta.ema(close, longEmaLength)

// Plot EMAs
plot(shortEma, color=color.blue, title="9 EMA")
plot(longEma, color=color.red, title="20 EMA")

// Buy and Sell Logic
longCondition = ta.crossover(shortEma, longEma)
shortCondition = ta.crossunder(shortEma, longEma)

// Buy Button
if (ta.change(longCondition))
    if (longCondition)
        strategy.entry("Buy", strategy.long)

// Sell Button
if (ta.change(shortCondition))
    if (shortCondition)
        strategy.entry("Sell", strategy.short)

// Alert Conditions
alertcondition(longCondition, title="Buy Alert", message="Buy Signal")
alertcondition(shortCondition, title="Sell Alert", message="Sell Signal")