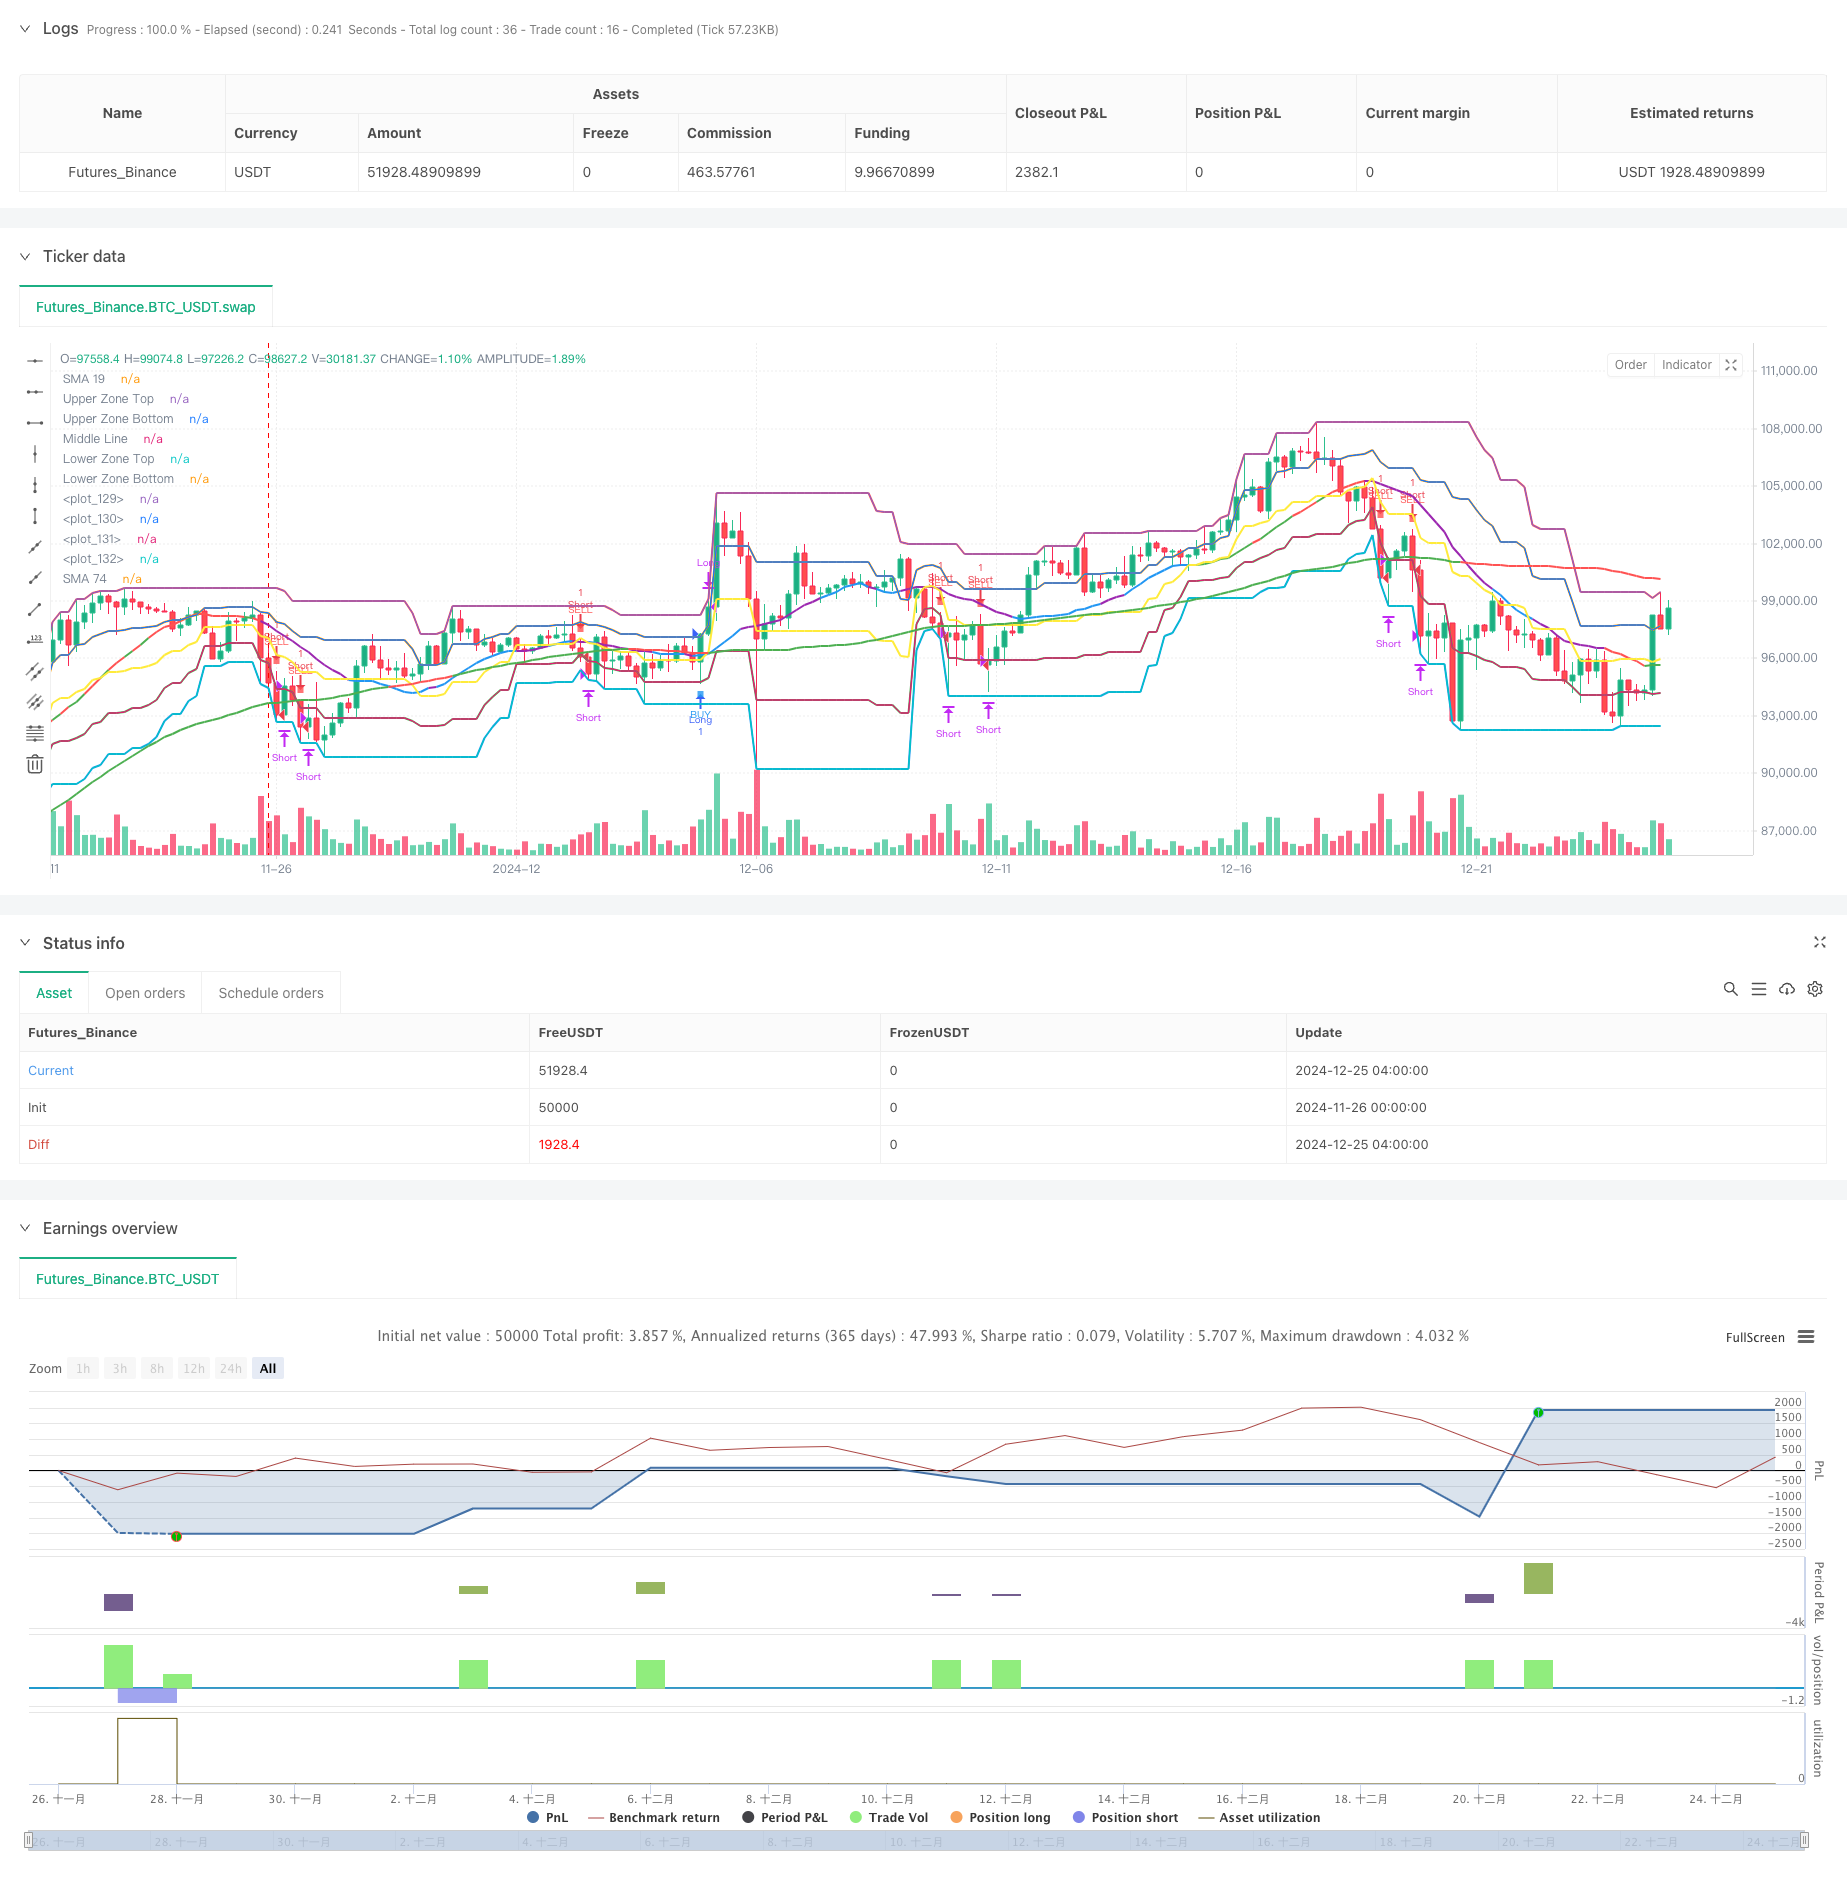
개요
이 전략은 다중 이동 평균 ((SMA) 과 무작위 지표 ((KDJ) 를 결합한 트렌드 추적 거래 시스템이다. 가격 범위와 트렌드 판단 조건을 설정하여 시장 추세가 명확할 때 거래한다. 전략은 동적 중지 손실 메커니즘을 채택하고, 시장 움직임에 따라 포지션 관리를 조정하여 이익을 보호하고 조기 퇴출하지 않는다.
전략 원칙
이 전략은 다음과 같은 핵심 구성 요소를 기반으로 합니다.
- 쌍평선 시스템: 19주기 및 74주기 SMA를 트렌드 판단 도구로 사용
- 가격 범위: 시장의 강점을 판단하기 위해 가격 범위를 5 단계로 나눈다.
- 무작위 지표: 60주기 무작위 지표를 사용하여 과매매 판단
- 트렌드 확인: 3개의 연속적인 K 선의 움직임을 통해 트렌드의 지속성을 판단한다.
- 진입 조건: 가격이 74주기 SMA를 뚫고 해당 가격 범위에 위치할 때 진입
- 손해 차단 메커니즘: 트렌드 변화 시 적시에 퇴출하기 위한 추적 손해 차단
전략적 이점
- 시스템 완전성: 트렌드 추적과 동력 지표가 결합되어 전체적인 시장 분석을 제공합니다.
- 위험 관리: 하드 스톱 및 추적 스톱을 포함한 다중 스톱 메커니즘
- 적응력: 매개 변수를 조정하여 다양한 시장 환경에 적응할 수 있습니다.
- 트렌드 파악: 중·장기 트렌드를 효과적으로 파악하고 잘못된 신호를 피하는 방법
- 포지션 관리: 시장 상황에 따라 포지션을 조정하여 자금 사용 효율을 높인다.
전략적 위험
- 위기 시장 위험: 수평 시장에서 거래가 자주 발생할 수 있습니다.
- 미끄러지 위험: 빠른 시점에 큰 미끄러짐이 발생할 수 있다.
- 매개변수 민감도: 매개변수 조합이 다양하면 전략 성능에 큰 차이가 생길 수 있습니다.
- 시장 환경 의존성: 전략이 트렌드가 뚜렷한 시장에서 더 잘 작동한다
- 자금 관리 위험: 풀 포지션 운영은 더 큰 인출 위험을 초래할 수 있습니다.
전략 최적화 방향
- 변동률 지표를 도입: ATR 지표를 추가하여 스톱 포지션을 동적으로 조정하는 것을 고려하십시오.
- 입학 시간을 최적화: 입학 정확성을 높이기 위해 수송 수를 추가할 수 있습니다.
- 자금 관리를 개선: 포지션 관리 모듈을 추가하여 위험에 따라 포지션을 조정하는 것이 좋습니다.
- 시장 환경 판단을 높여: 트렌드 강도 지표를 추가하여 거래 신호를 필터링 할 수 있습니다.
- 손해제도 개선: 유연성을 높이기 위해 비율 추적 손해제도를 고려할 수 있습니다.
요약하다
이 전략은 다중 기술 지표를 결합하여 전체적인 거래 시스템을 구축하고, 좋은 트렌드 추적 능력과 위험 관리 메커니즘을 갖추고 있다. 일부 시장 환경에서 도전을 받을 수 있지만, 지속적인 최적화 및 개선으로 전략은 다양한 시장 환경에서 안정적인 성능을 유지할 수 있을 것으로 전망된다. 거래자는 실내에서 사용 할 때 포지션을 제어하고, 합리적인 스톱로스를 설정하고, 시장 상황에 따라 적절한 파라미터를 조정할 것을 권장한다.
전략 소스 코드
/*backtest
start: 2024-11-26 00:00:00
end: 2024-12-25 08:00:00
period: 4h
basePeriod: 4h
exchanges: [{"eid":"Futures_Binance","currency":"BTC_USDT"}]
*/

//@version=5
strategy("Purple SMA Strategy", overlay=true)

// === INPUTS ===
zoneLength = input.int(20, "Price Zone Length", minval=5)
tickSize = input.float(1.0, "Tick Size for Hard Stop")
hardStopTicks = input.int(50, "Hard Stop Loss in Ticks")

// === CALCULATE ZONES ===
h = ta.highest(high, zoneLength)
l = ta.lowest(low, zoneLength)
priceRange = h - l
lvl5 = h
lvl4 = l + (priceRange * 0.75)  // Orange line
lvl3 = l + (priceRange * 0.50)  // Yellow line
lvl2 = l + (priceRange * 0.25)  // Green line
lvl1 = l

// === INDICATORS ===
sma19 = ta.sma(close, 19)
sma74 = ta.sma(close, 74)

// === CANDLE COLOR CONDITIONS ===
isGreenCandle = close > open
isRedCandle = close < open

// === CONTINUOUS TREND DETECTION ===
isThreeGreenCandles = close > open and close[1] > open[1] and close[2] > open[2]
isThreeRedCandles = close < open and close[1] < open[1] and close[2] < open[2]

var bool inGreenTrend = false
var bool inRedTrend = false

// Update trends
if isThreeGreenCandles
    inGreenTrend := true
    inRedTrend := false
if isThreeRedCandles
    inRedTrend := true
    inGreenTrend := false
if (inGreenTrend and isRedCandle) or (inRedTrend and isGreenCandle)
    inGreenTrend := false
    inRedTrend := false

// === STOCHASTIC CONDITIONS ===
k = ta.stoch(close, high, low, 60)
d = ta.sma(k, 10)
isOverbought = d >= 80
isOversold = d <= 20
stochUp = d > d[1]
stochDown = d < d[1]

// === SMA COLOR LOGIC ===
sma19Color = if isOverbought and stochUp
    color.green
else if isOverbought and stochDown
    color.red
else if isOversold and stochUp
    color.green
else if isOversold and stochDown
    color.red
else if stochUp
    color.blue
else if stochDown
    color.purple
else
    color.gray

sma74Color = sma74 < sma19 ? color.green : color.red

// === CROSSING CONDITIONS ===
crossUpSMA = ta.crossover(close, sma74)
crossDownSMA = ta.crossunder(close, sma74)

// === ENTRY CONDITIONS ===
buyCondition = crossUpSMA and close > lvl4
sellCondition = crossDownSMA and close < lvl2

// === POSITION MANAGEMENT ===
var float stopLevel = na
var bool xMode = false

// Entry and Stop Loss
if buyCondition
    strategy.entry(id="Long", direction=strategy.long)
    stopLevel := close - (hardStopTicks * tickSize)
    xMode := false

if sellCondition
    strategy.entry(id="Short", direction=strategy.short)
    stopLevel := close + (hardStopTicks * tickSize)
    xMode := false

// Update stops based on X's
if strategy.position_size != 0 and (inGreenTrend or inRedTrend)
    xMode := true
    if strategy.position_size > 0  // Long position
        stopLevel := low
    else  // Short position
        stopLevel := high

// Exit logic
if strategy.position_size > 0  // Long position
    if low <= stopLevel
        strategy.close(id="Long")
    else if xMode and not (inGreenTrend or inRedTrend)
        strategy.close(id="Long")

if strategy.position_size < 0  // Short position
    if high >= stopLevel
        strategy.close(id="Short")
    else if xMode and not (inGreenTrend or inRedTrend)
        strategy.close(id="Short")

// === PLOTTING ===
plot(sma19, "SMA 19", color=sma19Color, linewidth=2)
plot(sma74, "SMA 74", color=sma74Color, linewidth=2)
plot(lvl5, "Upper Zone Top", color=color.red, linewidth=2)
plot(lvl4, "Upper Zone Bottom", color=color.orange, linewidth=2)
plot(lvl3, "Middle Line", color=color.yellow, linewidth=2)
plot(lvl2, "Lower Zone Top", color=color.green, linewidth=2)
plot(lvl1, "Lower Zone Bottom", color=color.blue, linewidth=2)

// Plot X signals
plotshape(inGreenTrend, title="Bullish Line", style=shape.xcross, location=location.belowbar, color=color.white, size=size.tiny)
plotshape(inRedTrend, title="Bearish Line", style=shape.xcross, location=location.abovebar, color=color.white, size=size.tiny)

// Zone fills
var p1 = plot(lvl5, display=display.none)
var p2 = plot(lvl4, display=display.none)
var p3 = plot(lvl2, display=display.none)
var p4 = plot(lvl1, display=display.none)
fill(p1, p2, color=color.new(color.red, 90))
fill(p3, p4, color=color.new(color.green, 90))

// Plot entry signals
plotshape(buyCondition, title="Buy", style=shape.square, location=location.belowbar, color=color.new(color.blue, 20), size=size.tiny, text="BUY", textcolor=color.blue)
plotshape(sellCondition, title="Sell", style=shape.square, location=location.abovebar, color=color.new(color.red, 20), size=size.tiny, text="SELL", textcolor=color.red)