개요
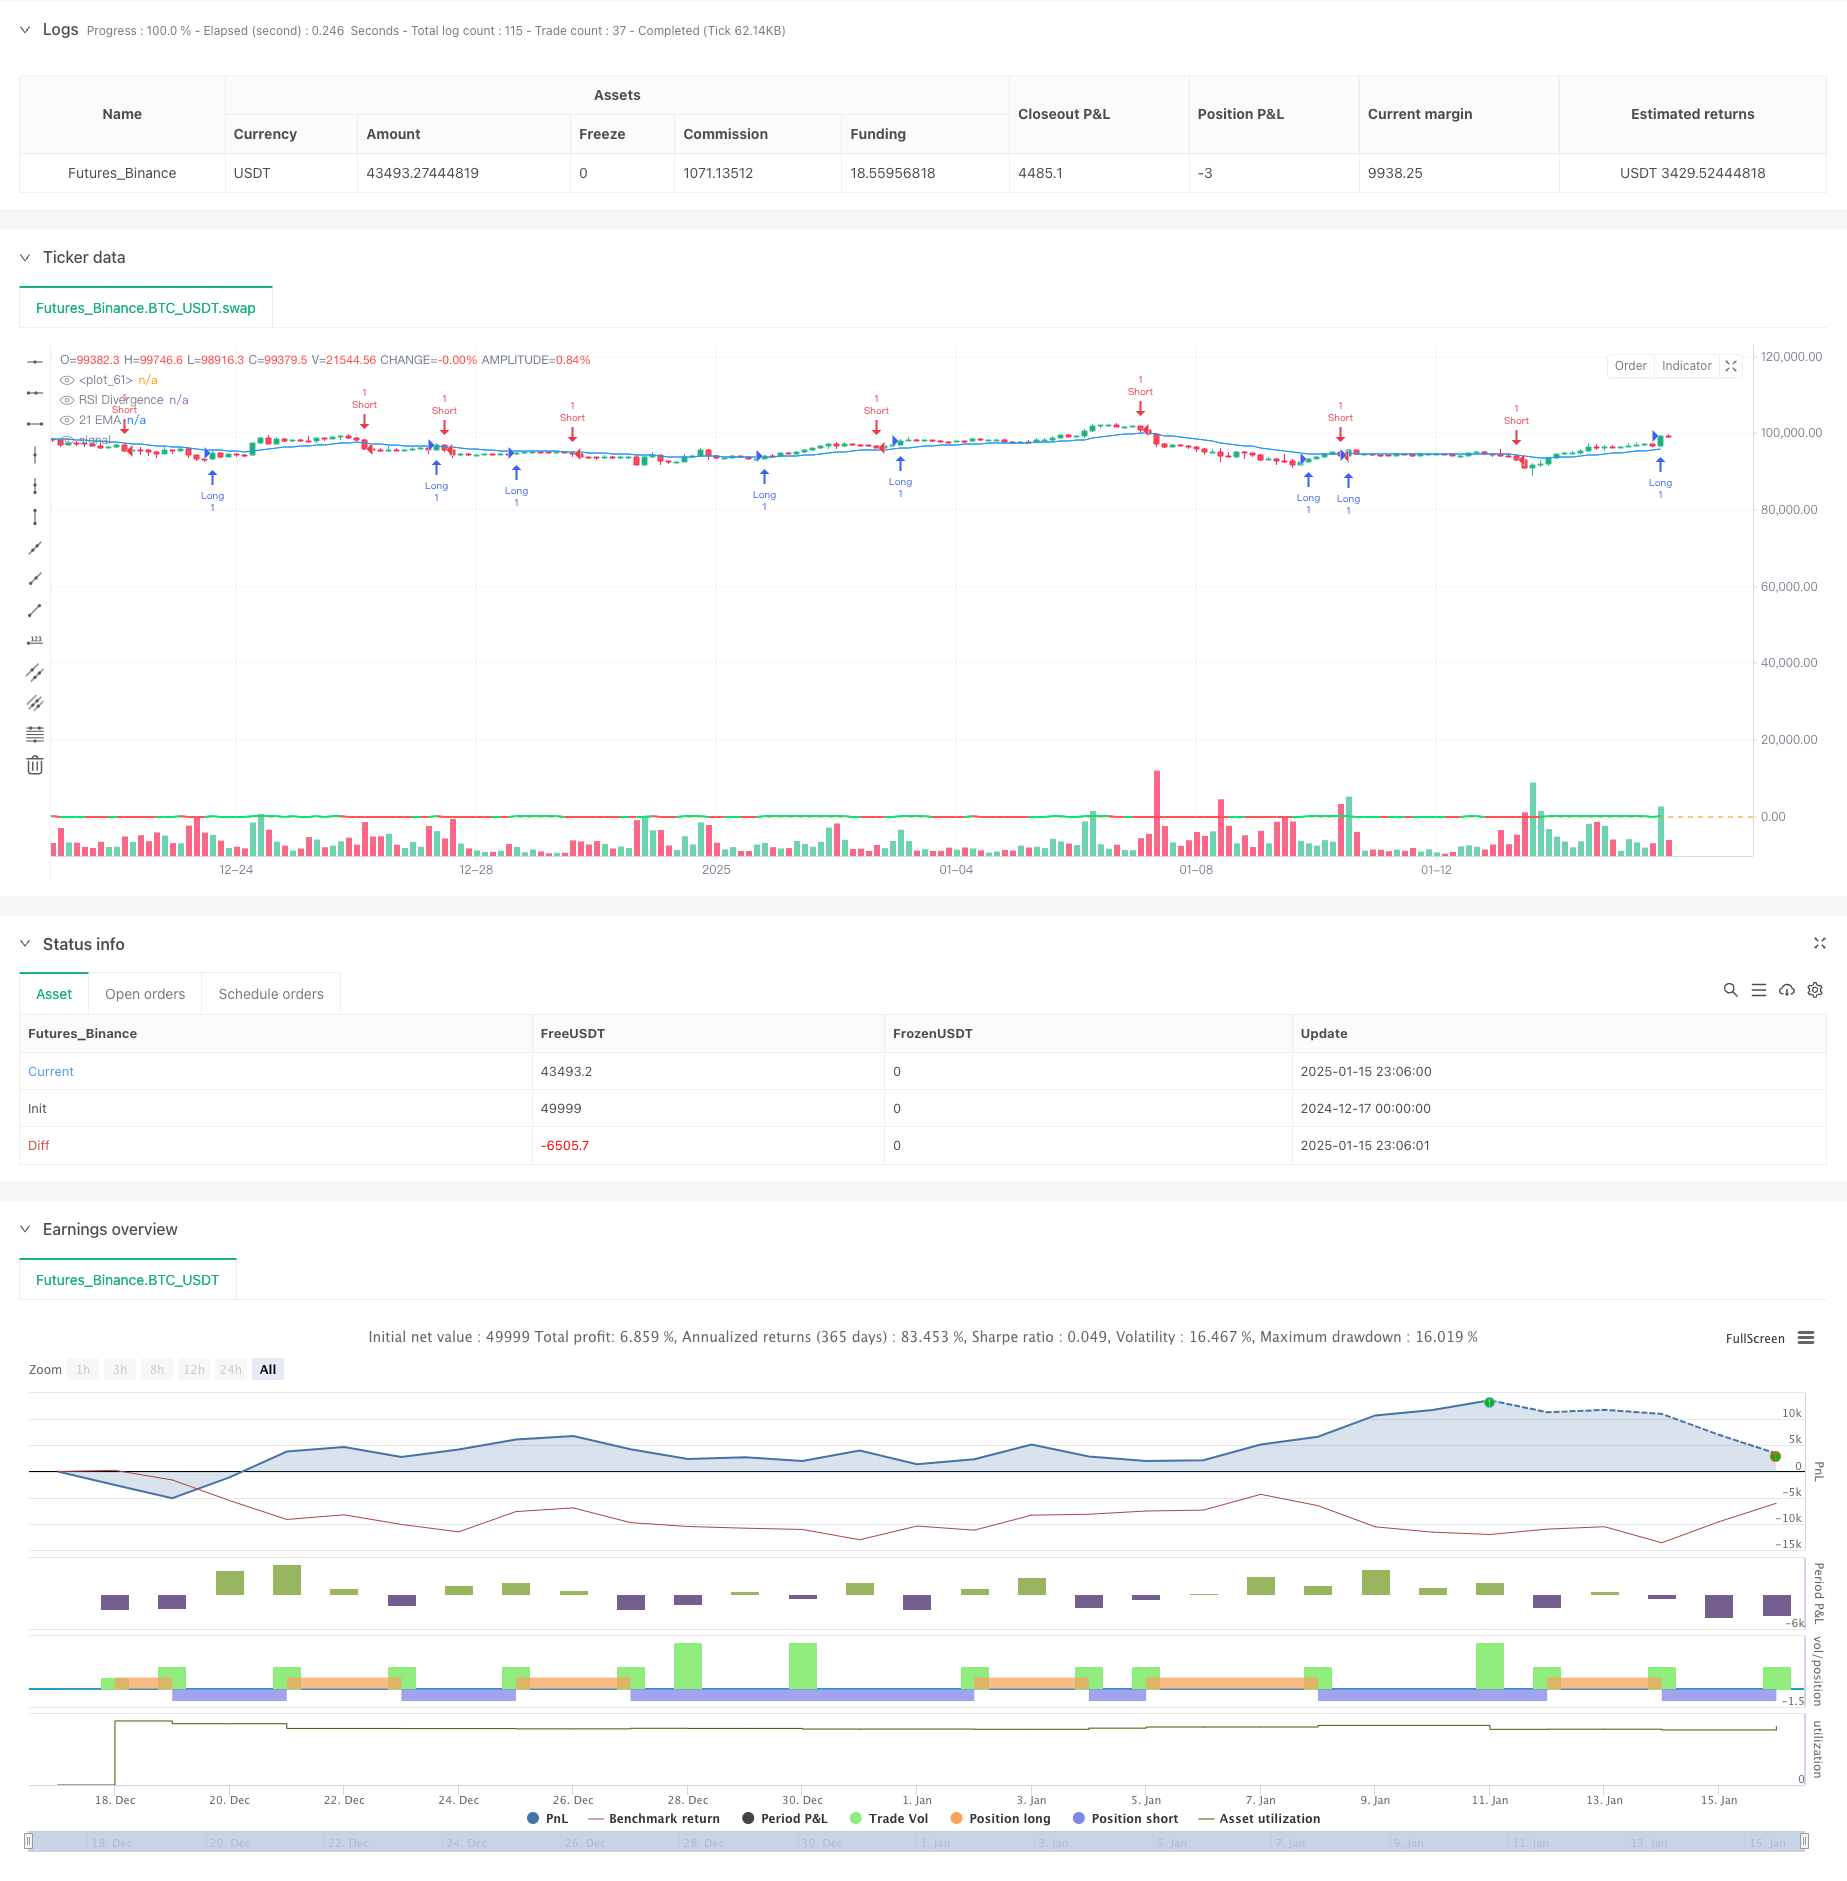
이 전략은 대규모 촛대 식별과 RSI 발산 지표를 주요 신호로 사용하고, 초기 고정 손절매와 동적 추적 손절매를 결합하여 완전한 추세 추적 거래 시스템을 형성합니다. 이 전략은 현재 캔들스틱의 바디 크기를 이전 5개 캔들스틱과 비교하여 대규모 시장 상황을 파악하고 빠른 RSI와 느린 RSI의 차이를 사용하여 모멘텀 변화를 확인합니다. 마지막으로 이중 손절매 메커니즘을 사용하여 관리합니다. 위험과 수익의 고정.
전략 원칙
전략은 4가지 핵심 요소로 구성됩니다. 1) 대형 캔들스틱 식별 - 현재 및 이전 5개 캔들스틱 본체 크기를 비교하여 중요한 가격 모멘텀을 결정합니다. 2) RSI 발산 분석 - 5기간 빠른 RSI 및 14기간 느린 RSI를 사용합니다. 3) 초기 손절매 - 초기 위험을 통제하기 위해 진입 시점에 200포인트의 고정 손절매를 설정합니다. 4) 추적 손절매 - 수익이 200포인트에 도달하면 활성화되고 가격과 함께 150포인트를 유지합니다. 포인트의 동적 추종 거리. 이 전략은 또한 21기간 EMA를 추세 필터로 사용하여 전반적인 시장 방향을 결정하는 데 도움을 줍니다.
전략적 이점
- 종합적인 위험 관리 - 고정 정지로 최대 손실을 제한하고 추적 정지로 실현된 이익을 보호합니다.
- 신뢰할 수 있는 진입 신호 - 대형 캔들스틱은 일반적으로 강력한 가격 모멘텀을 나타내며 더 높은 확률의 거래 기회를 제공합니다.
- 신호 확인이 충분합니다 - RSI 발산은 모멘텀 변화를 확인하고 잘못된 신호의 위험을 줄이는 데 도움이 되는 보조 지표로 사용됩니다.
- 유연한 이익 보호 - 동적 트레일링 스톱 메커니즘을 통해 이익을 보호하면서 더 큰 가격 변동을 포착할 수 있습니다.
- 고도로 조정 가능한 매개변수 - 트레일링 시작점, 트레일링 거리 및 초기 정지 손실과 같은 주요 매개변수는 다양한 시장 특성에 따라 최적화될 수 있습니다.
전략적 위험
- 변동성 있는 시장의 위험 - 횡보 거래 중에 손절매가 자주 발생할 수 있습니다.
- 갭 위험 - 큰 갭으로 인해 실제 손절매 지점이 예상 지점과 다를 수 있습니다.
- 슬리피지 위험 - 빠른 시장 상황에서는 큰 슬리피지가 발생할 수 있으며, 이는 실제 실행 효과에 영향을 미칠 수 있습니다.
- 거짓 브레이크아웃 위험 - 다수의 캔들 이후에 거짓 브레이크아웃이 발생할 수 있으며, 이는 손절매 종료로 이어질 수 있습니다.
- 매개변수 민감도 - 손절매 매개변수 설정은 전략 성과에 더 큰 영향을 미칩니다.
전략 최적화 방향
- 시장 환경 필터 - 변동성이 낮은 환경에서 거래를 중단하기 위해 ATR과 같은 변동성 지표를 추가하는 것이 좋습니다.
- 진입 타이밍 최적화 - 가격 패턴이나 기타 기술 지표와 결합하여 진입 타이밍의 정확도를 개선할 수 있습니다.
- 동적 손절매 매개변수 - 시장 변동성에 따라 후행 손절매 거리를 동적으로 조정하는 것을 고려하세요
- 포지션 관리 개선 - 변동성 기반 포지션 크기 조정 메커니즘을 도입할 수 있습니다.
- 추세 강도 필터 추가 - 추세 강도 지표를 추가하여 강력한 추세에서 더 느슨한 손절매 설정을 사용할 수 있습니다.
요약하다
이 전략은 다수의 캔들스틱과 RSI 발산점을 결합하여 완전한 추세 추종 시스템을 구축하고, 이중 손절매 메커니즘을 통해 종합적인 위험 관리를 달성합니다. 이 전략은 명확한 추세와 높은 변동성을 지닌 시장 환경에서 운영하는 데 적합하지만, 거래자는 특정 시장 특성에 따라 매개변수 설정을 조정해야 합니다. 제안된 최적화 방향을 통해 전략의 안정성과 수익성이 더욱 향상될 것으로 기대됩니다.
/*backtest
start: 2024-12-17 00:00:00
end: 2025-01-16 00:00:00
period: 3h
basePeriod: 3h
exchanges: [{"eid":"Futures_Binance","currency":"BTC_USDT","balance":49999}]
*/

//@version=6
strategy('[F][IND] - Big Candle Identifier with RSI Divergence and Advanced Stops', shorttitle = '[F][IND] Big Candle RSI Trail', overlay = true)

// Inputs for the trailing stop and stop loss
trail_start_ticks = input.int(200, "Trailing Start Ticks", tooltip="The number of ticks the price must move in the profitable direction before the trailing stop starts.")
trail_distance_ticks = input.int(150, "Trailing Distance Ticks", tooltip="The distance in ticks between the trailing stop and the price once the trailing stop starts.")
initial_stop_loss_points = input.int(200, "Initial Stop Loss Points", tooltip="The fixed stop loss applied immediately after entering a trade.")

// Tick size based on instrument
tick_size = syminfo.mintick

// Calculate trailing start and distance in price
trail_start_price = trail_start_ticks * tick_size
trail_distance_price = trail_distance_ticks * tick_size
initial_stop_loss_price = initial_stop_loss_points * tick_size

// Identify big candles
body0 = math.abs(close[0] - open[0])
body1 = math.abs(close[1] - open[1])
body2 = math.abs(close[2] - open[2])
body3 = math.abs(close[3] - open[3])
body4 = math.abs(close[4] - open[4])
body5 = math.abs(close[5] - open[5])

bullishBigCandle = body0 > body1 and body0 > body2 and body0 > body3 and body0 > body4 and body0 > body5 and open < close
bearishBigCandle = body0 > body1 and body0 > body2 and body0 > body3 and body0 > body4 and body0 > body5 and open > close

// RSI Divergence
rsi_fast = ta.rsi(close, 5)
rsi_slow = ta.rsi(close, 14)
divergence = rsi_fast - rsi_slow

// Trade Entry Logic
if bullishBigCandle
    strategy.entry('Long', strategy.long, stop=low - initial_stop_loss_price)
if bearishBigCandle
    strategy.entry('Short', strategy.short, stop=high + initial_stop_loss_price)

// Trailing Stop Logic
var float trail_stop = na
if strategy.position_size > 0 // Long Position
    entry_price = strategy.position_avg_price
    current_profit = close - entry_price
    if current_profit >= trail_start_price
        trail_stop := math.max(trail_stop, close - trail_distance_price)
    strategy.exit("Trailing Stop Long", "Long", stop=trail_stop)

if strategy.position_size < 0 // Short Position
    entry_price = strategy.position_avg_price
    current_profit = entry_price - close
    if current_profit >= trail_start_price
        trail_stop := math.min(trail_stop, close + trail_distance_price)
    strategy.exit("Trailing Stop Short", "Short", stop=trail_stop)

// Plotting Trailing Stop
plot(strategy.position_size > 0 ? trail_stop : na, color=color.green, title="Trailing Stop (Long)")
plot(strategy.position_size < 0 ? trail_stop : na, color=color.red, title="Trailing Stop (Short)")

// Plotting RSI Divergence
plot(divergence, color=divergence > 0 ? color.lime : color.red, linewidth=2, title="RSI Divergence")
hline(0)

// Plotting EMA
ema21 = ta.ema(close, 21)
plot(ema21, color=color.blue, title="21 EMA")