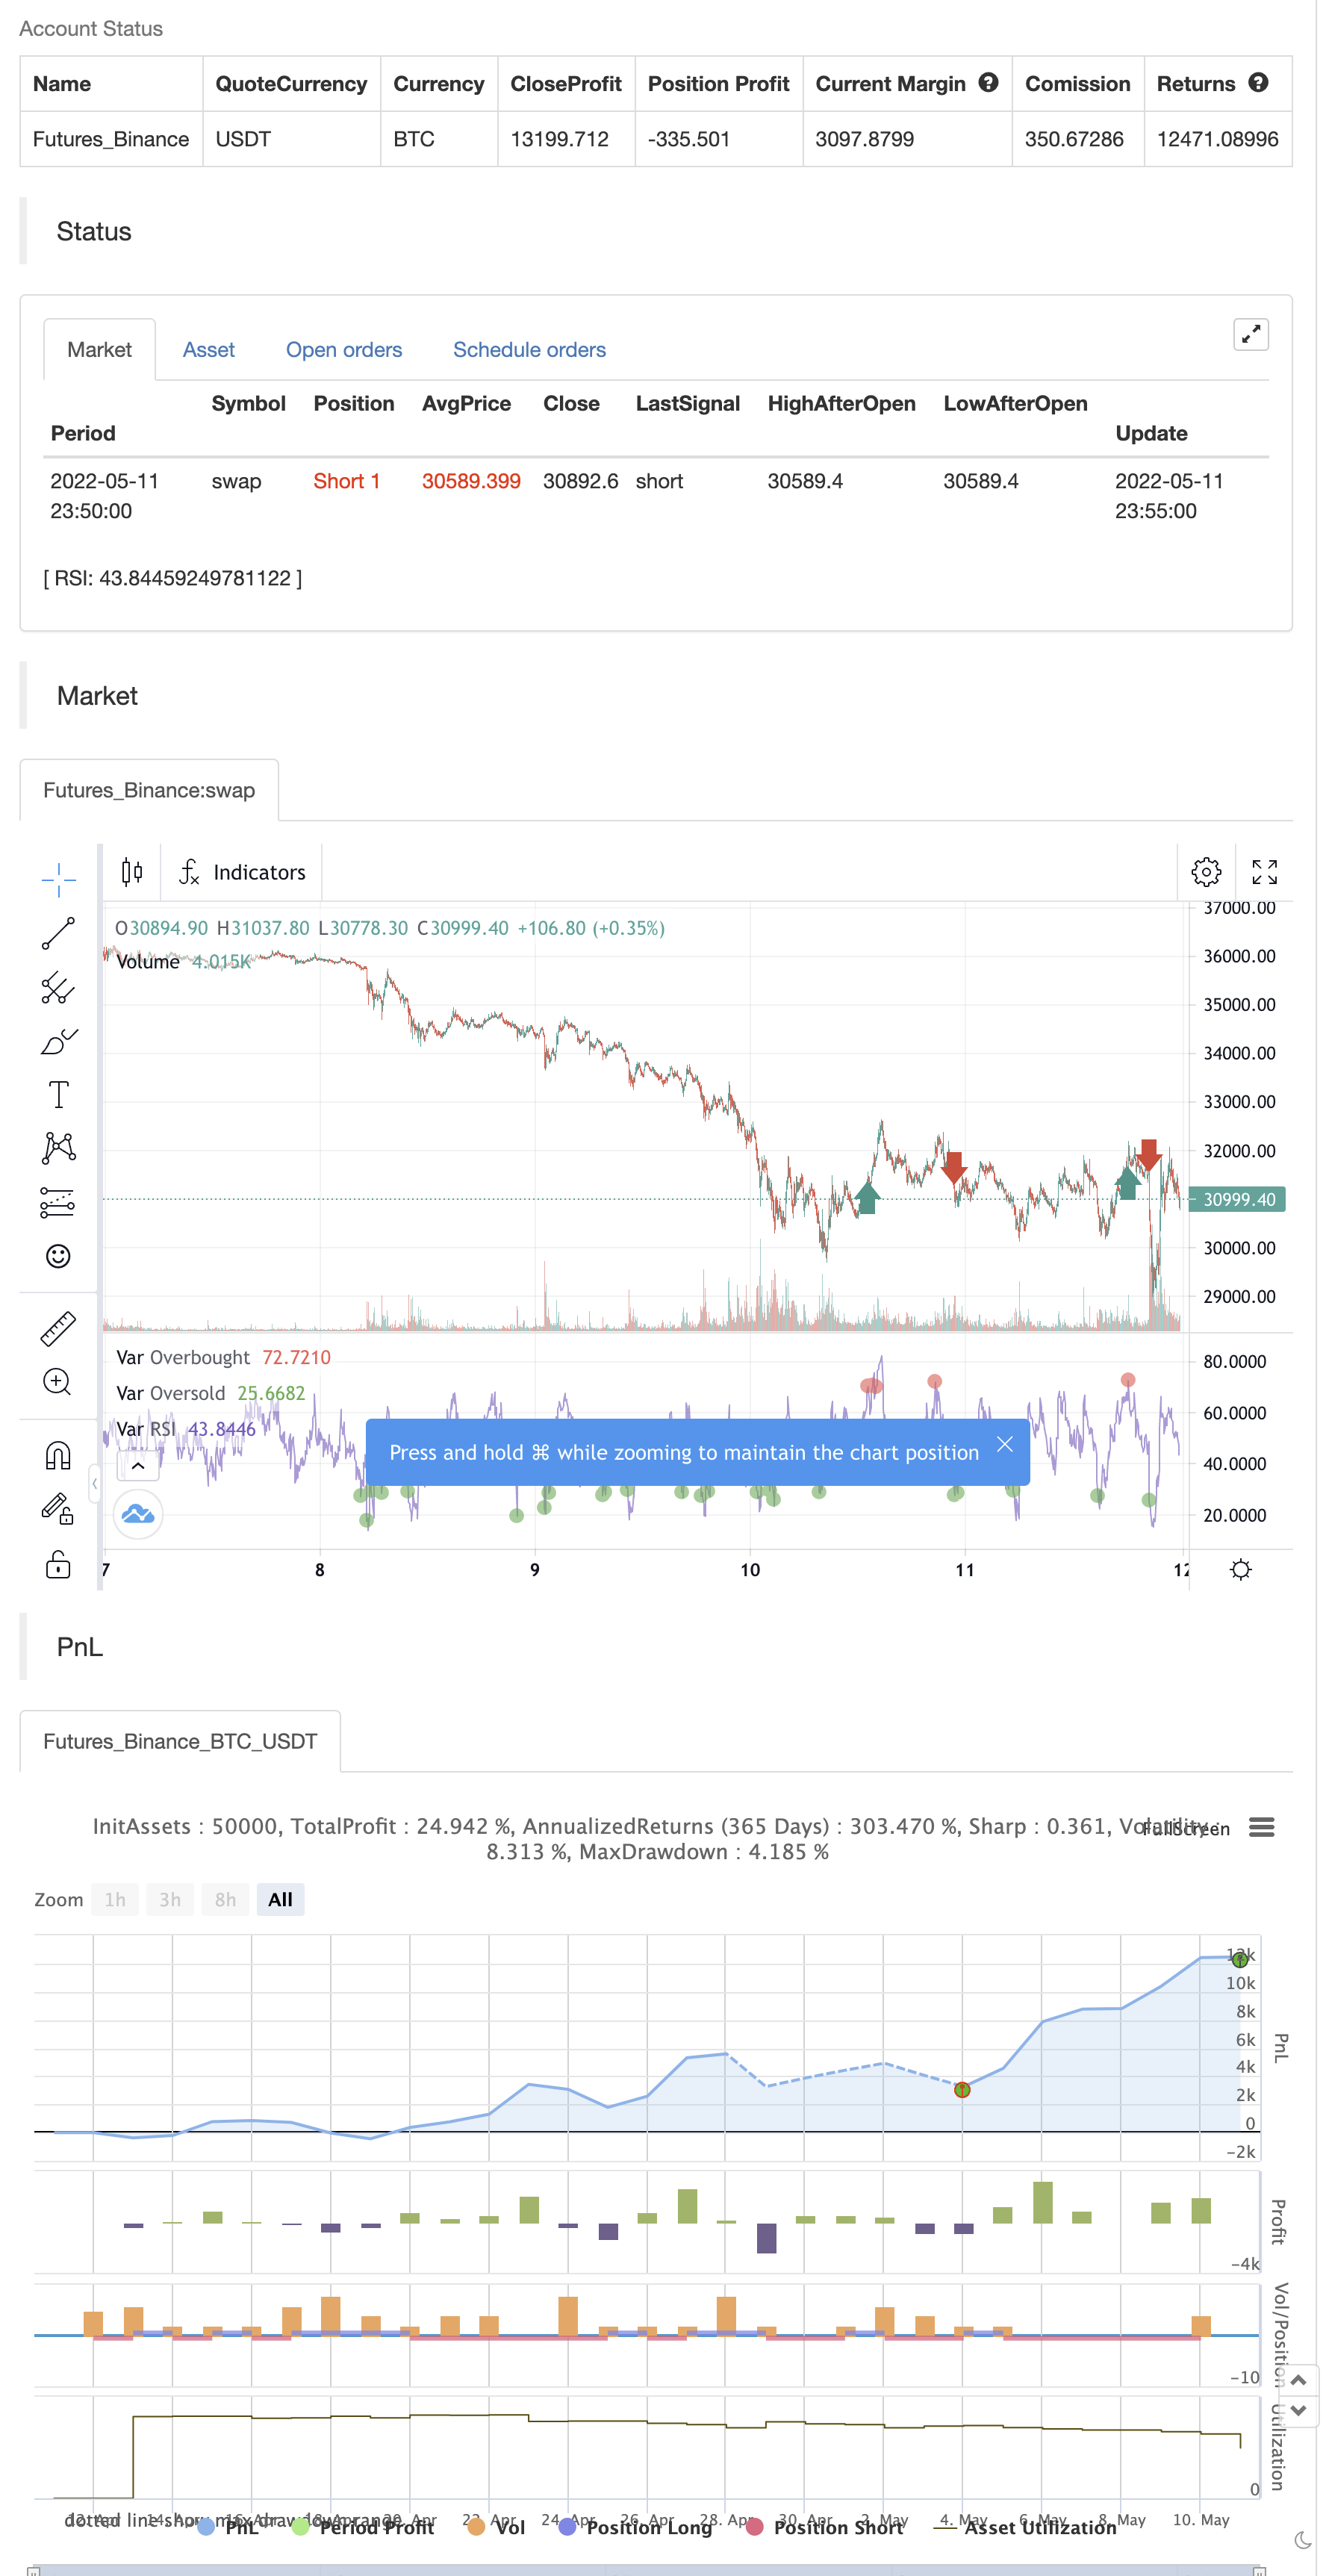
RSI oleh zdmre
Penulis:ChaoZhang, Tarikh: 2022-05-13 16:34:43Tag:RMA
Tafsiran tradisional dan penggunaan RSI mendikte bahawa nilai 70 atau lebih menunjukkan bahawa sekuriti menjadi terlalu banyak dibeli atau terlalu dinilai dan mungkin disiapkan untuk pembalikan trend atau kenaikan harga pembetulan.
30 = Jualan berlebihan 70 = Terlalu beli
Terima kasih @DieGobelMonte atas cadangan anda.
Ujian belakang

/*backtest
start: 2022-04-12 00:00:00
end: 2022-05-11 23:59:00
period: 5m
basePeriod: 1m
exchanges: [{"eid":"Futures_Binance","currency":"BTC_USDT"}]
*/

// This source code is subject to the terms of the Mozilla Public License 2.0 at https://mozilla.org/MPL/2.0/
// © zdmre

//@version=5
indicator("RSI by zdmre", overlay=false)

len = input.int(14, minval=1, title='Length')
src = input(close, 'Source')
up = ta.rma(math.max(ta.change(src), 0), len)
down = ta.rma(-math.min(ta.change(src), 0), len)
rsi = down == 0 ? 100 : up == 0 ? 0 : 100 - 100 / (1 + up / down)
plot(rsi, 'RSI', color=color.new(#7E57C2, 0))
band1 = hline(70, "Upper Band", color=#787B86)
bandm = hline(50, "Middle Band", color=color.new(#787B86, 50))
band0 = hline(30, "Lower Band", color=#787B86)
fill(band1, band0, color=color.rgb(126, 87, 194, 90), title="Background")

ob= ta.cross(rsi, 70) == 1 and rsi >= 70
os = ta.cross(rsi, 30) == 1 and rsi <= 30

plot(ob ? rsi : na ,title='Overbought', style=plot.style_circles, color=color.new(color.red, 0), linewidth=5)
plot(os ? rsi : na ,title='Oversold ', style=plot.style_circles, color=color.new(color.green, 0), linewidth=5)

if ob
    strategy.entry("Enter Long", strategy.long)
else if os
    strategy.entry("Enter Short", strategy.short)
Kandungan berkaitan
- Strategi perdagangan kuantitatif parameter dinamik RSI yang dibantu dengan melintasi pelbagai garisan
- Strategi perdagangan kuantitatif dengan pengesanan trend silang dinamik dengan pelbagai pengesahan
- Strategi dagangan indeks yang kuat dan lemah yang bertindih pada pelbagai peringkat
- Strategi pengukuran silang purata bergerak dinamik yang menggabungkan pelbagai penunjuk
- RSI Dinamik Strategi Dagangan Bintang Masa Pemilihan Pintar
- Strategi pengukur pergerakan melintasi dua garis rata
- Strategi pengesanan trend persimpangan linear berbilang kitaran
- Strategi penyeberangan purata bergerak untuk menyesuaikan diri
- Strategi pelacakan trend dan kadar turun naik
- Strategi perdagangan dinamik silang yang berlainan
- VAWSI dan strategi pembalikan trend berterusan yang digabungkan dengan sistem analisis komprehensif pelbagai indikator yang mengira panjang dinamik
Lebih lanjut
- Sidboss
- Titik Pivot Tinggi Rangka Masa Multi Rendah
- Ghosts Trend Tracking Strategy Database
- Ghoul Trend Track Strategi Perpustakaan Perniagaan
- Strategi Pengesanan Tren Hantu
- Oscillator Pelangi
- Contoh Pengukuran Posisi Lorong Ekuiti
- Persembahan KLineChart
- Villa Dinamic Pivot Supertrend Strategi
- Supertrend Crodl
- FTL - Penapis Julat X2 + EMA + UO
- BRAHMASTRA
- Band Mobo
- SAR + 3SMMA dengan SL & TP
- SSS
- Templat Isyarat Pelancaran Bulan [Indikator]
- HALFTREND + HEMA + SMA (Strategi Isyarat Palsu)
- RSI Perbezaan dengan Pivot, BB, SMA, EMA, SMMA, WMA, VWMA
- RSI dan BBand oversold pada masa yang sama
- Menggulung Heikin Ashi lilin