Strategi Bipolar Pulangan Bulanan
Tarikh penciptaan:
2023-11-06 16:06:55
Akhirnya diubah suai:
2023-11-06 16:06:55
Salin:
0
Bilangan klik:
388
1
fokus pada
1212
Pengikut
Gambaran keseluruhan
Strategi ini menggunakan titik-titik pusat garis K untuk menilai trend berbalik, dan dengan ini memberi isyarat kepada perdagangan berlainan. Apabila menguntungkan, strategi ini akan mengunci keuntungan yang telah dicapai pada bulan itu, untuk mengelakkan kerugian yang lebih besar pada tempoh penarikan balik.
Prinsip-prinsip strategi
- Penggunaan
pivothigh()danpivotlow()Fungsi ini mengira titik-titik pusat garisan K. Titik-titik pusat garisan dapat menentukan perubahan trend. - Apabila harga melebihi titik pusat atas, buatlah kedudukan multihead. Apabila harga jatuh di bawah titik pusat bawah, buatlah kedudukan shorthead.
- Pada awal setiap bulan, anda akan dikira kadar pendapatan bulan lalu dan disimpan ke dalam sebuah “array”.
- Pada awal setiap tahun, kadar pulangan tahun lepas dikira dan disimpan ke dalam array.
- Menggambar jadual kadar faedah, anda boleh melihat faedah setiap bulan dan tahun.
Analisis kelebihan
- Menggunakan titik-titik pusat untuk menentukan perubahan trend, anda boleh menyaring sebahagian daripada isyarat perdagangan bising.
- Mengunci pendapatan setiap bulan dapat mengurangkan kesan bulan yang rugi, dan keuntungan yang dipolarisasi.
- Borang pendapatan menunjukkan secara langsung pendapatan setiap bulan, dan anda dapat melihat dengan jelas masa-masa yang baik dan buruk dalam strategi tersebut.
Analisis risiko
- Apabila titik-titik pivot berubah, ia boleh menyebabkan kesilapan untuk membuka semula kedudukan. Parameter boleh dioptimumkan dengan sewajarnya atau menambah syarat penapisan.
- Jika anda memaksa posisi anda ditutup pada awal bulan, anda akan terlepas peluang untuk menjana keuntungan pada bulan berikutnya. Anda boleh mempertimbangkan untuk mengunci hanya sebahagian daripada kedudukan anda.
- Jadual ini tidak dapat memaparkan indikator risiko seperti penarikan balik maksimum. Anda boleh mempertimbangkan untuk menambah indikator lain yang mengukur risiko strategi.
arah optimum
- Anda boleh menambah syarat penapisan berhampiran titik pusat untuk mengelakkan pertukaran balik yang sering tidak sah.
- Anda boleh mengunci hanya sebahagian daripada kedudukan dan tidak semua kedudukan kosong, mengurangkan kemungkinan kehilangan.
- Indikator-indikator risiko kuantitatif seperti penarikan balik maksimum, nisbah Sharpe, dan lain-lain boleh ditambahkan ke dalam borang.
Ringkasan
Strategi ini menggunakan titik-titik utama untuk menentukan trend berbalik untuk berdagang dan mengunci keuntungan pada akhir bulan. Tetapi beberapa parameter dan logik strategi dapat dioptimumkan lebih jauh, menjadikan isyarat perdagangan lebih tepat dan kawalan risiko lebih stabil.
Kod sumber strategi
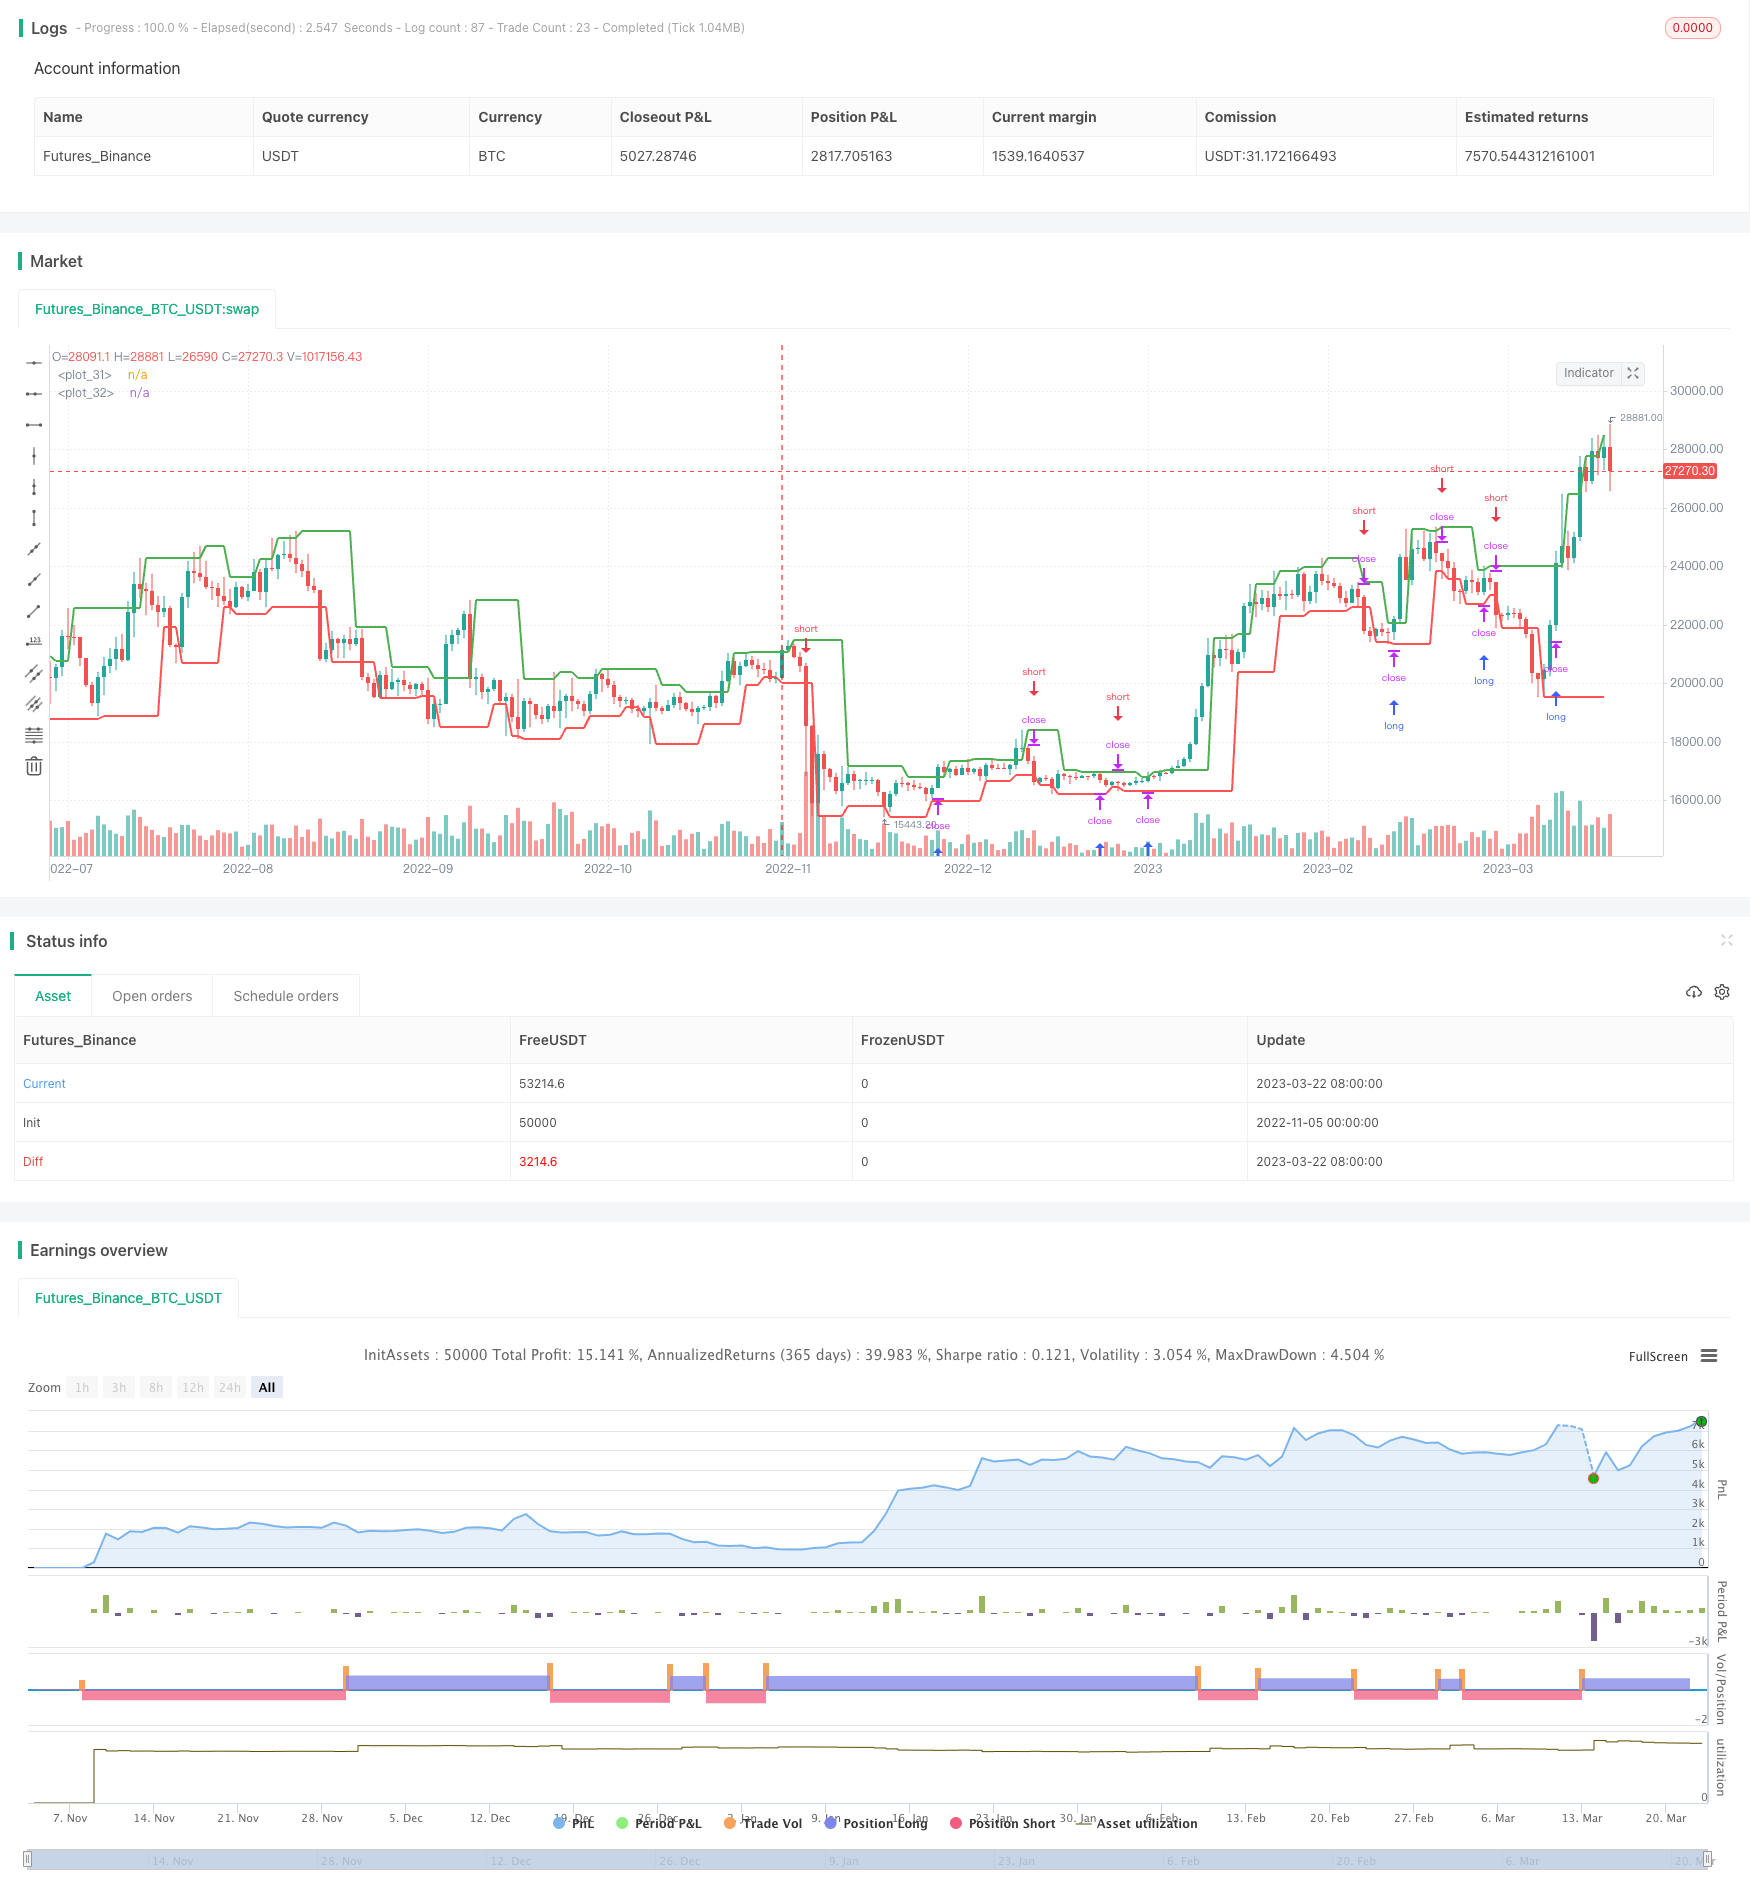
/*backtest
start: 2022-11-05 00:00:00
end: 2023-03-23 05:20:00
period: 1d
basePeriod: 1h
exchanges: [{"eid":"Futures_Binance","currency":"BTC_USDT"}]
*/

//@version=4
strategy("Monthly Returns in PineScript Strategies", overlay = true, default_qty_type = strategy.percent_of_equity, default_qty_value = 25, calc_on_every_tick = true, commission_type = strategy.commission.percent, commission_value = 0.1)

// Inputs
leftBars  = input(2)
rightBars = input(1)
prec      = input(2, title = "Return Precision")

// Pivot Points
swh = pivothigh(leftBars, rightBars)
swl = pivotlow(leftBars, rightBars)

hprice = 0.0
hprice := not na(swh) ? swh : hprice[1]

lprice = 0.0
lprice := not na(swl) ? swl : lprice[1]

le = false
le := not na(swh) ? true : (le[1] and high > hprice ? false : le[1])

se = false
se := not na(swl) ? true : (se[1] and low < lprice ? false : se[1])

if (le)
	strategy.entry("PivRevLE", strategy.long, comment="PivRevLE", stop=hprice + syminfo.mintick)

if (se)
	strategy.entry("PivRevSE", strategy.short, comment="PivRevSE", stop=lprice - syminfo.mintick)

plot(hprice, color = color.green, linewidth = 2)
plot(lprice, color = color.red,   linewidth = 2)

///////////////////
// MONTHLY TABLE //

new_month = month(time) != month(time[1])
new_year  = year(time)  != year(time[1])

eq = strategy.equity

bar_pnl = eq / eq[1] - 1

cur_month_pnl = 0.0
cur_year_pnl  = 0.0

// Current Monthly P&L
cur_month_pnl := new_month ? 0.0 :
                 (1 + cur_month_pnl[1]) * (1 + bar_pnl) - 1

// Current Yearly P&L
cur_year_pnl := new_year ? 0.0 :
                 (1 + cur_year_pnl[1]) * (1 + bar_pnl) - 1

// Arrays to store Yearly and Monthly P&Ls
var month_pnl  = array.new_float(0)
var month_time = array.new_int(0)

var year_pnl  = array.new_float(0)
var year_time = array.new_int(0)

if (not na(cur_month_pnl[1]) and (new_month or barstate.islast))
    array.push(month_pnl , cur_month_pnl[1])
    array.push(month_time, time[1])

if (not na(cur_year_pnl[1]) and (new_year or barstate.islast))
    array.push(year_pnl , cur_year_pnl[1])
    array.push(year_time, time[1])

// Monthly P&L Table
var monthly_table = table(na)

if (barstate.islast)
    monthly_table := table.new(position.bottom_right, columns = 14, rows = array.size(year_pnl) + 1, border_width = 1)

    table.cell(monthly_table, 0,  0, "",     bgcolor = #cccccc)
    table.cell(monthly_table, 1,  0, "Jan",  bgcolor = #cccccc)
    table.cell(monthly_table, 2,  0, "Feb",  bgcolor = #cccccc)
    table.cell(monthly_table, 3,  0, "Mar",  bgcolor = #cccccc)
    table.cell(monthly_table, 4,  0, "Apr",  bgcolor = #cccccc)
    table.cell(monthly_table, 5,  0, "May",  bgcolor = #cccccc)
    table.cell(monthly_table, 6,  0, "Jun",  bgcolor = #cccccc)
    table.cell(monthly_table, 7,  0, "Jul",  bgcolor = #cccccc)
    table.cell(monthly_table, 8,  0, "Aug",  bgcolor = #cccccc)
    table.cell(monthly_table, 9,  0, "Sep",  bgcolor = #cccccc)
    table.cell(monthly_table, 10, 0, "Oct",  bgcolor = #cccccc)
    table.cell(monthly_table, 11, 0, "Nov",  bgcolor = #cccccc)
    table.cell(monthly_table, 12, 0, "Dec",  bgcolor = #cccccc)
    table.cell(monthly_table, 13, 0, "Year", bgcolor = #999999)


    for yi = 0 to array.size(year_pnl) - 1
        table.cell(monthly_table, 0,  yi + 1, tostring(year(array.get(year_time, yi))), bgcolor = #cccccc)

        y_color = array.get(year_pnl, yi) > 0 ? color.new(color.green, transp = 50) : color.new(color.red, transp = 50)
        table.cell(monthly_table, 13, yi + 1, tostring(round(array.get(year_pnl, yi) * 100, prec)), bgcolor = y_color)

    for mi = 0 to array.size(month_time) - 1
        m_row   = year(array.get(month_time, mi))  - year(array.get(year_time, 0)) + 1
        m_col   = month(array.get(month_time, mi))
        m_color = array.get(month_pnl, mi) > 0 ? color.new(color.green, transp = 70) : color.new(color.red, transp = 70)

        table.cell(monthly_table, m_col, m_row, tostring(round(array.get(month_pnl, mi) * 100, prec)), bgcolor = m_color)