Strategi perbezaan berasaskan purata bergerak
Tarikh penciptaan:
2024-01-24 11:43:41
Akhirnya diubah suai:
2024-01-24 11:43:41
Salin:
1
Bilangan klik:
388
1
fokus pada
1234
Pengikut
Gambaran keseluruhan
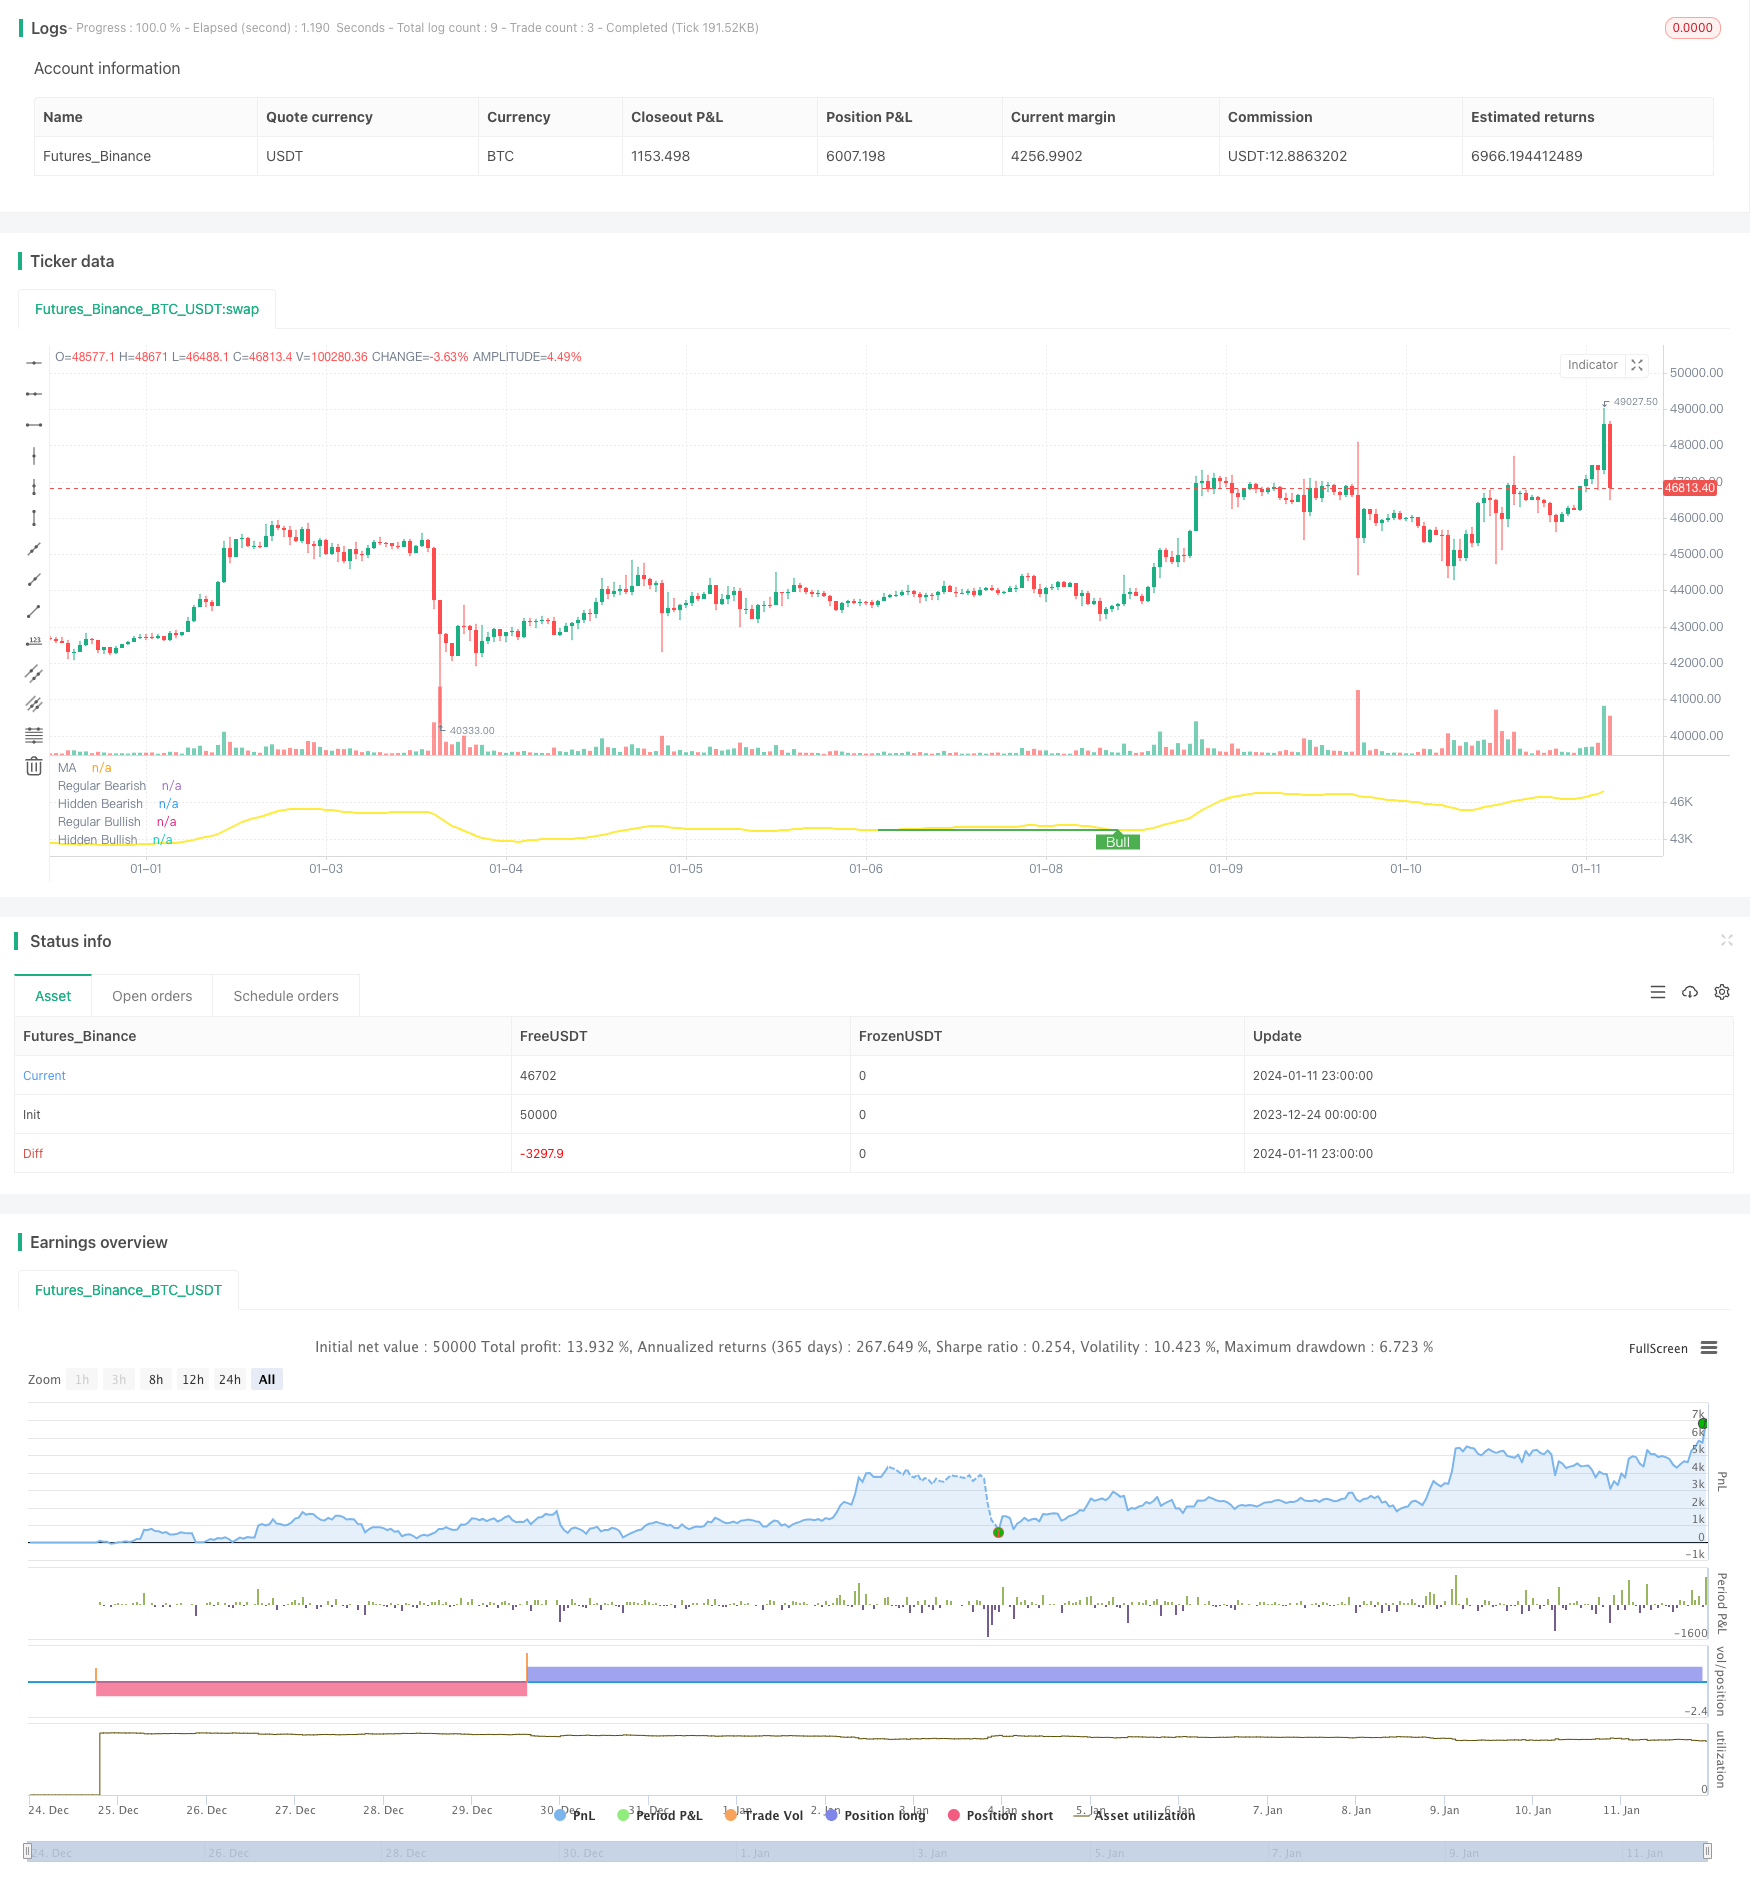
Strategi ini menggunakan pengiraan purata bergerak dan titik-titik pusatnya untuk mencari penyimpangan antara harga dan purata bergerak sebagai isyarat untuk membeli dan menjual. Ia boleh digunakan pada mana-mana penunjuk getaran untuk mencari penyimpangan.
Prinsip Strategi
- Pengiraan panjang sebagai purata bergerak Len (MA)
- Mengesan titik rendah (PL) dan titik tinggi (PH) pada MA
- Penilaian kewujudan deviasi positif: harga inovasi rendah dan MA tidak inovasi rendah atau harga tidak inovasi rendah dan MA inovasi rendah
- Menentukan sama ada terdapat kebalikan: harga tinggi dengan MA yang tidak inovatif atau harga tinggi dengan MA yang tidak inovatif
- Membeli dan menjual berdasarkan keadaan yang berbeza
Analisis kelebihan
- Mampu mengesan secara automatik perbezaan antara harga dan MA, mengelakkan kesalahan penilaian buatan
- Boleh digunakan untuk mana-mana penunjuk getaran, berskala tinggi
- Boleh digunakan untuk mengkaji semula kelayakan keuntungan strategi
- Parameter yang boleh dikonfigurasi menyesuaikan sensitiviti untuk mengelakkan isyarat yang salah
- Berbagai jenis penyingkiran untuk penilaian yang tepat dan menyeluruh
Analisis risiko
- Jika penunjuk getaran tidak ditetapkan dengan betul, ia boleh menghasilkan banyak isyarat salah
- Keadaan ini boleh berlaku apabila terdapat kurang isyarat yang diperlukan sebelum ia berlaku.
- Parameter perlu diselaraskan dengan betul untuk mengimbangi sensitiviti dan penapisan isyarat silap
- Penggunaan yang lebih baik dalam kombinasi dengan faktor-faktor lain, kurang dipercayai untuk digunakan secara bersendirian
Arah pengoptimuman
- Mengoptimumkan parameter purata bergerak untuk mencari kombinasi parameter terbaik
- Gabungan dengan petunjuk lain seperti petunjuk harga kuantiti untuk mengelakkan isyarat salah
- Menambah model pembelajaran mesin yang tidak boleh dipercayai
- Meningkatkan mekanisme pengurusan risiko untuk mengawal kerugian tunggal
ringkaskan
Strategi ini dapat mengotomatiskan penghakiman dan mengelakkan kesalahan subjektif dengan menemui penyingkiran antara harga dan purata bergerak sebagai isyarat perdagangan. Ia boleh digunakan secara meluas untuk mana-mana penunjuk getaran dan mempunyai skalabiliti yang kuat. Ia perlu digabungkan dengan pengoptimuman parameter dan digunakan dengan penunjuk lain, yang dapat meningkatkan kebolehpercayaan isyarat perdagangan dan kestabilan sistem.
Kod sumber strategi
/*backtest
start: 2023-12-24 00:00:00
end: 2024-01-12 00:00:00
period: 1h
basePeriod: 15m
exchanges: [{"eid":"Futures_Binance","currency":"BTC_USDT"}]
*/

// This source code is subject to the terms of the Mozilla Public License 2.0 at https://mozilla.org/MPL/2.0/
// © tista
//https://www.tradingview.com/u/tista/#published-scripts

//@version=4

strategy(title="MA Divergences", format=format.price)

//* Backtesting Period Selector | Component *//
//* https://www.tradingview.com/script/eCC1cvxQ-Backtesting-Period-Selector-Component *//
//* https://www.tradingview.com/u/pbergden/ *//
//* Modifications made *//
testStartYear = input(2021, "Backtest Start Year")
testStartMonth = input(1, "Backtest Start Month")
testStartDay = input(1, "Backtest Start Day")
testPeriodStart = timestamp(testStartYear,testStartMonth,testStartDay,0,0)

testStopYear = input(999999, "Backtest Stop Year")
testStopMonth = input(9, "Backtest Stop Month")
testStopDay = input(26, "Backtest Stop Day")
testPeriodStop = timestamp(testStopYear,testStopMonth,testStopDay,0,0)

testPeriod() => true
/////////////// END - Backtesting Period Selector | Component ///////////////
len = input(title="MA Period", minval=1, defval=14)
src = input(title="MA Source", defval=close)
lbR = input(title="Pivot Lookback Right", defval=5)
lbL = input(title="Pivot Lookback Left", defval=5)
rangeUpper = input(title="Max of Lookback Range", defval=600)
rangeLower = input(title="Min of Lookback Range", defval=2)
plotBull = input(title="Plot Bullish", defval=true)
plotHiddenBull = input(title="Plot Hidden Bullish", defval=true)
plotBear = input(title="Plot Bearish", defval=true)
plotHiddenBear = input(title="Plot Hidden Bearish", defval=true)

bearColor = color.red
bullColor = color.green
hiddenBullColor = color.green
hiddenBearColor = color.red
textColor = color.white
noneColor = color.new(color.white, 100)

osc = wma(src, len)

plot(osc, title="MA", linewidth=2, color=color.yellow)

plFound = na(pivotlow(osc, lbL, lbR)) ? false : true
phFound = na(pivothigh(osc, lbL, lbR)) ? false : true

_inRange(cond) =>
    bars = barssince(cond == true)
    rangeLower <= bars and bars <= rangeUpper

alertcondition(osc[1] > 100.0 and osc[2] < 100.0, title="MA value crosses over 100.0", message="Check charts for a MA cross over 100.0")
alertcondition(osc[1] < 100.0 and osc[2] > 100.0, title="MA value crosses under 100.0", message="Check charts for a MA cross under 100.0")
alertcondition(osc[1] > -100. and osc[2] < -100.0, title="MA value crosses over -100.0", message="Check charts for a MA cross over -100.0")
alertcondition(osc[1] < -100.0 and osc[2] > -100.0, title="MA value crosses under -100.0", message="Check charts for a MA cross under -100.0")

//------------------------------------------------------------------------------
// Regular Bullish

// Osc: Higher Low
oscHL = osc[lbR] > valuewhen(plFound, osc[lbR], 1) and _inRange(plFound[1])

// Price: Lower Low
priceLL = low[lbR] < valuewhen(plFound, low[lbR], 1)

bullCond = plotBull and priceLL and oscHL and plFound

plot(
	 plFound ? osc[lbR] : na,
	 offset=-lbR,
	 title="Regular Bullish",
	 linewidth=2,
	 color=(bullCond ? bullColor : noneColor),
	 transp=0
	 )

plotshape(
	 bullCond ? osc[lbR] : na,
	 offset=-lbR,
	 title="Regular Bullish Label",
	 text=" Bull ",
	 style=shape.labelup,
	 location=location.absolute,
	 color=bullColor,
	 textcolor=textColor,
	 transp=0
	 )

alertcondition(bullCond, title="Regular bullish divergence in MA found", message="Check charts for a regular bullish divergence found with MA")

//------------------------------------------------------------------------------
// Hidden Bullish

// Osc: Lower Low
oscLL = osc[lbR] < valuewhen(plFound, osc[lbR], 1) and _inRange(plFound[1])

// Price: Higher Low
priceHL = low[lbR] > valuewhen(plFound, low[lbR], 1)

hiddenBullCond = plotHiddenBull and priceHL and oscLL and plFound

plot(
	 plFound ? osc[lbR] : na,
	 offset=-lbR,
	 title="Hidden Bullish",
	 linewidth=2,
	 color=(hiddenBullCond ? hiddenBullColor : noneColor),
	 transp=0
	 )

plotshape(
	 hiddenBullCond ? osc[lbR] : na,
	 offset=-lbR,
	 title="Hidden Bullish Label",
	 text=" H Bull ",
	 style=shape.labelup,
	 location=location.absolute,
	 color=bullColor,
	 textcolor=textColor,
	 transp=0
	 )

alertcondition(hiddenBullCond, title="Hidden bullish divergence in MA found", message="Check charts for a hidden bullish divergence found with MA")

//------------------------------------------------------------------------------
// Regular Bearish

// Osc: Lower High
oscLH = osc[lbR] < valuewhen(phFound, osc[lbR], 1) and _inRange(phFound[1])

// Price: Higher High
priceHH = high[lbR] > valuewhen(phFound, high[lbR], 1)

bearCond = plotBear and priceHH and oscLH and phFound

plot(
	 phFound ? osc[lbR] : na,
	 offset=-lbR,
	 title="Regular Bearish",
	 linewidth=2,
	 color=(bearCond ? bearColor : noneColor),
	 transp=0
	 )

plotshape(
	 bearCond ? osc[lbR] : na,
	 offset=-lbR,
	 title="Regular Bearish Label",
	 text=" Bear ",
	 style=shape.labeldown,
	 location=location.absolute,
	 color=bearColor,
	 textcolor=textColor,
	 transp=0
	 )

alertcondition(bearCond, title="Regular bearish divergence in MA found", message="Check charts for a regular bearish divergence found with MA")

//------------------------------------------------------------------------------
// Hidden Bearish

// Osc: Higher High
oscHH = osc[lbR] > valuewhen(phFound, osc[lbR], 1) and _inRange(phFound[1])

// Price: Lower High
priceLH = high[lbR] < valuewhen(phFound, high[lbR], 1)

hiddenBearCond = plotHiddenBear and priceLH and oscHH and phFound

plot(
	 phFound ? osc[lbR] : na,
	 offset=-lbR,
	 title="Hidden Bearish",
	 linewidth=2,
	 color=(hiddenBearCond ? hiddenBearColor : noneColor),
	 transp=0
	 )

plotshape(
	 hiddenBearCond ? osc[lbR] : na,
	 offset=-lbR,
	 title="Hidden Bearish Label",
	 text=" H Bear ",
	 style=shape.labeldown,
	 location=location.absolute,
	 color=bearColor,
	 textcolor=textColor,
	 transp=0
	 )

// Alerts
//alertcondition(bearCond or hiddenBearCond, title='Bear div', message='Bear div')
//alertcondition(bullCond or hiddenBullCond, title='Bull div', message='Bull div')
//alertcondition(bearCond or bullCond, title='Bull or beal div', message='Bull or bear div')
//alertcondition(hiddenBearCond or hiddenBullCond, title='Bull or beal div', message='Hidden Bull or bear div')
//alertcondition(hiddenBearCond or hiddenBullCond or bearCond or bullCond, title='Bull or beal div', message='Any Bull or bear div')

if testPeriod()
    if bullCond or hiddenBullCond
        strategy.entry("Buy", strategy.long)
    if bearCond or hiddenBearCond
        strategy.entry("Sell", strategy.short)