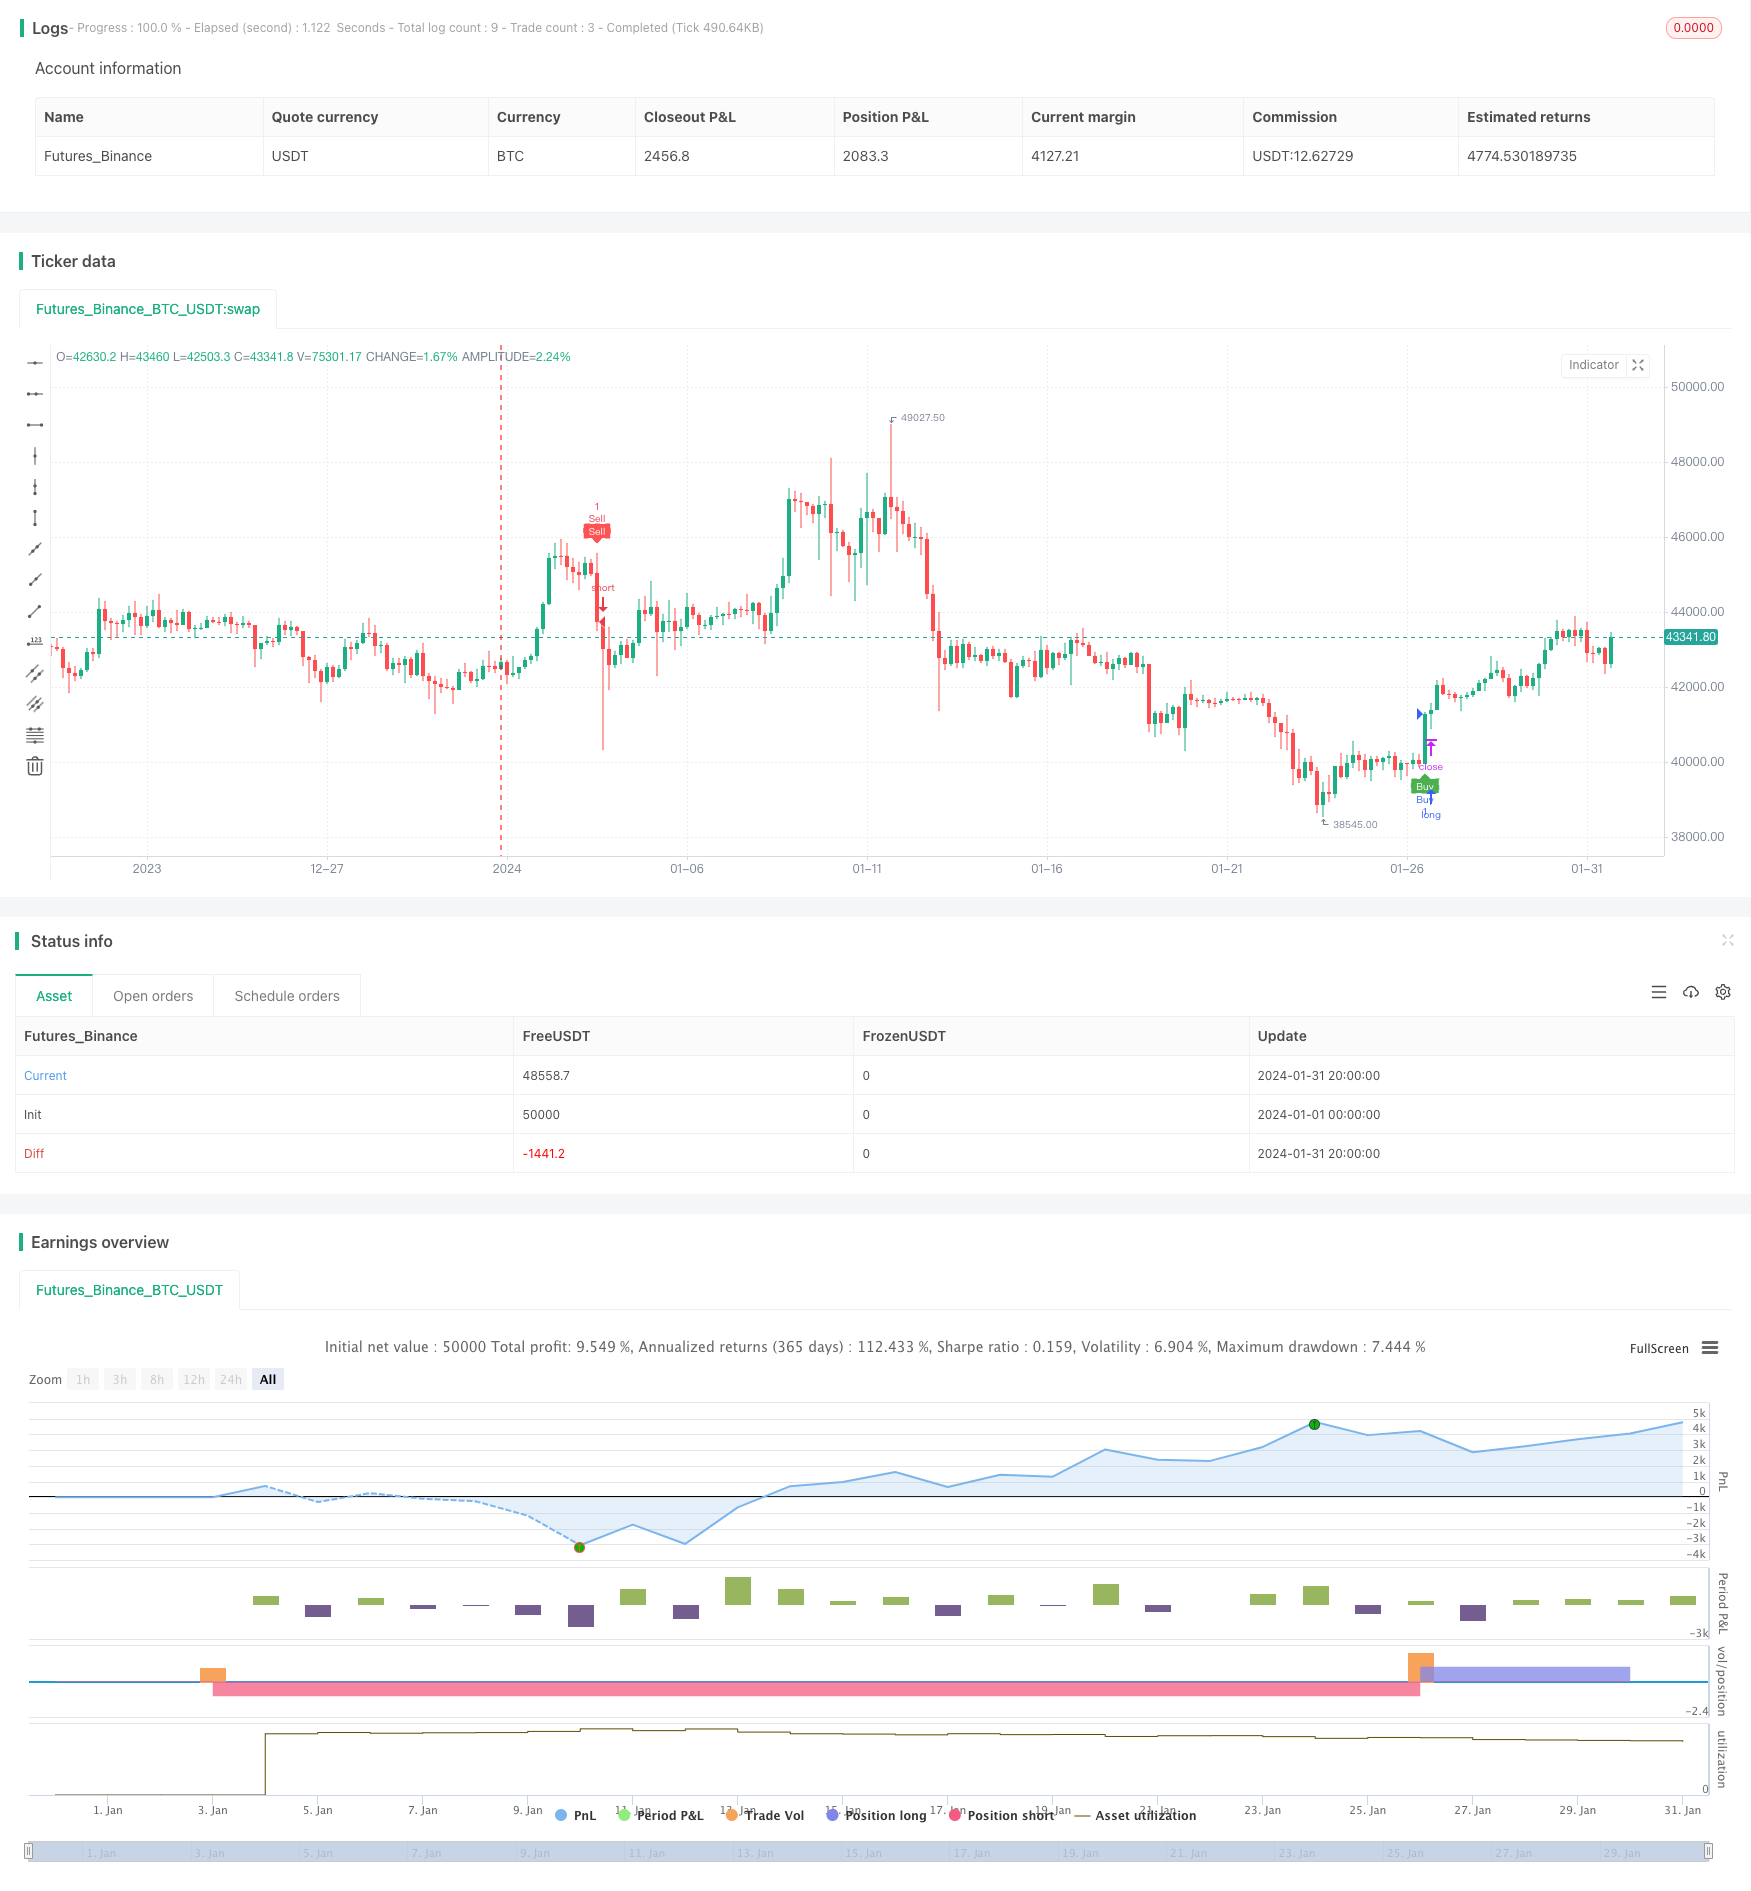
Berdasarkan strategi indeks pergerakan dua hala

Gambaran keseluruhan
Strategi ini menghasilkan isyarat perdagangan dengan mengira indeks pergerakan dua hala DI +, DI - dan indeks arah purata ADX, digabungkan dengan EMA purata bergerak indeks. Ia menghasilkan isyarat pembelian apabila DI + dan ADX melebihi 20 di atas DI +; ia menghasilkan isyarat jual apabila DI + dan ADX melebihi 25 di bawah DI +. Ia menghasilkan isyarat stop loss apabila DI + dan ADX melebihi 30 di atas DI.
Prinsip Strategi
Hitung DI+, DI- dan ADX
- Panggilan fungsi ta.dmi () untuk mengira DI+, DI- dan ADX
- DI+/DI- mencerminkan arah harga
- ADX mencerminkan purata perubahan harga
Mengira purata bergerak indeks EMA
- Panggil fungsi my_ema () untuk mengira EMA
- EMA boleh meluruskan data harga
Sinyal dagangan dihasilkan
- Sinyal beli: DI+ memakai DI- dan ADX> 20 dan harga penutupan> EMA
- Menerangkan trend kenaikan harga dan perubahan yang lebih besar
- Sinyal jual: DI-di bawah DI+ dan ADX> 25 dan harga penutupan < EMA
- Menjelaskan trend harga menurun dan perubahan yang lebih besar
- Sinyal beli: DI+ memakai DI- dan ADX> 20 dan harga penutupan> EMA
Hentikan kerugian
- Beli Hentikan Kerosakan: DI+ di atas DI dan ADX> 30
- Menerangkan trend harga berbalik
- Jual Hentikan Kerugian: DI+ Di bawah DI- dan ADX> 30
- Menerangkan trend harga berbalik
- Beli Hentikan Kerosakan: DI+ di atas DI dan ADX> 30
Secara keseluruhan, strategi ini menggabungkan penunjuk pergerakan dan penunjuk trend, menghasilkan isyarat perdagangan apabila harga cenderung kuat. Pada masa yang sama, menetapkan syarat berhenti untuk mengehadkan kerugian.
Analisis kelebihan
- Mengelakkan isyarat palsu dengan menggunakan ID ganda
- DI tunggal mudah menimbulkan isyarat yang salah, gabungan DI + dan DI - memastikan trend
- Syarat ADX memastikan perubahan harga yang lebih besar
- Berdagang hanya apabila turun naik harga meningkat, mengelakkan kejatuhan pasaran
- Syarat EMA berkerjasama dengan DI
- EMA berkesan mengenal pasti trend garis panjang dalam harga
- Syarat-syarat yang ketat
- Hentikan Kerosakan Pada Waktu Yang Tepat Untuk Elakkan Kerosakan Besar
Analisis risiko
- Kerosakan yang kerap
- Jika berlaku gegaran yang kuat, stop loss akan terlalu kerap
- Ketergantungan parameter
- DI dan ADX perlu dioptimumkan untuk mencari kombinasi terbaik
- Perdagangan rendah
- Syarat perdagangan yang lebih ketat akan mengurangkan kekerapan transaksi
Ia boleh dioptimumkan dengan meningkatkan frekuensi dagangan dengan memperluaskan margin stop loss, menyesuaikan kombinasi parameter, atau menambah syarat penapisan tambahan.
Arah pengoptimuman
- Optimumkan parameter
- Mengoptimumkan parameter DI dan ADX untuk mencari kombinasi parameter terbaik
- Tambah penapis
- Syarat penapis isyarat seperti penambahan jumlah transaksi, penyingkiran dan sebagainya
- Peningkatan margin stop loss
- Melepaskan syarat-syarat hentian yang sesuai, mengurangkan hentian yang kerap
ringkaskan
Strategi ini mengintegrasikan penunjuk pergerakan dan penunjuk analisis trend untuk menghasilkan isyarat perdagangan apabila harga cenderung. Mengatur risiko kawalan keadaan berhenti yang ketat. Kesan strategi dapat ditingkatkan lagi dengan mengoptimumkan parameter, menambah penapis isyarat, dan memperluas lebar berhenti yang sesuai.
/*backtest
start: 2024-01-01 00:00:00
end: 2024-01-31 23:59:59
period: 4h
basePeriod: 15m
exchanges: [{"eid":"Futures_Binance","currency":"BTC_USDT"}]
*/

// This Pine Script™ code is subject to the terms of the Mozilla Public License 2.0 at https://mozilla.org/MPL/2.0/
// © Tamil_FNO_Trader

//@version=5
strategy("Overlay Signals by TFOT", overlay=true)

// Calculate DMI
len = input.int(14, minval=1, title="DI Length")
lensig = input.int(14, title="ADX Smoothing", minval=1, maxval=50)
[diplus, diminus, adx] = ta.dmi(len, lensig)

// Get EMA
emalen = input.int(26, minval=1, title = "EMA Length")
emasrc = input.source(close, title = "EMA Source")

my_ema(src, length) =>
    alpha = 2 / (length + 1)
    sum = 0.0
    sum := na(sum[1]) ? src : alpha * src + (1 - alpha) * nz(sum[1])
EMA2 = my_ema(emasrc, emalen)

// Variables
var bool buycondition1 = false
var bool sellcondition1 = false

var int firstbuybar = na
var int firstsellbar = na

var int buyexitbar = na
var int sellexitbar = na

var bool buyexit1 = false
var bool sellexit1 = false

// Buy & Sell Conditions
buycondition1 := (ta.crossover(diplus, diminus)) and (adx > 20) and (close > EMA2) and na(firstbuybar)
sellcondition1 := (ta.crossover(diminus, diplus)) and (adx > 25) and (close < EMA2) and na(firstsellbar)

buyexit1 := ta.crossover(diminus, diplus) and (adx > 30) and na(buyexitbar)
sellexit1 := ta.crossover(diplus, diminus) and (adx > 30) and na(sellexitbar)

if buycondition1
    if(na(firstbuybar))
        firstbuybar := bar_index
        buyexitbar := na
        firstsellbar := na
        strategy.entry("Buy", strategy.long)

if sellcondition1
    if(na(firstsellbar))
        firstsellbar := bar_index
        sellexitbar := na
        firstbuybar := na
        strategy.entry("Sell", strategy.short)

if buyexit1 and not na(firstbuybar)
    if(na(buyexitbar))
        buyexitbar := bar_index
        firstbuybar := na
        firstsellbar := na
        strategy.close("Buy")

if sellexit1 and not na(firstsellbar)
    if(na(sellexitbar))
        sellexitbar := bar_index
        firstsellbar := na
        firstbuybar := na
        strategy.close("Sell")

// Plot signals on chart
hl = input.bool(defval = true, title = "Signal Labels")

plotshape(hl and buycondition1 and bar_index == firstbuybar ? true : na, "Buy", style = shape.labelup, location = location.belowbar, color = color.green, text = "Buy", textcolor = color.white, size = size.tiny)
plotshape(hl and sellcondition1 and bar_index == firstsellbar ? true : na, "Sell", style = shape.labeldown, location = location.abovebar, color = color.red, text = "Sell", textcolor = color.white, size = size.tiny)

plotshape(hl and buyexit1 and bar_index == buyexitbar ? true : na, "Buy Exit", style = shape.labelup, location = location.belowbar, color = color.red, text = "Buy X", textcolor = color.white, size = size.tiny)
plotshape(hl and sellexit1 and bar_index == sellexitbar ? true : na, "Sell Exit", style = shape.labeldown, location = location.abovebar, color = color.red, text = "Sell X", textcolor = color.white, size = size.tiny)