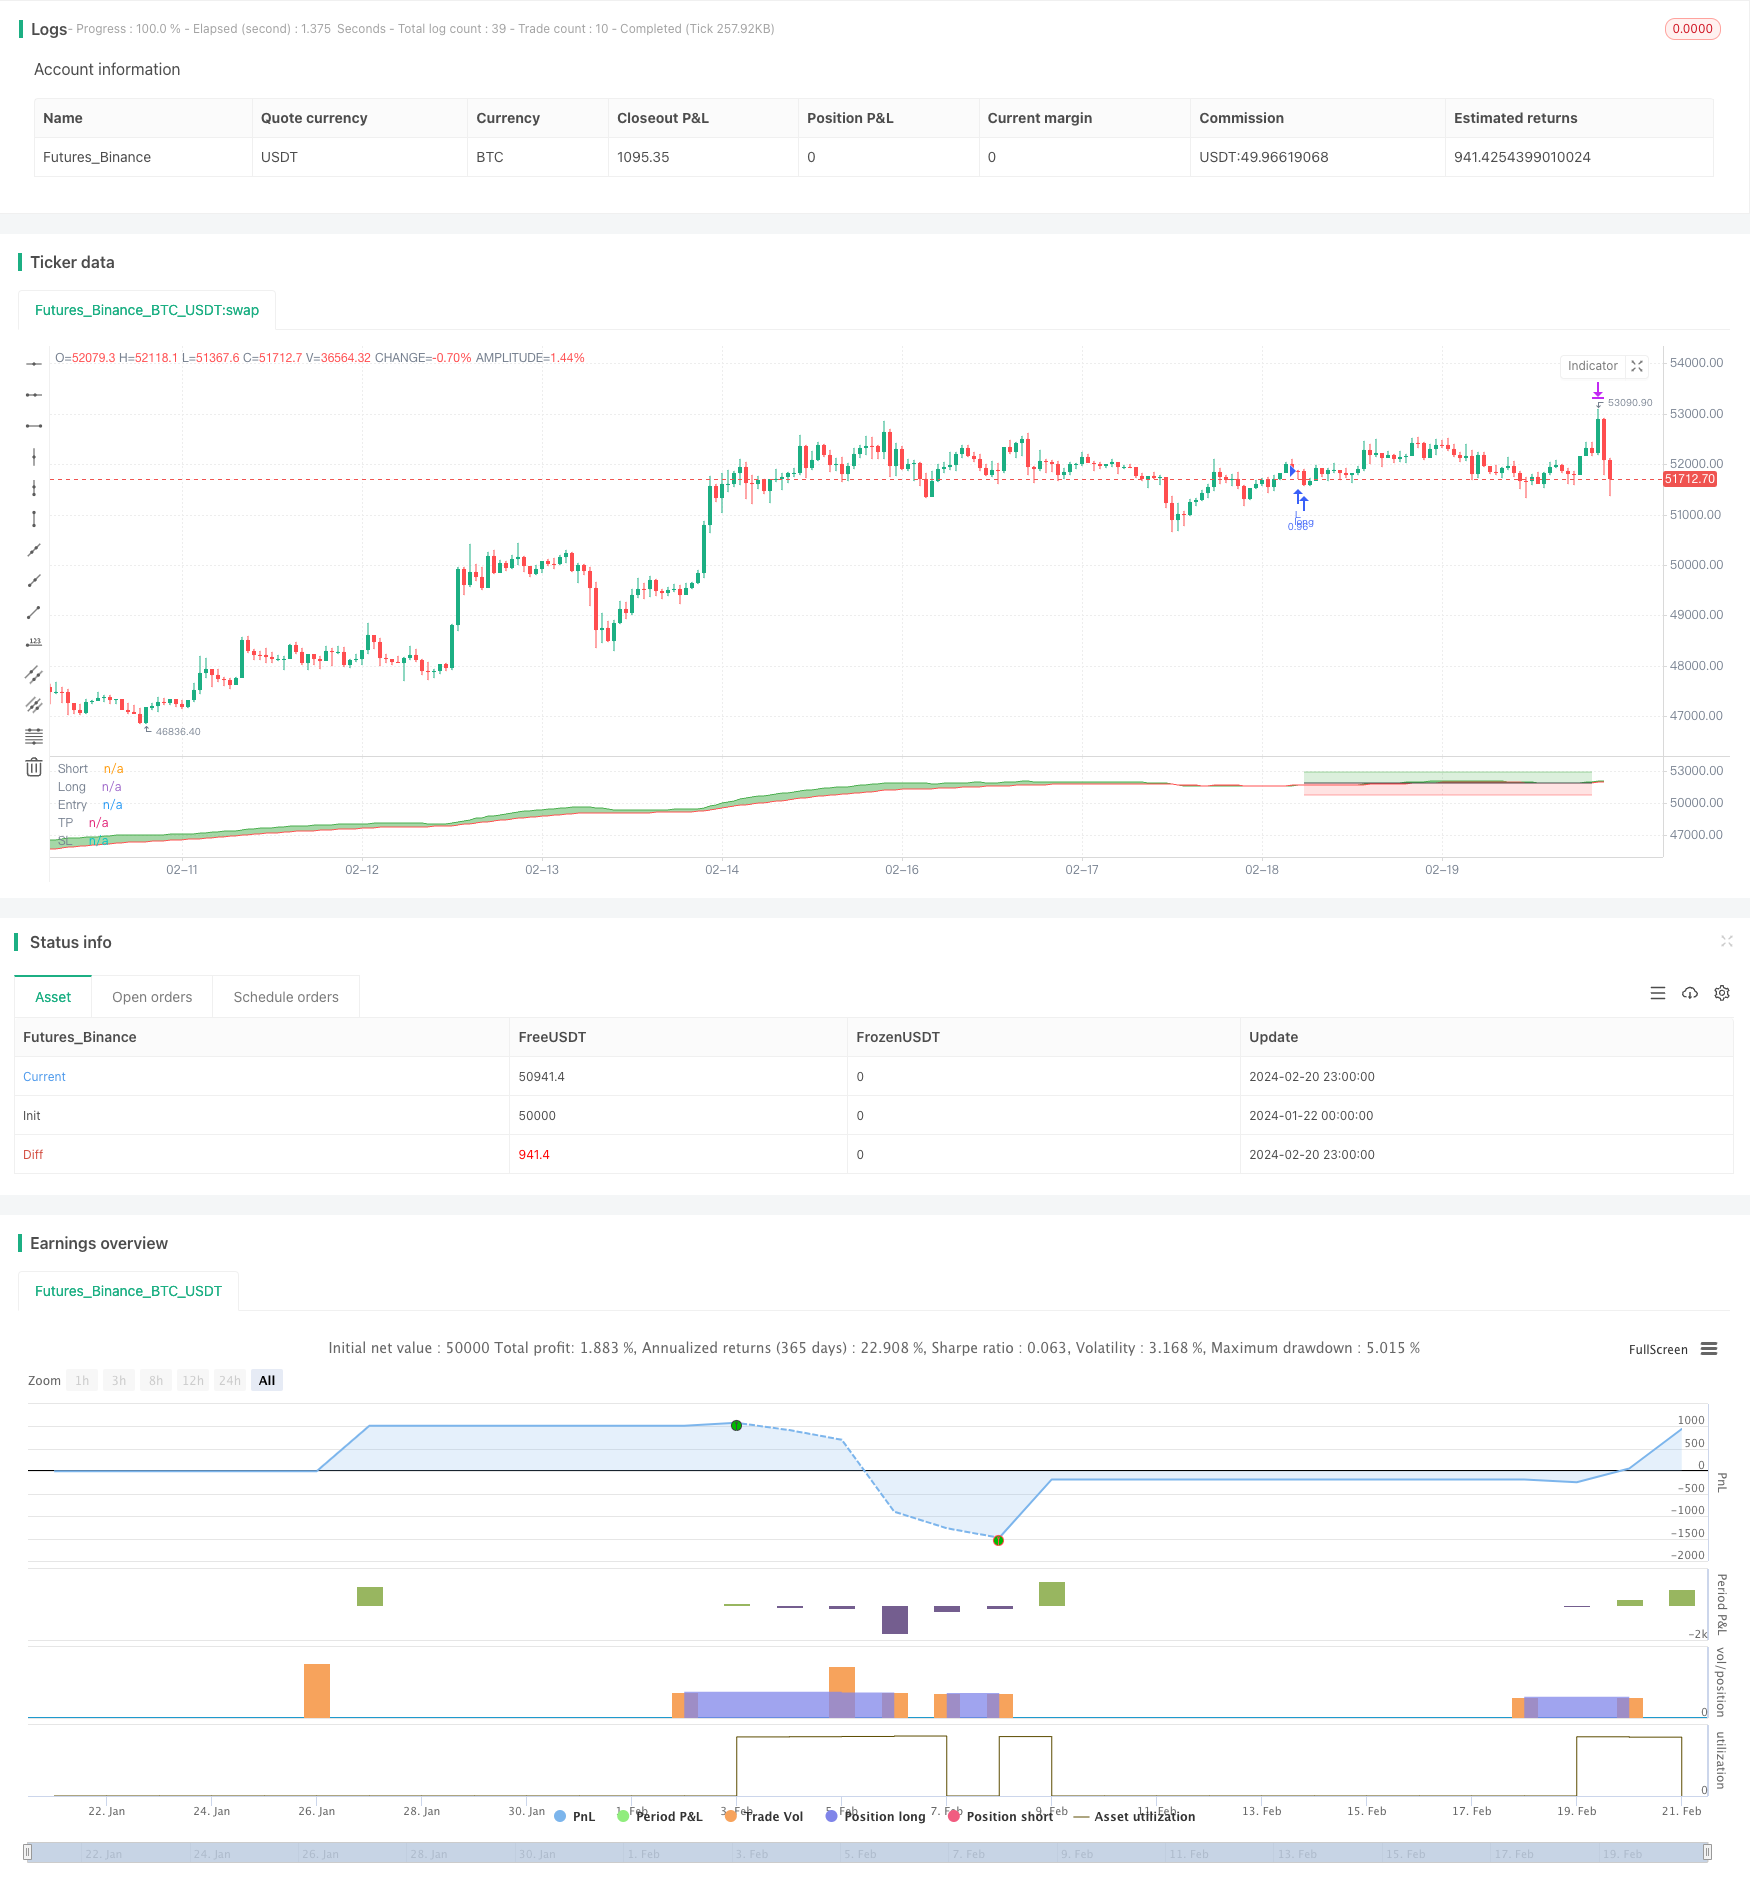
Strategi persilangan garisan pantas dan perlahan EMA berganda

Gambaran keseluruhan
Strategi Crossover EMA Ganda (Dual EMA Crossover Strategy) adalah strategi perdagangan kuantitatif yang berdasarkan pada dua EMA rata-rata crossover untuk membuka dan meletakkan kedudukan. Strategi ini sederhana, berkesan, mudah difahami, dan merupakan strategi perdagangan kuantitatif yang biasa digunakan.
Prinsip Strategi
Strategi ini menggunakan dua garis rata EMA, satu garis EMA 25 kitaran, sebagai garis cepat, dan satu garis EMA 50 kitaran, sebagai garis perlahan. Apabila melalui garis perlahan pada garis cepat, lakukan lebih banyak; apabila melalui garis perlahan di bawah garis cepat, kosong.
Selepas melakukan lebih banyak, atur stop sebagai 2% dari harga masuk, stop sebagai 2% dari harga masuk, dan apabila harga mencapai stop atau stop, selesaikan kedudukan tersebut.
Inti strategi ini adalah menggunakan persimpangan EMA untuk menentukan trend dan pembalikan pasaran. Apabila naik, ia dianggap sebagai pasaran lembu dan melakukan lebih banyak, dan apabila turun, ia dianggap sebagai pasaran beruang dan kosong. Tetapan berhenti untuk mengunci keuntungan dan mengawal risiko.
Analisis kelebihan
Strategi penyeberangan dua EMA mempunyai kelebihan berikut:
- Pemikiran yang jelas, logik yang mudah, dan pelaksanaan yang mudah difahami
- Garis laju dan garis perlahan digunakan bersama-sama untuk menangkap trend garis pendek dan tengah.
- Ia boleh menjadi satu peluang untuk menangkap titik perubahan pasaran tepat pada masanya.
- Pengendalian risiko di tempat, tetapan Stop Loss adalah munasabah
Secara keseluruhannya, strategi ini menilai pasaran dengan logik yang jelas, menggunakan kelebihan EMA itu sendiri, dan memperoleh keuntungan jangka pendek yang baik dengan risiko yang terkawal.
Analisis risiko
Terdapat beberapa risiko dalam strategi EMA dua hala:
- Apabila pasaran mengalami turun naik yang teruk, isyarat EMA mungkin tidak tepat dan terdapat kebarangkalian untuk salah penghakiman.
- Apabila titik penangguhan tidak ditetapkan dengan wajar, anda mungkin akan terlepas dari pasaran yang lebih besar atau menanggung kerugian yang lebih besar.
- Tidak boleh dipungkiri juga kesan kos transaksi dan slippage.
Semua risiko ini boleh diatasi dengan cara yang optimum dengan:
- Mengambil keputusan pasaran dengan menggunakan indikator lain, untuk mengelakkan salah faham EMA.
- Ujian dan pengoptimuman titik tetapan stop loss untuk mencari keseimbangan antara keuntungan dan risiko.
- Pilih platform dagangan dengan yuran rendah, dan tambahkan jumlah dagangan yang sesuai.
Arah pengoptimuman
Strategi ini juga mempunyai arah pengoptimuman utama berikut:
- Mengoptimumkan parameter kitaran EMA, mencari kombinasi parameter terbaik.
- Menambah penilaian indikator lain, membentuk portfolio perdagangan, meningkatkan ketepatan.
- Dinamika penyesuaian titik hentian hentian. Apabila kerugian mencapai tahap tertentu, titik hentian pengesanan meningkat, apabila keuntungan mencapai tahap tertentu, titik hentian bergerak dan sebagainya.
- Membezakan antara pasaran bertopeng dan kosong.
Pengoptimuman ini boleh meningkatkan kadar keuntungan dan kadar kemenangan dengan mengekalkan strategi yang mudah dan jelas.
ringkaskan
Strategi silang dua EMA secara keseluruhan adalah strategi perdagangan kuantitatif yang sangat praktikal. Ia mudah difahami dan dilaksanakan, menangkap tren pasaran dengan berkesan. Ia juga mempunyai ruang pengoptimuman tertentu, dengan penyesuaian dan kombinasi parameter dapat meningkatkan kadar pulangan lebih lanjut.
/*backtest
start: 2024-01-22 00:00:00
end: 2024-02-21 00:00:00
period: 1h
basePeriod: 15m
exchanges: [{"eid":"Futures_Binance","currency":"BTC_USDT"}]
*/

// SEMA-X(SEMA CROSS) [AB] : Simple EMA cross strategy Alert & Backtest
// 1. 2 EMA cross
// 2. Next candle entry
// 3. TP & SL

//@version=5
strategy("SEMA-X", "SEMA-X", overlay=false, margin_long=1,
 initial_capital=1000000, default_qty_type=strategy.percent_of_equity, default_qty_value=100,
 commission_type=strategy.commission.percent, commission_value=0.075, slippage=3)

//****************************************************************************//
// Input
//****************************************************************************//
// EMA length
emaLen25 = input.int(25, "Short", minval=1, confirm=true, group="[EMA]----------", inline="1")
emaLen50 = input.int(50, "Long",  minval=1, confirm=true, group="[EMA]----------", inline="1")

// TP & SL
isLong   = input.bool(true, "Long - ",    confirm=true, group="[TP & SL(%)]----------", inline="1")
tpLong   = input.float(2, "TP", minval=0, confirm=true, group="[TP & SL(%)]----------", inline="1")*0.01
slLong   = input.float(2, "SL", minval=0, confirm=true, group="[TP & SL(%)]----------", inline="1")*0.01
isShort  = input.bool(false, "Short - ",  confirm=true, group="[TP & SL(%)]----------", inline="2")
tpShort  = input.float(2, "TP", minval=0, confirm=true, group="[TP & SL(%)]----------", inline="2")*0.01
slShort  = input.float(2, "SL", minval=0, confirm=true, group="[TP & SL(%)]----------", inline="2")*0.01

// Backtest period
sTime = input(timestamp("0001-01-01"), "Start", group="[Backtest]----------")
eTime = input(timestamp("9999-01-01"), "End",   group="[Backtest]----------")
inDateRange   = true
periodBg      = input.bool(false, "Backtest BGcolor", confirm=true, group="[Backtest]----------", inline="1")
bgLong        = input.bool(false, "Position BGcolor", confirm=true, group="[Backtest]----------", inline="1")
periodBgColor = periodBg and inDateRange ? color.new(color.green, 95) : na
bgcolor(periodBgColor, title="Backtest BGcolor")
bgColorLong   = bgLong and strategy.position_size>0 ? color.new(color.green, 95) : na
bgcolor(bgColorLong, title="Position BGcolor")

// IRISBOT
exchange = input.string("binance",  "Exchange", confirm=true, group="[IRISBOT]----------", inline="2", options=["binance", "bybit", "upbit"])
account  = input.string("account1", "Account",  confirm=true, group="[IRISBOT]----------", inline="2")
symbol   = input.string("BTC/USDT", "Symbol",   confirm=true, group="[IRISBOT]----------", inline="3")
strategy = input.string("sema-x",   "Strategy", confirm=true, group="[IRISBOT]----------", inline="3")
token    = input.string("token",    "Token",    confirm=true, group="[IRISBOT]----------", inline="4")
stRatio  = input.float(100.0,       "Ratio(%)", confirm=true, group="[IRISBOT]----------", inline="5", tooltip="하나의 거래소에서 이 전략을 몇 % 비중으로 투자할 것인가?") * 0.01
leverage = input.float(1,           "Leverage", confirm=true, group="[IRISBOT]----------", inline="5")
isPlotMsg = input.bool(false, "View alert msg", confirm=true, group="[IRISBOT]----------", inline="6")

//****************************************************************************//
// Process
//****************************************************************************//
ema25=ta.ema(close, emaLen25)
ema50=ta.ema(close, emaLen50)

// Entry condition
longCondition  = isLong and ta.crossover(ema25, ema50)
shortCondition = isShort and ta.crossunder(ema25, ema50)

// Entry price
var price=0.0
var pricePlot=0.0
if (longCondition or shortCondition) and strategy.position_size == 0
    price:=close
pricePlot:=price
if (strategy.position_size==0)
    pricePlot:=na

// Amount
amount = str.tostring(stRatio*100)

// IRISBOT alert msg (for auto trading, you can change this for autoview, tvextbot, thanksbot, etc webhookbot)
msgLong  = '{"exchange":"'+exchange+'","account":"'+account+'","strategy":"'+strategy+'","symbol":"'+symbol+'","type":"market","side":"buy","amount":"'+amount+'%","leverage":"'+str.tostring(leverage)+'","token":"'+token+'"}'
msgShort = '{"exchange":"'+exchange+'","account":"'+account+'","strategy":"'+strategy+'","symbol":"'+symbol+'","type":"market","side":"sell","amount":"'+amount+'%","leverage":"'+str.tostring(leverage)+'","token":"'+token+'"}'
msgExit  = '{"exchange":"'+exchange+'","account":"'+account+'","strategy":"'+strategy+'","symbol":"'+symbol+'","type":"market","side":"close","token":"'+token+'"}'

// Entry signal
if inDateRange
    strategy.entry("L", strategy.long,  when=longCondition,  comment="L", alert_message=msgLong)
    strategy.entry("S", strategy.short, when=shortCondition, comment="S", alert_message=msgShort)
    strategy.exit("XL", "L", profit=price*tpLong/syminfo.mintick,  loss=price*slLong/syminfo.mintick,  comment="X", alert_message=msgExit)
    strategy.exit("XS", "S", profit=price*tpShort/syminfo.mintick, loss=price*slShort/syminfo.mintick, comment="X", alert_message=msgExit)

//****************************************************************************//
// Plot
//****************************************************************************//
// Alert msg plot
var msgTable = table.new(position = position.bottom_right, columns = 2, rows = 3, bgcolor = color.new(color.blue, 80), border_width = 1)
if isPlotMsg
    if isLong
        table.cell(msgTable, 0, 0, "Long",  text_halign = text.align_left)
        table.cell(msgTable, 1, 0, msgLong,  text_halign = text.align_left)

    if isShort
        table.cell(msgTable, 0, 1, "Short", text_halign = text.align_left, bgcolor=color.new(color.red, 80))
        table.cell(msgTable, 1, 1, msgShort, text_halign = text.align_left, bgcolor=color.new(color.red, 80))

    if isLong or isShort
        table.cell(msgTable, 0, 2, "Exit",  text_halign = text.align_left, bgcolor=color.new(color.purple, 80))
        table.cell(msgTable, 1, 2, msgExit,  text_halign = text.align_left, bgcolor=color.new(color.purple, 80))

// EMA
e0=plot(ema25, "Short", color.green)
e1=plot(ema50, "Long", color.red)
fill(e0, e1, ema25>ema50 ? color.new(color.green, 50) : color.new(color.red, 50), "EMA BG")

// TP & SL
p0=plot(pricePlot, "Entry", color.black, style=plot.style_linebr)
p1=plot(pricePlot*(strategy.position_size>0 ? 1+tpLong : 1-tpShort), "TP", color.new(color.green, 50), style=plot.style_linebr)
p2=plot(pricePlot*(strategy.position_size>0 ? 1-slLong : 1+slShort), "SL", color.new(color.red, 50), style=plot.style_linebr)
fill(p0, p1, color.new(color.green, 80), "TP BG")
fill(p0, p2, color.new(color.red, 80), "SL BG")