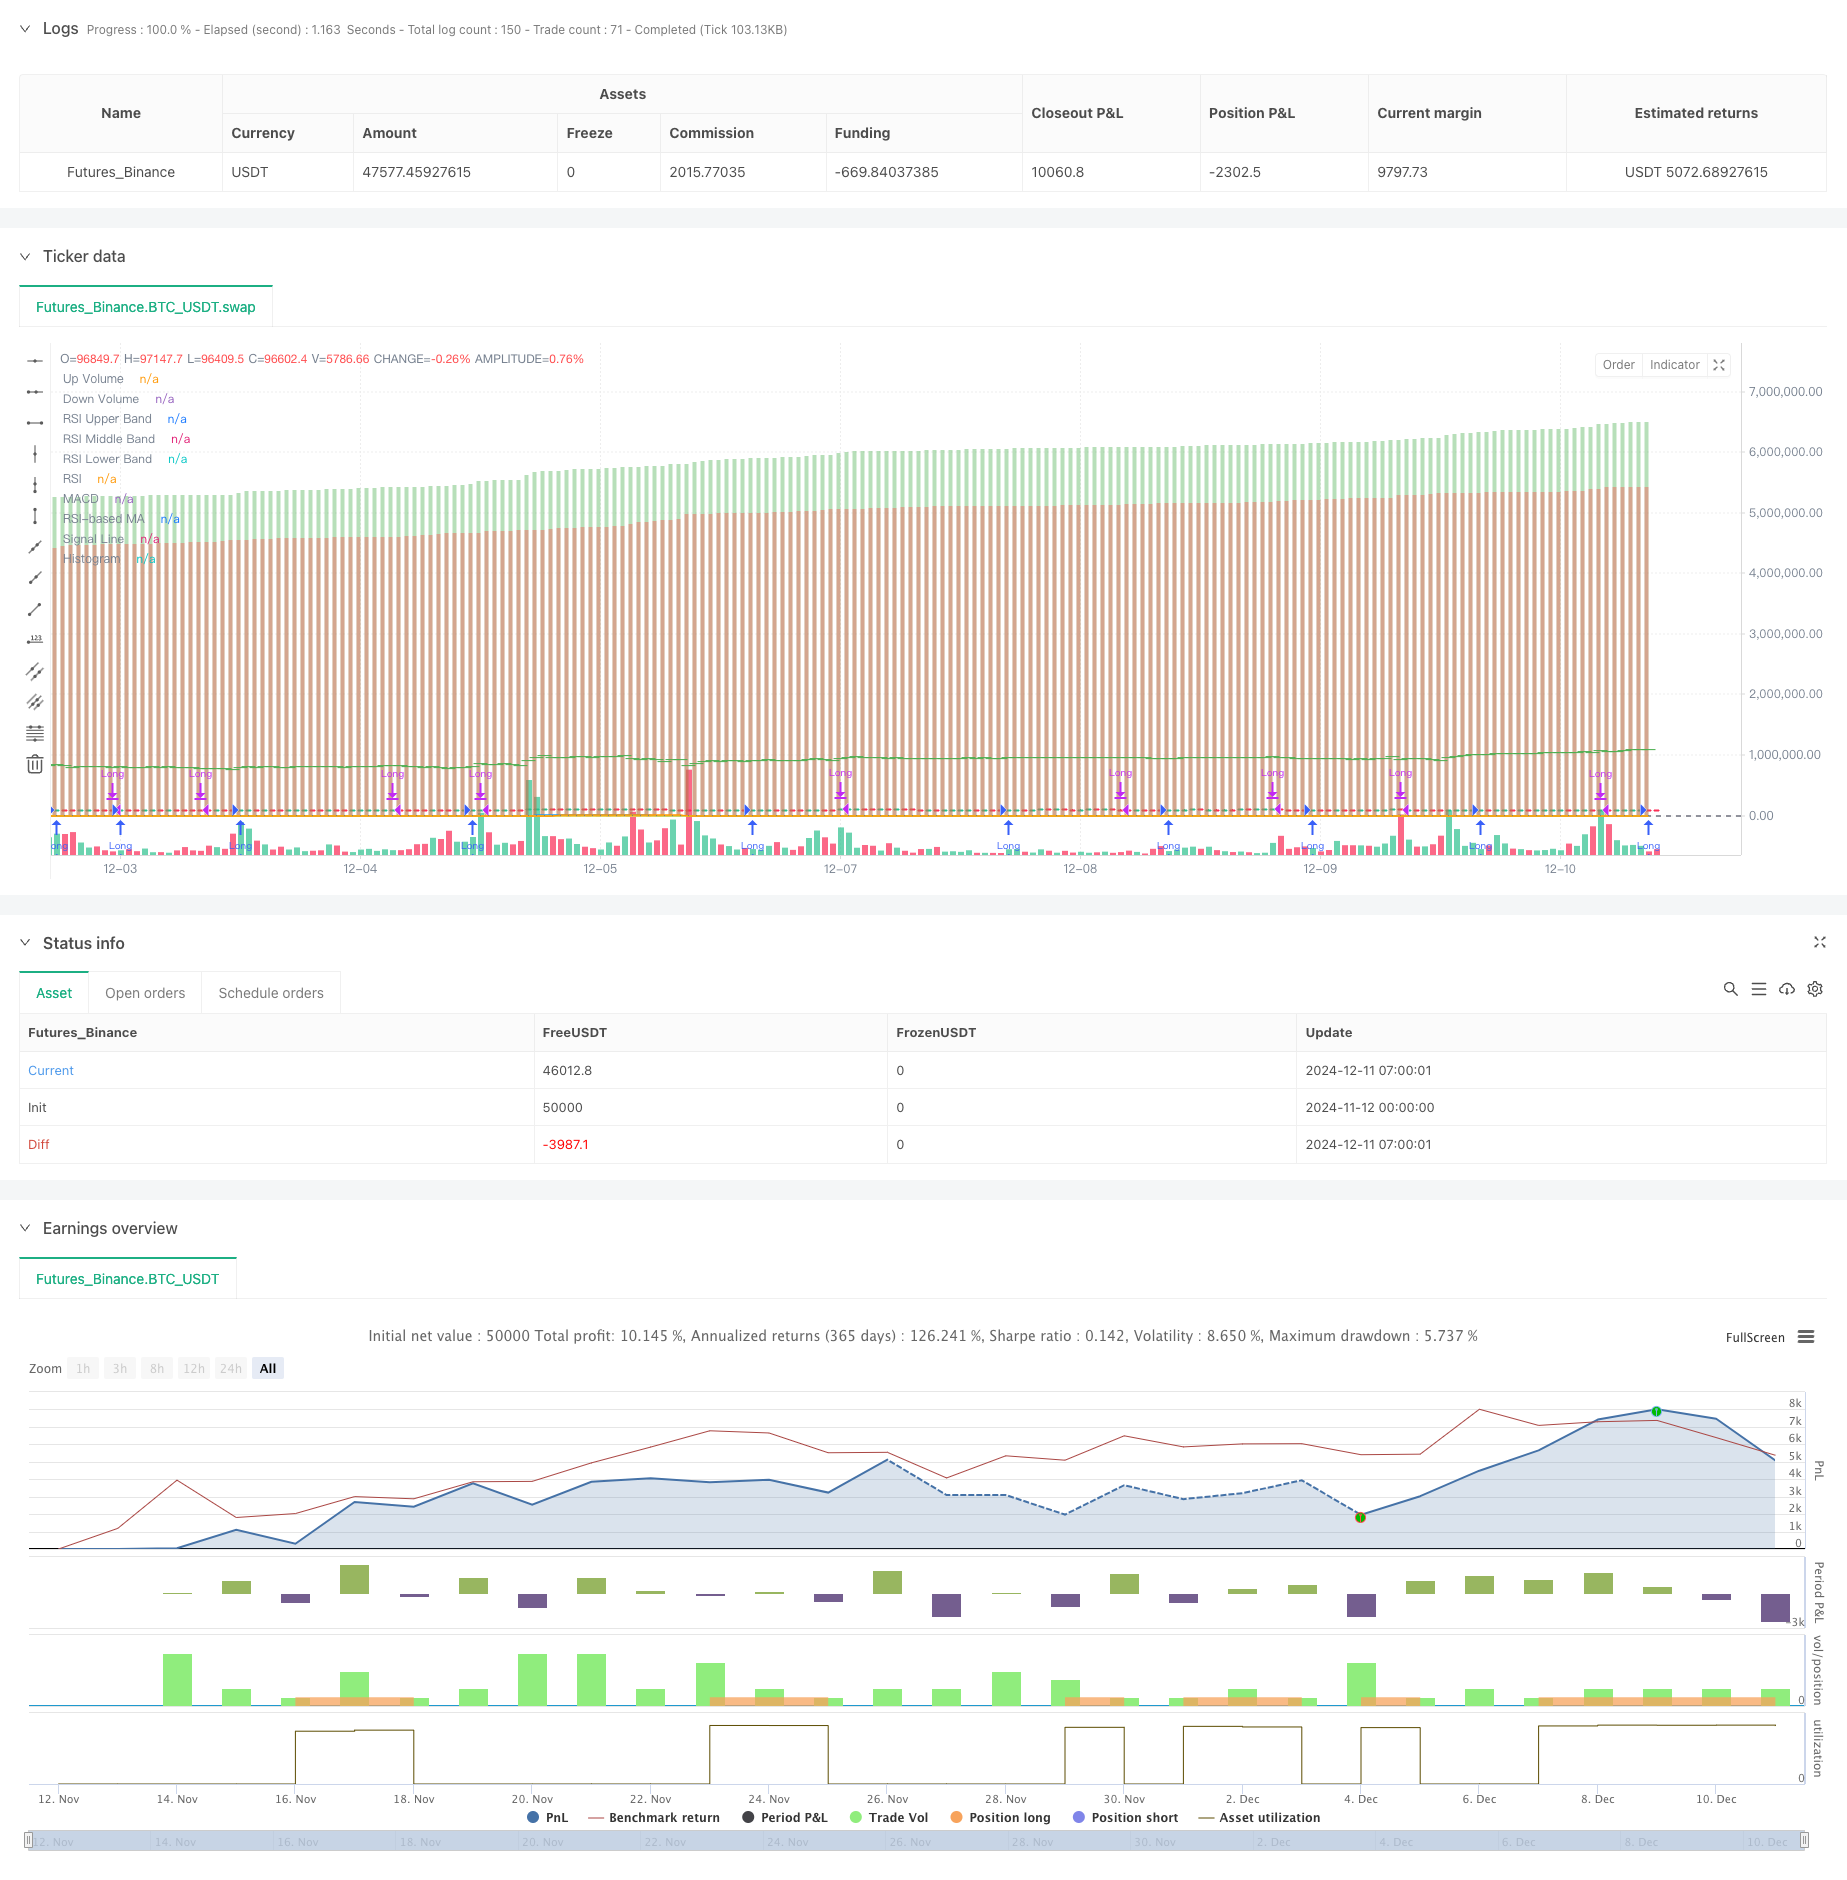
Gambaran keseluruhan
Strategi ini adalah sistem perdagangan komprehensif yang menggabungkan analisis indikator RSI ((Relative Strength), Moving Average Convergence Scatter Indicator ((MACD), Brinks ((BB) dan Volume ((Volume)). Strategi ini bekerja dengan koordinat indikator teknikal berbilang dimensi untuk melakukan analisis menyeluruh mengenai trend pasaran, turun naik dan jumlah transaksi, untuk mencari peluang perdagangan terbaik.
Prinsip Strategi
Logik teras strategi adalah berdasarkan aspek berikut:
- Menggunakan RSI ((14) untuk menilai keadaan pasaran overbought dan oversold, RSI di bawah 30 dianggap sebagai oversold
- Menggunakan MACD ((12,26,9) untuk menentukan arah trend, MACD Gold Fork berfungsi sebagai isyarat berbilang
- Keberkesanan pergerakan harga disahkan dengan mengira perbezaan antara peningkatan dan penurunan (Delta Volume)
- Kaedah ini digunakan untuk menilai turun naik harga dalam kombinasi dengan Brin untuk mengoptimumkan masa kemasukan.
- Sistem akan memberikan isyarat beli terbaik apabila RSI oversold, MACD Gold Fork dan Delta Volume adalah positif
- Apabila MACD Dead Fork atau RSI melebihi 60, sistem akan secara automatik menutup kedudukan untuk mengawal risiko
Kelebihan Strategik
- Pengujian silang pelbagai indikator meningkatkan kebolehpercayaan isyarat perdagangan
- Keupayaan trend harga disahkan melalui analisis kuantiti transaksi
- Pilihan jenis purata bergerak yang disesuaikan, meningkatkan fleksibiliti strategi
- Mempunyai mekanisme kawalan risiko yang baik, termasuk tetapan henti dan henti
- Parameter strategi boleh disesuaikan dengan keadaan pasaran yang berbeza
Risiko Strategik
- Kombinasi pelbagai indikator mungkin menyebabkan kelewatan isyarat
- Ia boleh menyebabkan isyarat palsu di pasaran.
- Pengoptimuman parameter yang berlebihan boleh menyebabkan pemasangan berlebihan
- Perdagangan frekuensi tinggi mungkin membawa kos transaksi yang lebih tinggi
- Ia mungkin menyebabkan penurunan yang lebih besar apabila pasaran berubah-ubah.
Arah pengoptimuman strategi
- Memperkenalkan mekanisme parameter penyesuaian, menyesuaikan parameter penunjuk mengikut keadaan pasaran yang dinamik
- Meningkatkan penapis intensiti trend, mengurangkan isyarat palsu di pasaran horizontal
- Mengoptimumkan mekanisme penangguhan kerugian dan meningkatkan kecekapan penggunaan dana
- Menyertai mekanisme penapisan kadar turun naik untuk menyesuaikan kedudukan dalam persekitaran turun naik yang tinggi
- Membangunkan Sistem Pengurusan Wang Cerdas untuk Mengendalikan Kedudukan Dinamis
ringkaskan
Ini adalah strategi perdagangan komposit yang menggabungkan pelbagai petunjuk teknikal untuk menangkap peluang pasaran melalui analisis pelbagai dimensi seperti RSI, MACD, dan jumlah transaksi. Strategi ini mempunyai kemampuan beradaptasi dan berskala yang kuat, serta mekanisme kawalan risiko yang baik. Dengan pengoptimuman dan penambahbaikan yang berterusan, strategi ini dijangka mengekalkan prestasi yang stabil dalam pelbagai keadaan pasaran.
/*backtest
start: 2024-11-12 00:00:00
end: 2024-12-11 08:00:00
period: 1h
basePeriod: 1h
exchanges: [{"eid":"Futures_Binance","currency":"BTC_USDT"}]
*/

//@version=5
strategy("Liraz sh Strategy - RSI MACD Strategy with Bullish Engulfing and Net Volume", overlay=true, currency=currency.NONE, initial_capital=100000, commission_type=strategy.commission.percent, commission_value=0.1, slippage=3)

// Input parameters
rsiLengthInput = input.int(14, minval=1, title="RSI Length", group="RSI Settings")
rsiSourceInput = input.source(close, "RSI Source", group="RSI Settings")
maTypeInput = input.string("SMA", title="MA Type", options=["SMA", "Bollinger Bands", "EMA", "SMMA (RMA)", "WMA", "VWMA"], group="MA Settings")
maLengthInput = input.int(14, title="MA Length", group="MA Settings")
bbMultInput = input.float(2.0, minval=0.001, maxval=50, title="BB StdDev", group="MA Settings")

fastLength = input.int(12, minval=1, title="MACD Fast Length")
slowLength = input.int(26, minval=1, title="MACD Slow Length")
signalLength = input.int(9, minval=1, title="MACD Signal Length")

startDate = input(timestamp("2018-01-01"), title="Start Date")
endDate = input(timestamp("2069-12-31"), title="End Date")

// Custom Up and Down Volume Calculation
var float upVolume = 0.0
var float downVolume = 0.0

if close > open
    upVolume += volume
else if close < open
    downVolume += volume

delta = upVolume - downVolume

plot(upVolume, "Up Volume", style=plot.style_columns, color=color.new(color.green, 60))
plot(downVolume, "Down Volume", style=plot.style_columns, color=color.new(color.red, 60))
plotchar(delta, "Delta", "—", location.absolute, color=delta > 0 ? color.green : color.red)

// MA function
ma(source, length, type) =>
    switch type
        "SMA" => ta.sma(source, length)
        "Bollinger Bands" => ta.sma(source, length)
        "EMA" => ta.ema(source, length)
        "SMMA (RMA)" => ta.rma(source, length)
        "WMA" => ta.wma(source, length)
        "VWMA" => ta.vwma(source, length)

// RSI calculation
up = ta.rma(math.max(ta.change(rsiSourceInput), 0), rsiLengthInput)
down = ta.rma(-math.min(ta.change(rsiSourceInput), 0), rsiLengthInput)
rsi = down == 0 ? 100 : up == 0 ? 0 : 100 - (100 / (1 + up / down))
rsiMA = ma(rsi, maLengthInput, maTypeInput)
isBB = maTypeInput == "Bollinger Bands"

// MACD calculation
fastMA = ta.ema(close, fastLength)
slowMA = ta.ema(close, slowLength)
macd = fastMA - slowMA
signalLine = ta.sma(macd, signalLength)
hist = macd - signalLine

// Bullish Engulfing Pattern Detection
bullishEngulfingSignal = open[1] > close[1] and close > open and close >= open[1] and close[1] >= open and (close - open) > (open[1] - close[1])
barcolor(bullishEngulfingSignal ? color.yellow : na)

// Plotting RSI and MACD
plot(rsi, "RSI", color=#7E57C2)
plot(rsiMA, "RSI-based MA", color=color.yellow)
hline(70, "RSI Upper Band", color=#787B86)
hline(50, "RSI Middle Band", color=color.new(#787B86, 50))
hline(30, "RSI Lower Band", color=#787B86)

bbUpperBand = plot(isBB ? rsiMA + ta.stdev(rsi, maLengthInput) * bbMultInput : na, title="Upper Bollinger Band", color=color.green)
bbLowerBand = plot(isBB ? rsiMA - ta.stdev(rsi, maLengthInput) * bbMultInput : na, title="Lower Bollinger Band", color=color.green)

plot(macd, title="MACD", color=color.blue)
plot(signalLine, title="Signal Line", color=color.orange)
plot(hist, title="Histogram", style=plot.style_histogram, color=color.gray)

// Best time to buy condition
bestBuyCondition = rsi < 30 and ta.crossover(macd, signalLine) and delta > 0

// Plotting the best buy signal line
var line bestBuyLine = na
if (bestBuyCondition )
    bestBuyLine := line.new(bar_index[1], close[1], bar_index[0], close[0], color=color.white)

// Strategy logic
longCondition = (ta.crossover(macd, signalLine) or bullishEngulfingSignal) and rsi < 70 and delta > 0
if (longCondition )
    strategy.entry("Long", strategy.long)

// Reflexive exit condition: Exit if MACD crosses below its signal line or if RSI rises above 60
exitCondition = ta.crossunder(macd, signalLine) or (rsi > 60 and strategy.position_size > 0)
if (exitCondition )
    strategy.close("Long")