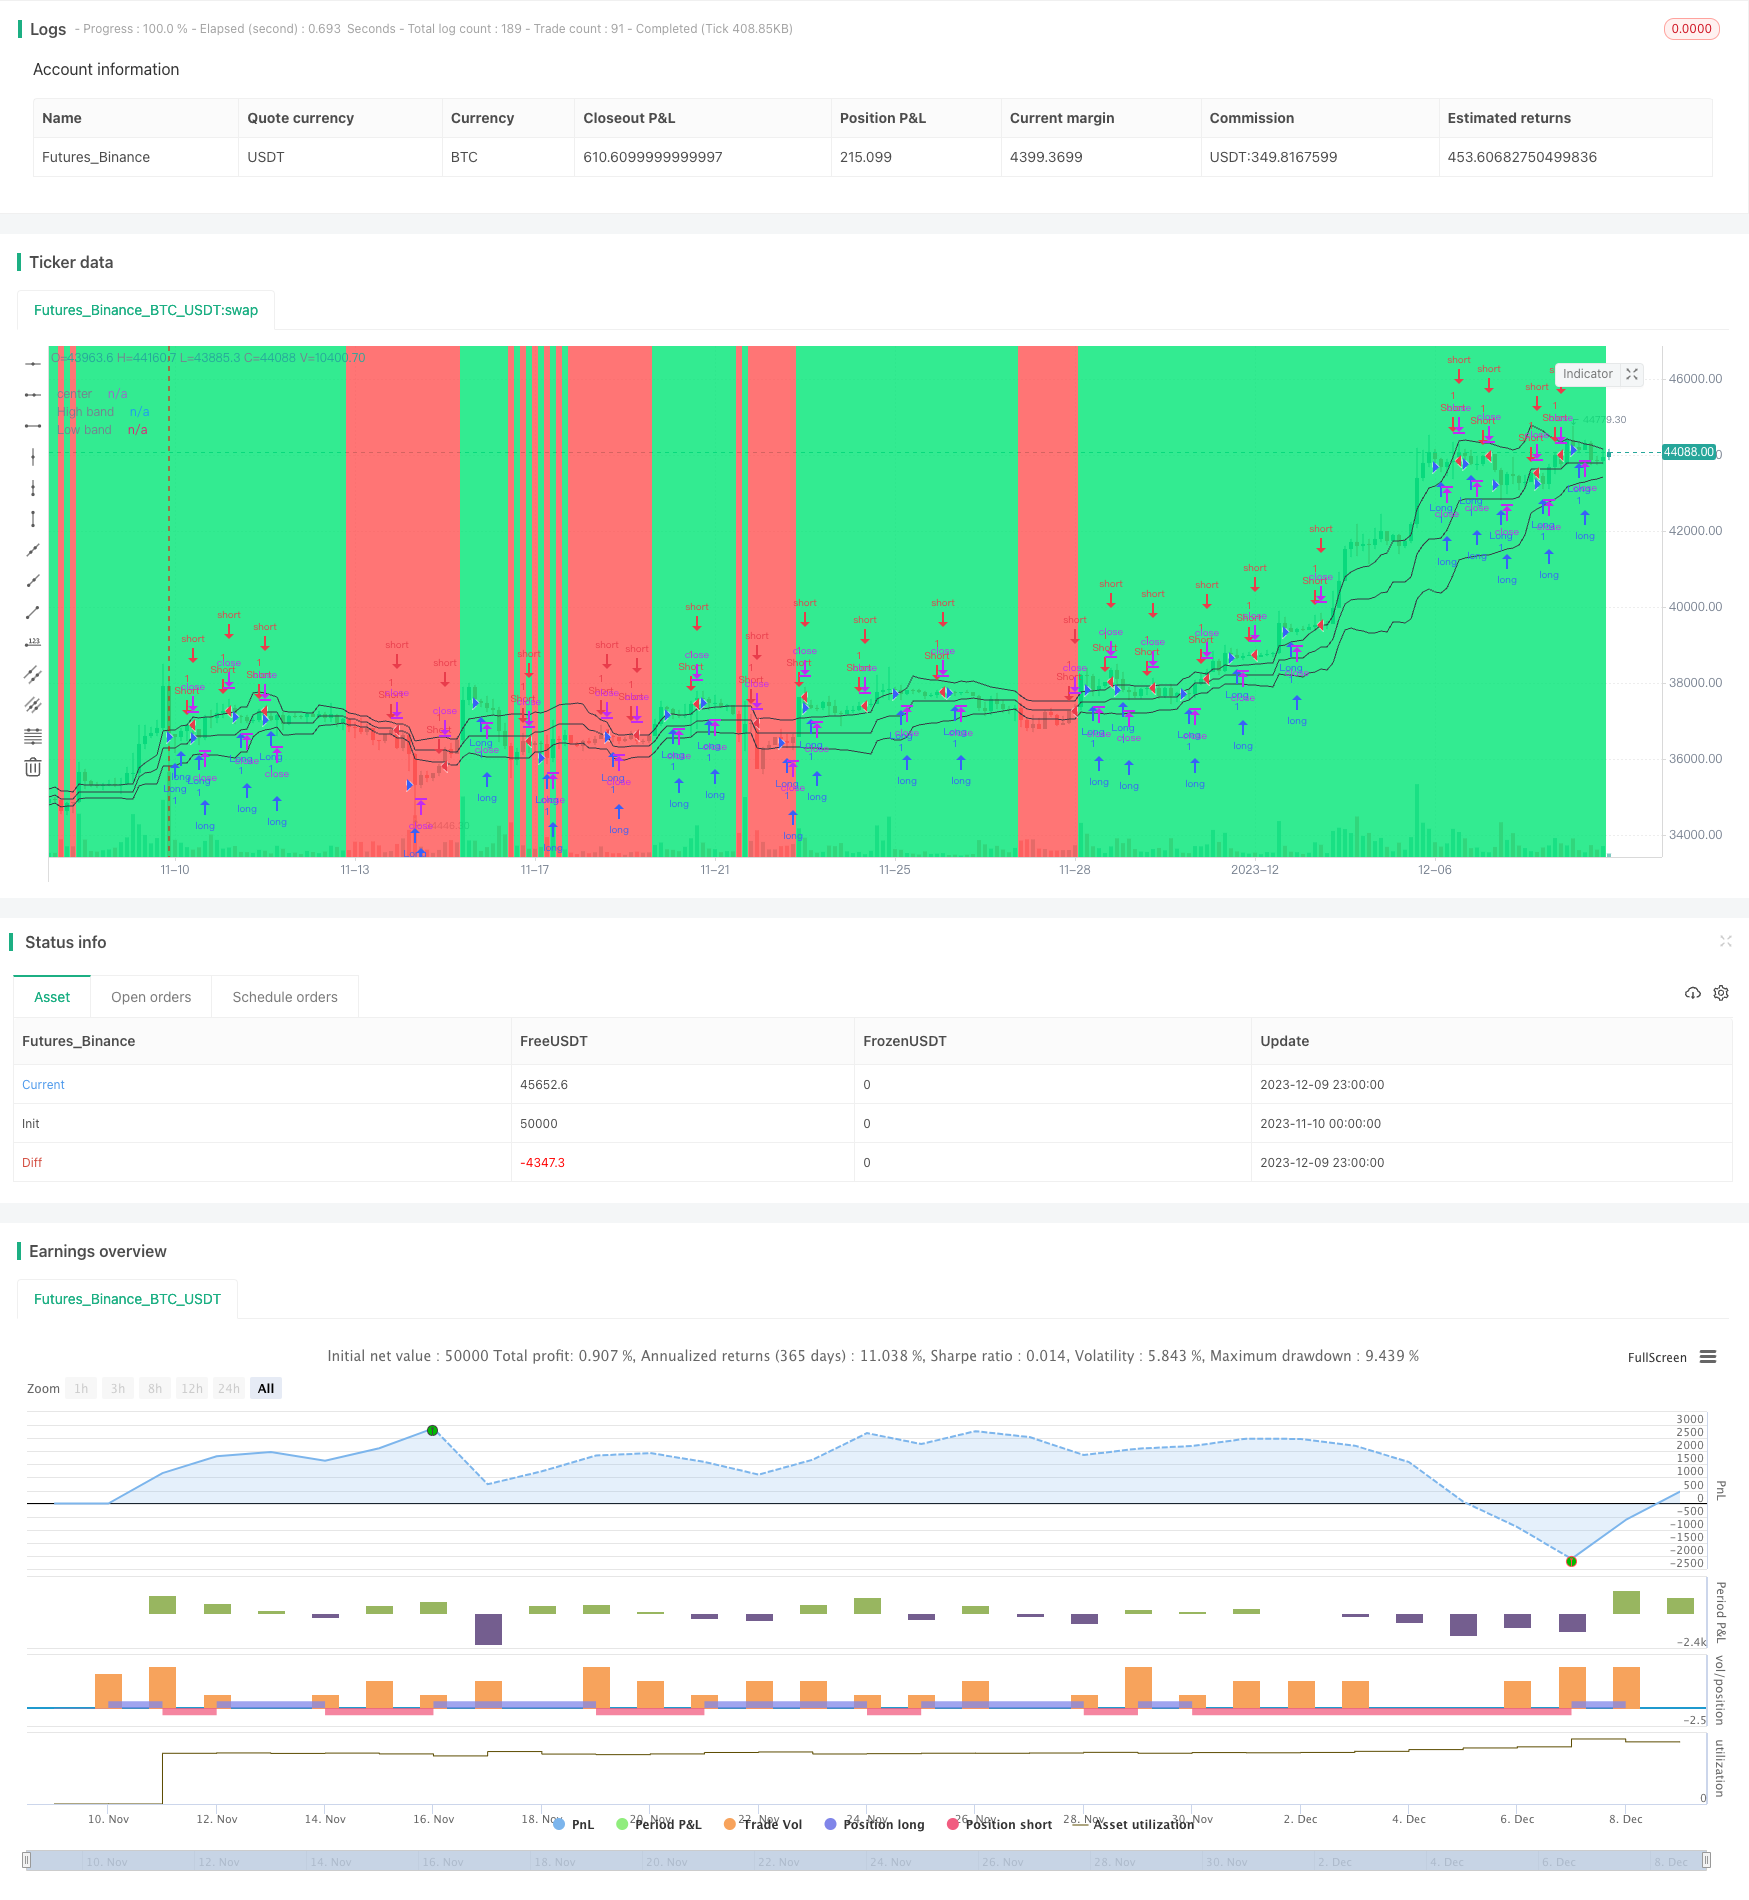
Estratégia de Scalping do Canal de Volatilidade Noro

Visão geral
O Noro’s Price Channel Scalping Strategy é uma estratégia de negociação de scalping baseada em canais de preços e bandas de preços. A estratégia usa canais de preços e flutuações de preços para identificar tendências de mercado e entrar em ação quando há uma reversão na direção da tendência.
Princípio da estratégia
A estratégia primeiro calcula os canais de preços mais altos (lasthigh) e mais baixos (lastlow) e, em seguida, calcula a linha média do canal de preços (center). Em seguida, calcula a distância entre o preço e a linha média (dist) e a média móvel simples da distância (distsma). Com base nisso, pode ser calculada uma faixa de flutuação de preços de 1x a linha média (hd e ld) e 2x a linha média (hd2 e ld2).
Quando o preço atravessa uma faixa de flutuação acima de 1x a linha média, é considerado um otimismo, quando o preço atravessa uma faixa de flutuação abaixo de 1x a linha média, é considerado um otimismo. A estratégia é executada quando surgem sinais de fracasso.
Vantagens estratégicas
- Usar o canal de preços para determinar a direção da tendência do mercado e evitar transações erradas
- A análise de tendências de falência baseada em flutuações de preços permite capturar pontos de inflexão com precisão.
- O método de negociação de escalpelamento para obter lucros rápidos
Risco estratégico
- Os canais de preços e os bandos de flutuação podem falhar quando os preços estão em alta.
- O scalping requer uma maior frequência de negociação, o que aumenta os custos de negociação e o risco de deslizamento.
- Uma estratégia de parada de prejuízos deve ser levada em consideração para controlar o risco de perdas
Otimização de Estratégia
- Parâmetros para otimizar canais e bandas de flutuação de preços, adaptando-se a mais situações de mercado
- Tendências e pontos de inflexão em combinação com outros indicadores
- Aumentar a estratégia de stop loss
- Considerando os custos de transação e os impactos de deslizamento
Resumir
A estratégia de escalpelamento de canal de neuro-ondas é, em geral, uma estratégia muito adequada para o escalpelamento. Ela usa canais de preços e bandas de flutuação para avaliar a tendência do mercado e abrir posições reversíveis quando há sinais de cima ou baixo. A estratégia tem uma alta frequência de negociação e ganhos rápidos, mas também enfrenta riscos.
/*backtest
start: 2023-11-10 00:00:00
end: 2023-12-10 00:00:00
period: 3h
basePeriod: 15m
exchanges: [{"eid":"Futures_Binance","currency":"BTC_USDT"}]
*/


//@version=2
strategy("Noro's Bands Scalper Strategy v1.0", shorttitle = "Scalper str 1.0", overlay=true, default_qty_type = strategy.percent_of_equity, default_qty_value=100.0, pyramiding=0)

//Settings
needlong = input(true, defval = true, title = "Long")
needshort = input(true, defval = true, title = "Short")
len = input(20, defval = 20, minval = 2, maxval = 200, title = "Period")
needbb = input(true, defval = true, title = "Show Bands")
needbg = input(true, defval = true, title = "Show Background")
src = close

//PriceChannel
lasthigh = highest(src, len)
lastlow = lowest(src, len)
center = (lasthigh + lastlow) / 2

//Distance
dist = abs(src - center)
distsma = sma(dist, len)
hd = center + distsma
ld = center - distsma
hd2 = center + distsma * 2
ld2 = center - distsma * 2

//Trend
trend = close < ld and high < hd ? -1 : close > hd and low > ld ? 1 : trend[1]

//Lines
colo = needbb == false ? na : black
plot(hd, color = colo, linewidth = 1, transp = 0, title = "High band")
plot(center, color = colo, linewidth = 1, transp = 0, title = "center")
plot(ld, color = colo, linewidth = 1, transp = 0, title = "Low band")

//Background
col = needbg == false ? na : trend == 1 ? lime : red
bgcolor(col, transp = 80)

//Signals
bar = close > open ? 1 : close < open ? -1 : 0
up7 = trend == 1 and bar == -1 and bar[1] == -1 ? 1 : 0
dn7 = trend == 1 and bar == 1 and bar[1] == 1 and close > strategy.position_avg_price ? 1 : 0
up8 = trend == -1 and bar == -1 and bar[1] == -1 and close < strategy.position_avg_price ? 1 : 0
dn8 = trend == -1 and bar == 1 and bar[1] == 1 ? 1 : 0

if up7 == 1 or up8 == 1
    strategy.entry("Long", strategy.long, needlong == false ? 0 : trend == -1 ? 0 : na)

if dn7 == 1 or dn8 == 1
    strategy.entry("Short", strategy.short, needshort == false ? 0 : trend == 1 ? 0 : na)