Estratégia de transformação do índice de oscilador
Autora:ChaoZhang, Data: 2023-12-22 14:21:28Tags:

Resumo
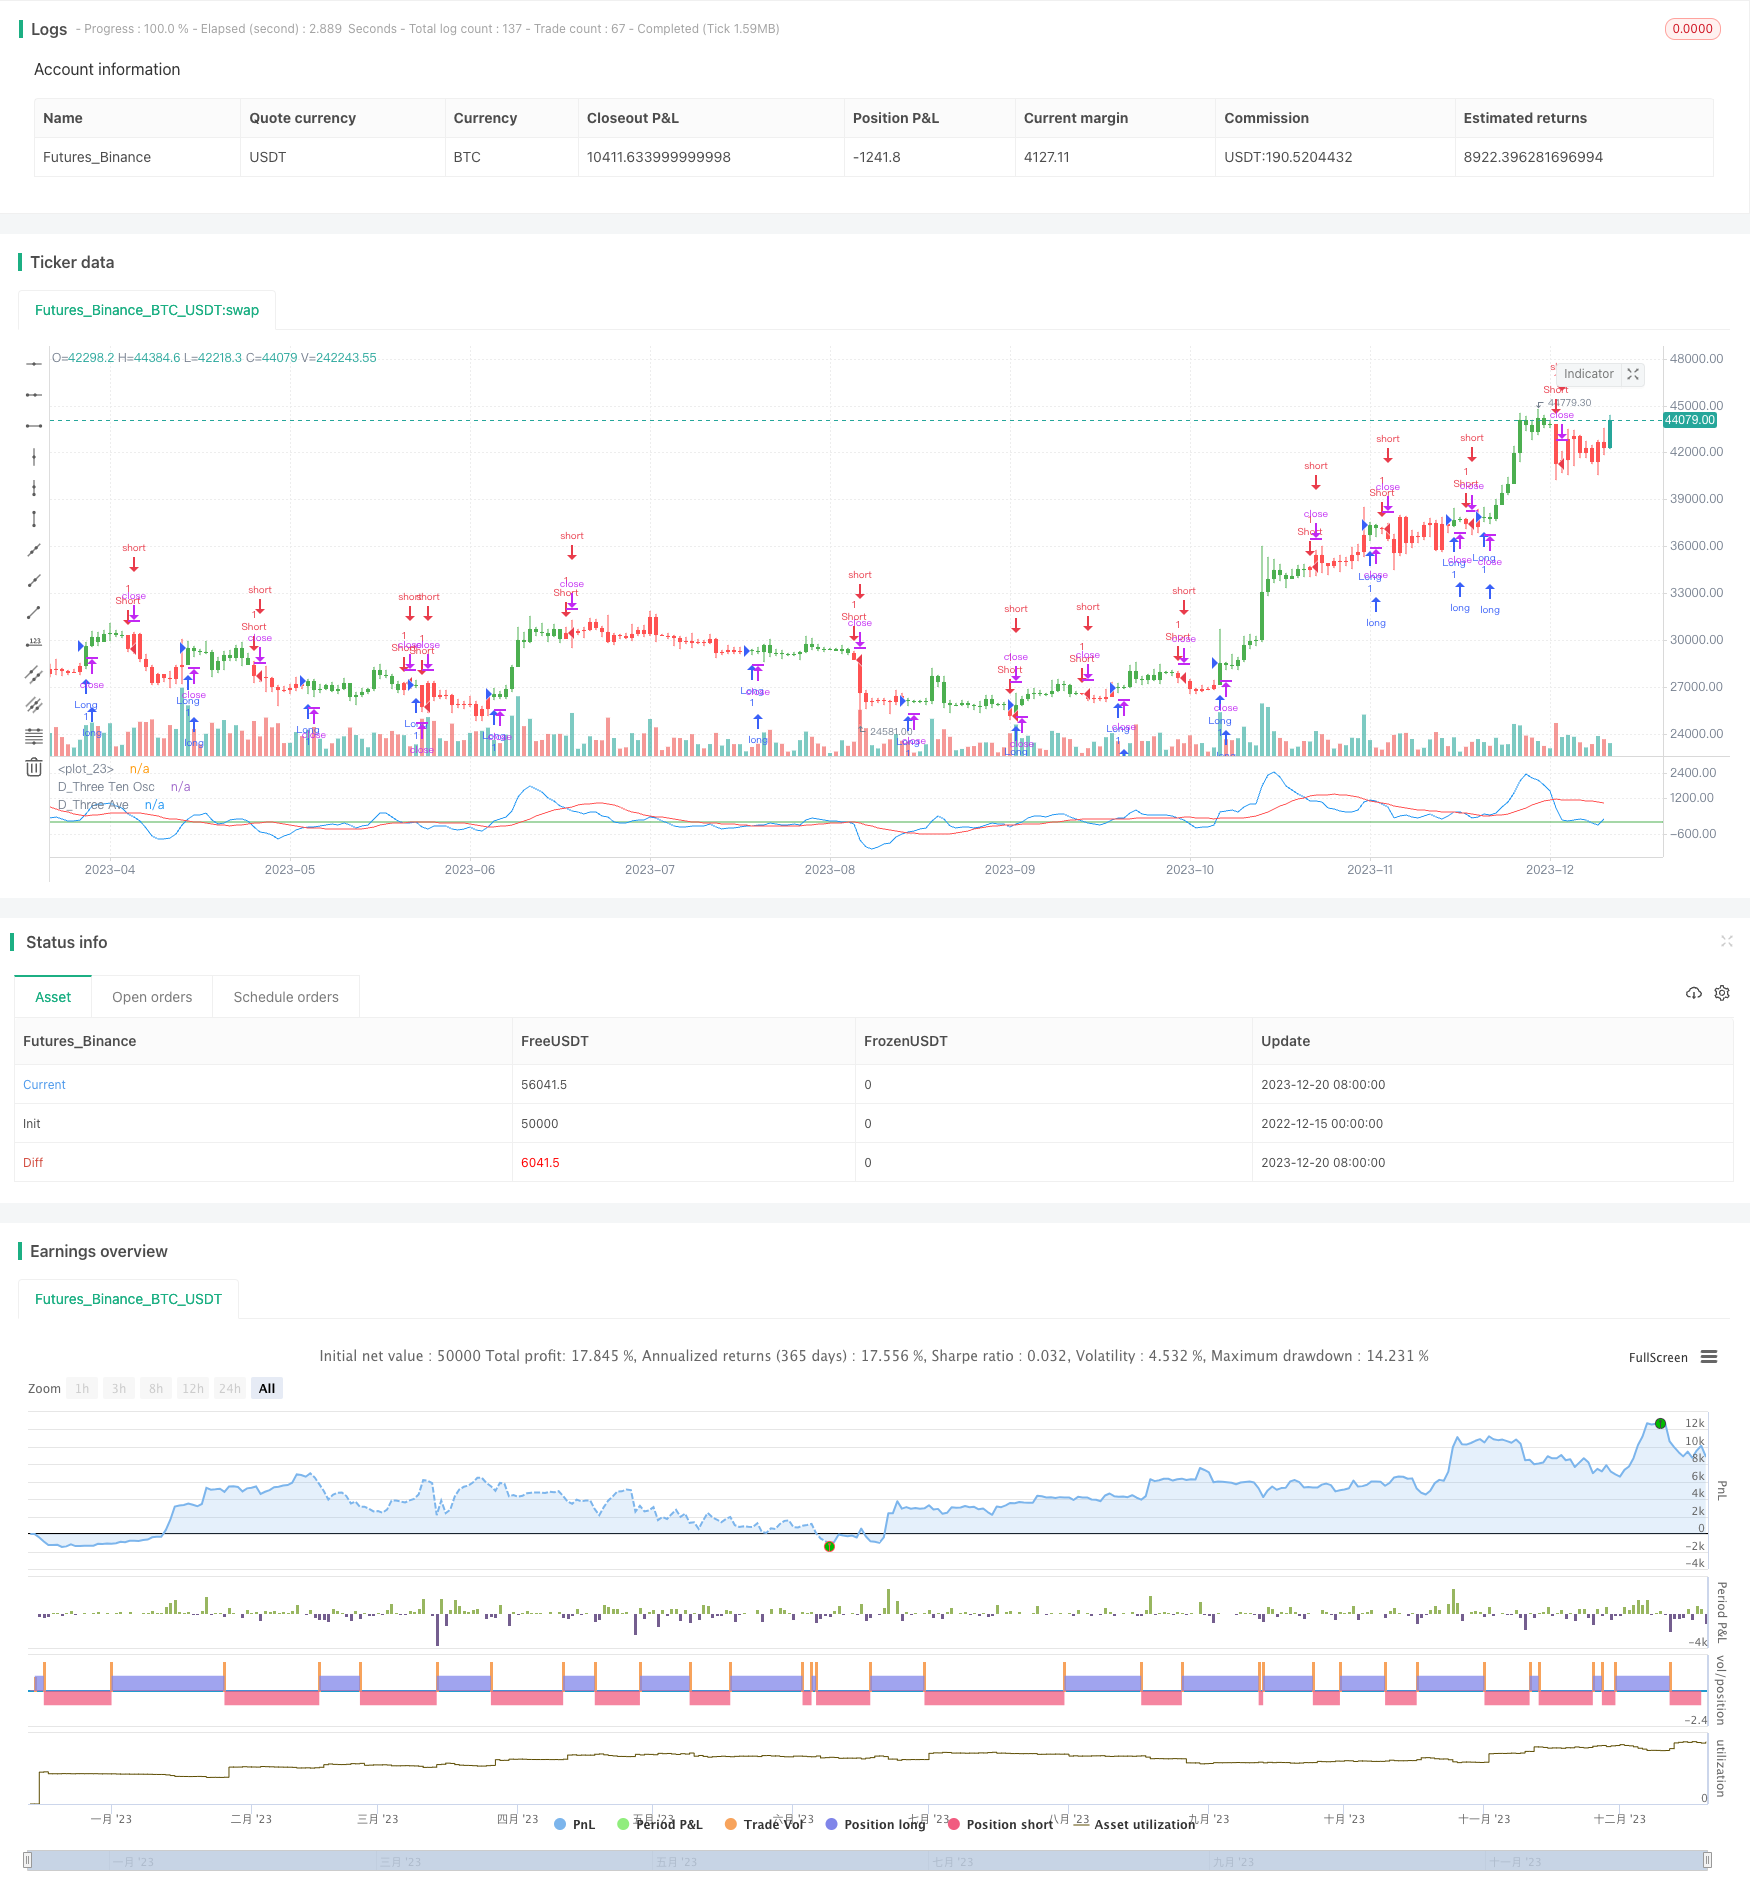
A estratégia de Transformação do Índice de Oscilador utiliza os crossovers entre o índice de oscilador 3-10 de Bressert e sua média móvel simples de 16 dias para gerar sinais de negociação.
Estratégia lógica
A estratégia é baseada no índice do oscilador 3-10 de Bressert, que é a diferença entre as médias móveis exponenciais de 3 e 10 dias.
Especificamente, a estratégia primeiro calcula a EMA de 3 dias, a EMA de 10 dias e sua diferença como o índice do oscilador. Em seguida, calcula a média móvel simples de 16 dias do índice do oscilador como a linha de sinal.
Análise das vantagens
- Usa o índice clássico do oscilador de Bressert que é bastante eficaz
- Forma sinais comerciais claros com cruzamento rápido e lento de linhas
- Permite que as operações de reversão se adaptem aos diferentes regimes de mercado
- Pode ser utilizado tanto na negociação intradiária como na negociação overnight
Análise de riscos
- O desempenho do oscilador de Bressert é instável com flutuações de lucro/perda
- Os cruzamentos rápidos e lentos podem gerar sinais falsos
- As operações de reversão apresentam riscos mais elevados e devem ser utilizadas com cautela
- Requer stop loss para operações intradiárias e dimensionamento de posições para operações overnight
Orientações de otimização
- Otimizar os parâmetros ajustando os períodos da média móvel
- Adicionar filtros usando outros indicadores ou ações de preço
- Adicionar estratégia de stop loss para limitar o tamanho das perdas de uma única transação
- Otimizar a gestão do capital para reduzir o impacto global da utilização
Conclusão
A estratégia de transformação do índice de oscilador é uma estratégia de negociação de curto prazo que gera sinais de 3-10 osciladores e cruzamentos de linhas de sinal. É simples e prático para uso intradiário e overnight, mas tem flutuações inerentes de PnL e riscos de falsos sinais. Filtros adicionais, stop loss e dimensionamento de posição são necessários para refinar a estratégia. Com a otimização adequada, pode alcançar um alfa consistente.
/*backtest
start: 2022-12-15 00:00:00
end: 2023-12-21 00:00:00
period: 1d
basePeriod: 1h
exchanges: [{"eid":"Futures_Binance","currency":"BTC_USDT"}]
*/

//@version=2
////////////////////////////////////////////////////////////
//  Copyright by HPotter v1.0 27/03/2017
// TradeStation does not allow the user to make a Multi Data Chart with
// a Tick Bar Chart and any other type a chart. This indicator allows the
// user to plot a daily 3-10 Oscillator on a Tick Bar Chart or any intraday interval.
// Walter Bressert's 3-10 Oscillator is a detrending oscillator derived
// from subtracting a 10 day moving average from a 3 day moving average.
// The second plot is an 16 day simple moving average of the 3-10 Oscillator.
// The 16 period moving average is the slow line and the 3/10 oscillator is
// the fast line.
// For more information on the 3-10 Oscillator see Walter Bressert's book
// "The Power of Oscillator/Cycle Combinations"
//
// You can change long to short in the Input Settings
// Please, use it only for learning or paper trading. Do not for real trading.
////////////////////////////////////////////////////////////
strategy(title="D_Three Ten Osc", shorttitle="D_Three Ten Osc")
Length1 = input(3, minval=1)
Length2 = input(10, minval=1)
Length3 = input(16, minval=1)
reverse = input(false, title="Trade reverse")
hline(0, color=green, linestyle=line)
xPrice =  request.security(syminfo.tickerid,"D", hl2)
xfastMA = ema(xPrice, Length1)
xslowMA = ema(xPrice, Length2)
xMACD = xfastMA - xslowMA
xSignal = sma(xMACD, Length3)
pos = iff(xSignal > xMACD, -1,
	     iff(xSignal < xMACD, 1, nz(pos[1], 0)))
possig = iff(reverse and pos == 1, -1,
          iff(reverse and pos == -1, 1, pos))
if (possig == 1)
    strategy.entry("Long", strategy.long)
if (possig == -1)
    strategy.entry("Short", strategy.short)
barcolor(possig == -1 ? red: possig == 1 ? green : blue )
plot(request.security(syminfo.tickerid, "D", xMACD), color=blue, title="D_Three Ten Osc")
plot(request.security(syminfo.tickerid, "D", xSignal), color=red, title="D_Three Ave")
- Scalping rápido RSI Switching Strategy v1.7
- Estratégia quantitativa de cruzamento da média móvel
- Estratégia de RSI de reversão de ruptura sobressoldada
- Estratégia de acompanhamento da tendência da média móvel dupla de banda de Bollinger
- Estratégia de negociação de futuros XBT baseada em sentimentos
- Estratégia de inversão de momento SAR parabólica
- Estratégia de negociação quantitativa baseada na decomposição do modo empírico
- Estratégia dinâmica de pirâmide
- Estratégia de negociação de tendência de volume do RSI YinYang
- Estratégia do Scalper de tendência Quad MA
- Estratégia de acompanhamento da tendência do MACD de dupla média móvel Golden Cross Dead Cross
- Esta é uma estratégia de negociação quantitativa experimental.
- A estratégia das faixas de Bollinger Crossover da média móvel única
- A estratégia de ruptura do RSI é uma estratégia quantitativa de negociação
- A estratégia de cruzamento da média móvel é uma estratégia quantitativa de negociação
- Estratégia de negociação de média móvel de ruptura de impulso
- Estratégia de negociação da média móvel exponencial de Heiken Ashi lenta
- Estratégia de negociação algorítmica de alto desempenho baseada em modelos quantitativos
- Estratégia de ruptura do Bollinger Momentum
- Parabólica SAR e estratégia de acompanhamento da tendência da EMA