Estratégia de rastreamento de tendências da Bohr Steel
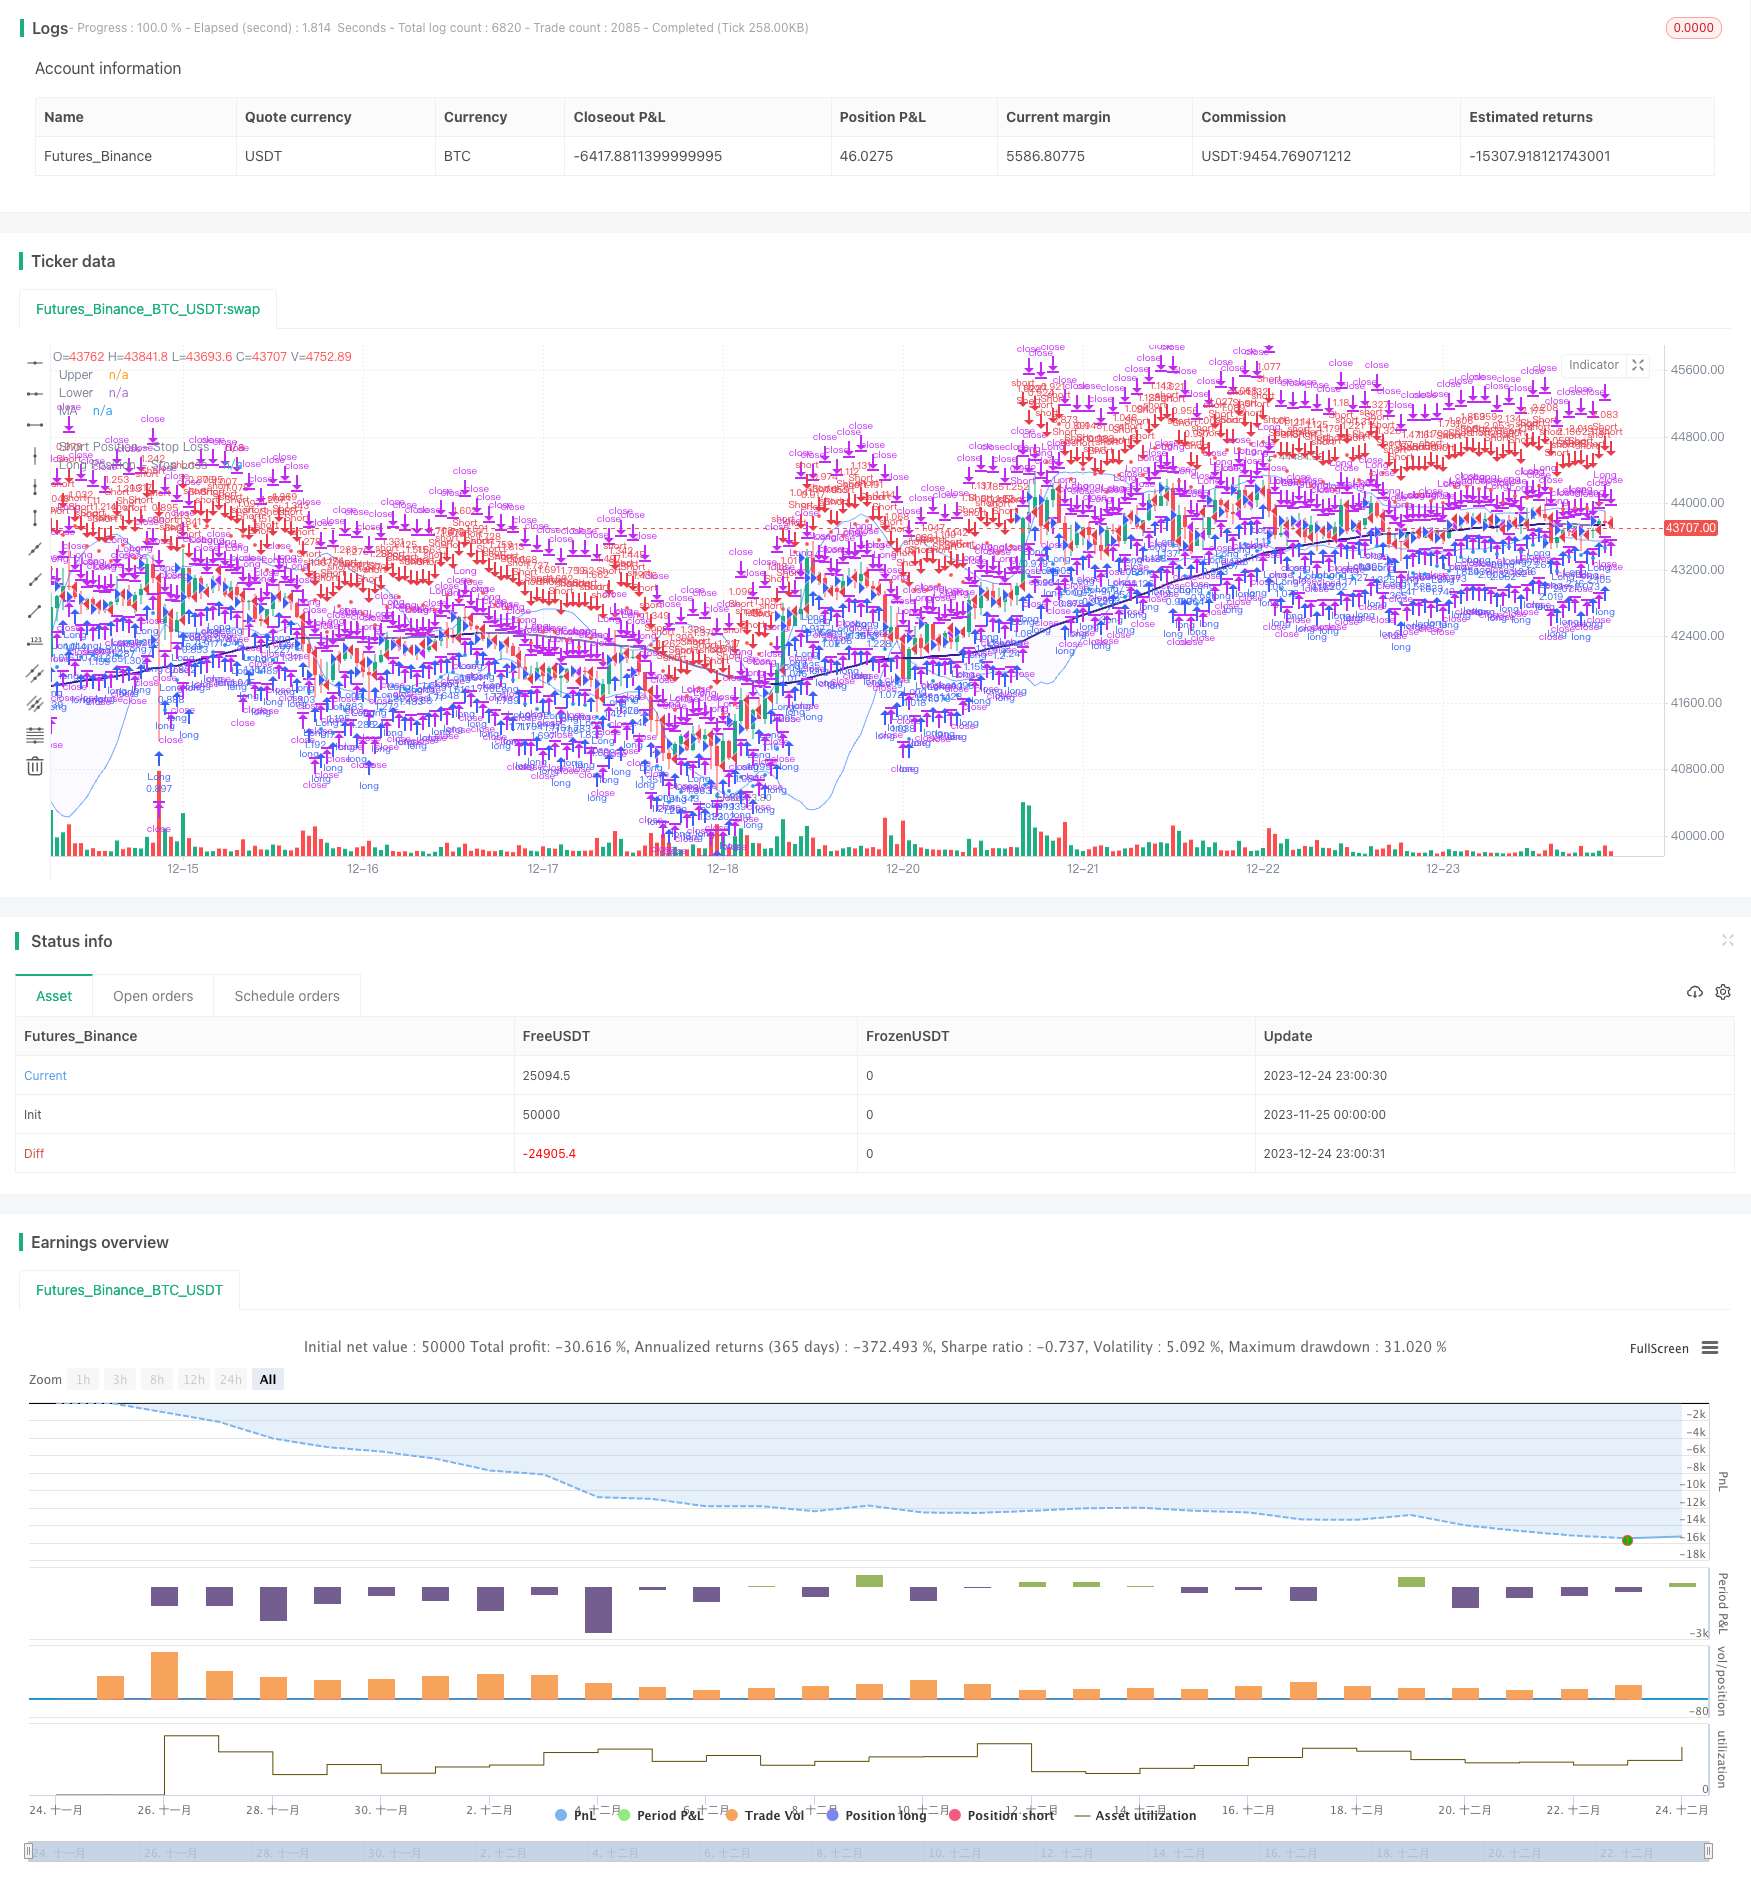
Visão geral
A estratégia baseia-se em bandas de Bol, médias móveis e análise de volume de transação para implementar uma estratégia de acompanhamento de tendências robusta. A estratégia visa capturar potenciais reversões de tendências e aproveitar a dinâmica do mercado.
Princípio da estratégia
Faixa de aço de Bor
O uso de uma faixa de aço de borla para identificar o estado de sobrecompra e sobrevenda do mercado. Ajuda na tomada de decisão por meio de uma visualização clara dos trilhos para cima e para baixo.
O princípio básico da faixa de aço de Bohr é o cálculo de um trajeto ascendente e descendente com base no valor médio e diferencial padrão do preço das ações em um determinado período. O trajeto ascendente do preço das ações é um sinal de supercompra e o trajeto descendente é um sinal de supervenda.
Filtros de média móvel
Implementar filtros de média móvel para aumentar a identificação de tendências. Os usuários podem escolher entre diferentes tipos de média móvel, como média móvel simples, média móvel indexada e média móvel ponderada.
Quando o preço atravessa a média móvel, um sinal de compra (ou venda) é gerado.
Análise de entrega
Permite aos usuários integrar a análise de volume de negócios nas estratégias para a confirmação de sinais. Colunas de quantidade de cores diferentes indicam que o volume de negócios está acima ou abaixo da média.
O volume de transações que ultrapassa a média pode ser usado para confirmar o sinal de preço.
Análise de vantagens
Uma estratégia sólida de acompanhamento de tendências
A inversão de tendência do mercado baseada em bandas de aço de Bol, médias móveis e volume de transação identificado.
A capacidade de capturar tendências de preços em tempo real e acompanhar as tendências para obter lucros.
Flexibilidade e personalização
Os usuários podem selecionar os parâmetros da faixa de aço de Bol, o tipo de média móvel e o comprimento para otimização.
As posições de longo prazo e de vazio podem ser controladas separadamente.
Visualização e confirmação
Mecanismo de sinalização dupla, confirmando o sinal de preço da faixa de aço de Bol através de médias móveis e volume de transação.
Apresentação de sinais de negociação, tais como a média móvel, a linha de parada e outros.
Gestão de Riscos
O nível de parada é calculado com base no ATR. O ATR pode ser personalizado com um ciclo de parada e um múltiplo de ATR.
Ajustar o tamanho da posição de acordo com a porcentagem de risco de posse. Controlar efetivamente a perda individual.
Análise de Riscos
Risco do ciclo de retrospecção
- Diferentes períodos históricos podem ter um impacto sobre o desempenho da estratégia. Deve-se fazer o retorno em diferentes períodos para garantir a solidez da estratégia.
Risco de reversão de tendência
- Em situações de turbulência, o risco de se desencadear frequentemente o stop loss pode ser reduzido através da otimização dos parâmetros das médias móveis.
Risco de otimização
- A otimização de múltiplos parâmetros pode levar a otimização excessiva, e deve ser adotada uma combinação de múltiplos parâmetros e testes de robustez.
Risco de atraso em indicadores técnicos
- Há um certo atraso no cálculo do indicador, que deve ser combinado com o julgamento da entidade de preços e não pode depender exclusivamente do indicador.
Direção de otimização
Optimização de parâmetros
- Optimizar os parâmetros de banda de aço de Bol, o tipo de média móvel e os parâmetros de ATR para adaptar-se a diferentes variedades e períodos.
Optimização de posições
- Testar diferentes níveis de risco porcentual de posições e otimizar o múltiplo de stop loss.
Otimização de Sinal
- O teste adiciona outros indicadores auxiliares para filtrar o sinal, como KD, MACD, etc.
Optimização do código
- Otimização da lógica de julgamento de sinais, redução de posições desnecessárias. Adotar programação orientada a objetos para aumentar a escalabilidade.
Resumir
A estratégia integra a banda de aço de Bohr, a média móvel e a análise de volume de transação para construir um sistema de negociação mecânica que acompanha a tendência. A vantagem da estratégia é que o mecanismo de confirmação de sinal é forte e o risco é controlado. A estabilidade e a lucratividade da estratégia podem ser aumentadas por meio de parâmetros e otimização de sinais.
/*backtest
start: 2023-11-25 00:00:00
end: 2023-12-25 00:00:00
period: 1h
basePeriod: 15m
exchanges: [{"eid":"Futures_Binance","currency":"BTC_USDT"}]
*/

// This source code is subject to the terms of the Mozilla Public License 2.0 at https://mozilla.org/MPL/2.0/
// © sosacur01

//@version=5
strategy(title="Bollinger Band | Trend Following", overlay=true, pyramiding=1, commission_type=strategy.commission.percent, commission_value=0.2, initial_capital=10000)

//--------------------------------------

//BACKTEST RANGE
useDateFilter = input.bool(true, title="Filter Date Range of Backtest",
     group="Backtest Time Period")
backtestStartDate = input(timestamp("1 jan 2017"),
     title="Start Date", group="Backtest Time Period",
     tooltip="This start date is in the time zone of the exchange " +
     "where the chart's instrument trades. It doesn't use the time " +
     "zone of the chart or of your computer.")
backtestEndDate = input(timestamp("1 jul 2100"),
     title="End Date", group="Backtest Time Period",
     tooltip="This end date is in the time zone of the exchange " +
     "where the chart's instrument trades. It doesn't use the time " +
     "zone of the chart or of your computer.")
inTradeWindow = true
if not inTradeWindow and inTradeWindow[1]
    strategy.cancel_all()
    strategy.close_all(comment="Date Range Exit")

//--------------------------------------

//LONG/SHORT POSITION ON/OFF INPUT
LongPositions   = input.bool(title='On/Off Long Postion', defval=true, group="Long & Short Position")
ShortPositions  = input.bool(title='On/Off Short Postion', defval=true, group="Long & Short Position")

//--------------------------------------
//MA INPUTS
averageType1    = input.string(defval="WMA", group="MA", title="MA Type", options=["SMA", "EMA", "WMA", "HMA", "RMA", "SWMA", "ALMA", "VWMA", "VWAP"])
averageLength1  = input.int(defval=99, title="MA Lenght", group="MA")
averageSource1  = input(close, title="MA Source", group="MA")

//MA TYPE
MovAvgType1(averageType1, averageSource1, averageLength1) =>
	switch str.upper(averageType1)
        "SMA"  => ta.sma(averageSource1, averageLength1)
        "EMA"  => ta.ema(averageSource1, averageLength1)
        "WMA"  => ta.wma(averageSource1, averageLength1)
        "HMA"  => ta.hma(averageSource1, averageLength1)
        "RMA"  => ta.rma(averageSource1, averageLength1)
        "SWMA" => ta.swma(averageSource1)
        "ALMA" => ta.alma(averageSource1, averageLength1, 0.85, 6)
        "VWMA" => ta.vwma(averageSource1, averageLength1)
        "VWAP" => ta.vwap(averageSource1)
        => runtime.error("Moving average type '" + averageType1 +
             "' not found!"), na


//MA VALUES
ma  = MovAvgType1(averageType1, averageSource1, averageLength1)

//MA CONDITIONS
bullish_ma = close > ma
bearish_ma = close < ma

//PLOT COLOR
ma_plot    = if close > ma
    color.navy
else
    color.rgb(49, 27, 146, 40)

//MA PLOT
plot(ma,color=ma_plot, linewidth=2, title="MA")

//--------------------------------------
//BB INPUTS
length  = input.int(20, minval=1, group="BB")
src     = input(close, title="Source", group="BB")
mult    = input.float(2.0, minval=0.001, maxval=50, title="StdDev", group="BB")

//BB VALUES
basis = ta.sma(src, length)
dev = mult * ta.stdev(src, length)
upper = basis + dev
lower = basis - dev
offset = input.int(0, "Offset", minval = -500, maxval = 500)

//BBPLOT
//plot(basis, "Basis", color=#FF6D00, offset = offset)
p1 = plot(upper, "Upper", color=#2978ffa4, offset = offset)
p2 = plot(lower, "Lower", color=#2978ffa4, offset = offset)
fill(p1, p2, title = "Background", color=color.rgb(33, 47, 243, 97))

//BB ENTRY AND EXIT CONDITIONS
bb_long_entry  = close >= upper
bb_long_exit   = close <= lower
bb_short_entry = close <= lower
bb_short_exit  = close >= upper

//---------------------------------------------------------------
//VOLUME INPUTS
useVolumefilter  = input.bool(title='Use Volume Filter?', defval=false, group="Volume Inputs")
dailyLength      = input.int(title = "MA length", defval = 30, minval = 1, maxval = 100, group = "Volume Inputs")
lineWidth        = input.int(title = "Width of volume bars", defval = 3, minval = 1, maxval = 6, group = "Volume Inputs")
Volumefilter_display  = input.bool(title="Color bars?", defval=false, group="Volume Inputs", tooltip = "Change bar colors when Volume is above average")

//VOLUME VALUES
volumeAvgDaily = ta.sma(volume, dailyLength)

//VOLUME SIGNAL
v_trigger  = (useVolumefilter ? volume > volumeAvgDaily : inTradeWindow)

//PLOT VOLUME SIGNAL
barcolor(Volumefilter_display ? v_trigger ? color.new(#6fe477, 77):na: na, title="Volume Filter")
//---------------------------------------------------------------

//ENTRIES AND EXITS
long_entry  = if inTradeWindow and bullish_ma and bb_long_entry and v_trigger and LongPositions
    true
long_exit   = if inTradeWindow and bb_long_exit
    true

short_entry = if inTradeWindow  and bearish_ma and bb_short_entry and v_trigger and ShortPositions
    true
short_exit  = if inTradeWindow  and bb_short_exit
    true

//--------------------------------------

//RISK MANAGEMENT - SL, MONEY AT RISK, POSITION SIZING
atrPeriod                = input.int(14, "ATR Length", group="Risk Management Inputs")
sl_atr_multiplier        = input.float(title="Long Position - Stop Loss - ATR Multiplier", defval=2, group="Risk Management Inputs", step=0.5)
sl_atr_multiplier_short  = input.float(title="Short Position - Stop Loss - ATR Multiplier", defval=2, group="Risk Management Inputs", step=0.5)
i_pctStop                = input.float(2, title="% of Equity at Risk", step=.5, group="Risk Management Inputs")/100

//ATR VALUE
_atr = ta.atr(atrPeriod)

//CALCULATE LAST ENTRY PRICE
lastEntryPrice = strategy.opentrades.entry_price(strategy.opentrades - 1)

//STOP LOSS - LONG POSITIONS
var float sl = na

//CALCULTE SL WITH ATR AT ENTRY PRICE - LONG POSITION
if (strategy.position_size[1] != strategy.position_size)
    sl := lastEntryPrice - (_atr * sl_atr_multiplier)

//IN TRADE - LONG POSITIONS
inTrade = strategy.position_size > 0

//PLOT SL - LONG POSITIONS
plot(inTrade ? sl : na, color=color.blue, style=plot.style_circles, title="Long Position - Stop Loss")

//CALCULATE ORDER SIZE - LONG POSITIONS
positionSize = (strategy.equity * i_pctStop) / (_atr * sl_atr_multiplier)

//============================================================================================

//STOP LOSS - SHORT POSITIONS
var float sl_short = na

//CALCULTE SL WITH ATR AT ENTRY PRICE - SHORT POSITIONS
if (strategy.position_size[1] != strategy.position_size)
    sl_short := lastEntryPrice + (_atr * sl_atr_multiplier_short)

//IN TRADE SHORT POSITIONS
inTrade_short = strategy.position_size < 0

//PLOT SL - SHORT POSITIONS
plot(inTrade_short ? sl_short : na, color=color.red, style=plot.style_circles, title="Short Position - Stop Loss")

//CALCULATE ORDER - SHORT POSITIONS
positionSize_short = (strategy.equity * i_pctStop) / (_atr * sl_atr_multiplier_short)


//===============================================

//LONG STRATEGY
strategy.entry("Long", strategy.long, comment="Long", when = long_entry, qty=positionSize)
if (strategy.position_size > 0)
    strategy.close("Long", when = (long_exit), comment="Close Long")
    strategy.exit("Long", stop = sl, comment="Exit Long")

//SHORT STRATEGY
strategy.entry("Short", strategy.short, comment="Short", when = short_entry, qty=positionSize_short)
if (strategy.position_size < 0)
    strategy.close("Short", when = (short_exit), comment="Close Short")
    strategy.exit("Short", stop = sl_short, comment="Exit Short")

//ONE DIRECTION TRADING COMMAND (BELLOW ONLY ACTIVATE TO CORRECT BUGS)
//strategy.risk.allow_entry_in(strategy.direction.long)