Estratégia de acompanhamento de tendências com base em bandas dinâmicas de suporte e resistência
Data de criação:
2023-12-26 11:57:20
última modificação:
2023-12-26 11:57:20
cópia:
1
Cliques:
506
1
focar em
1628
Seguidores

Visão geral
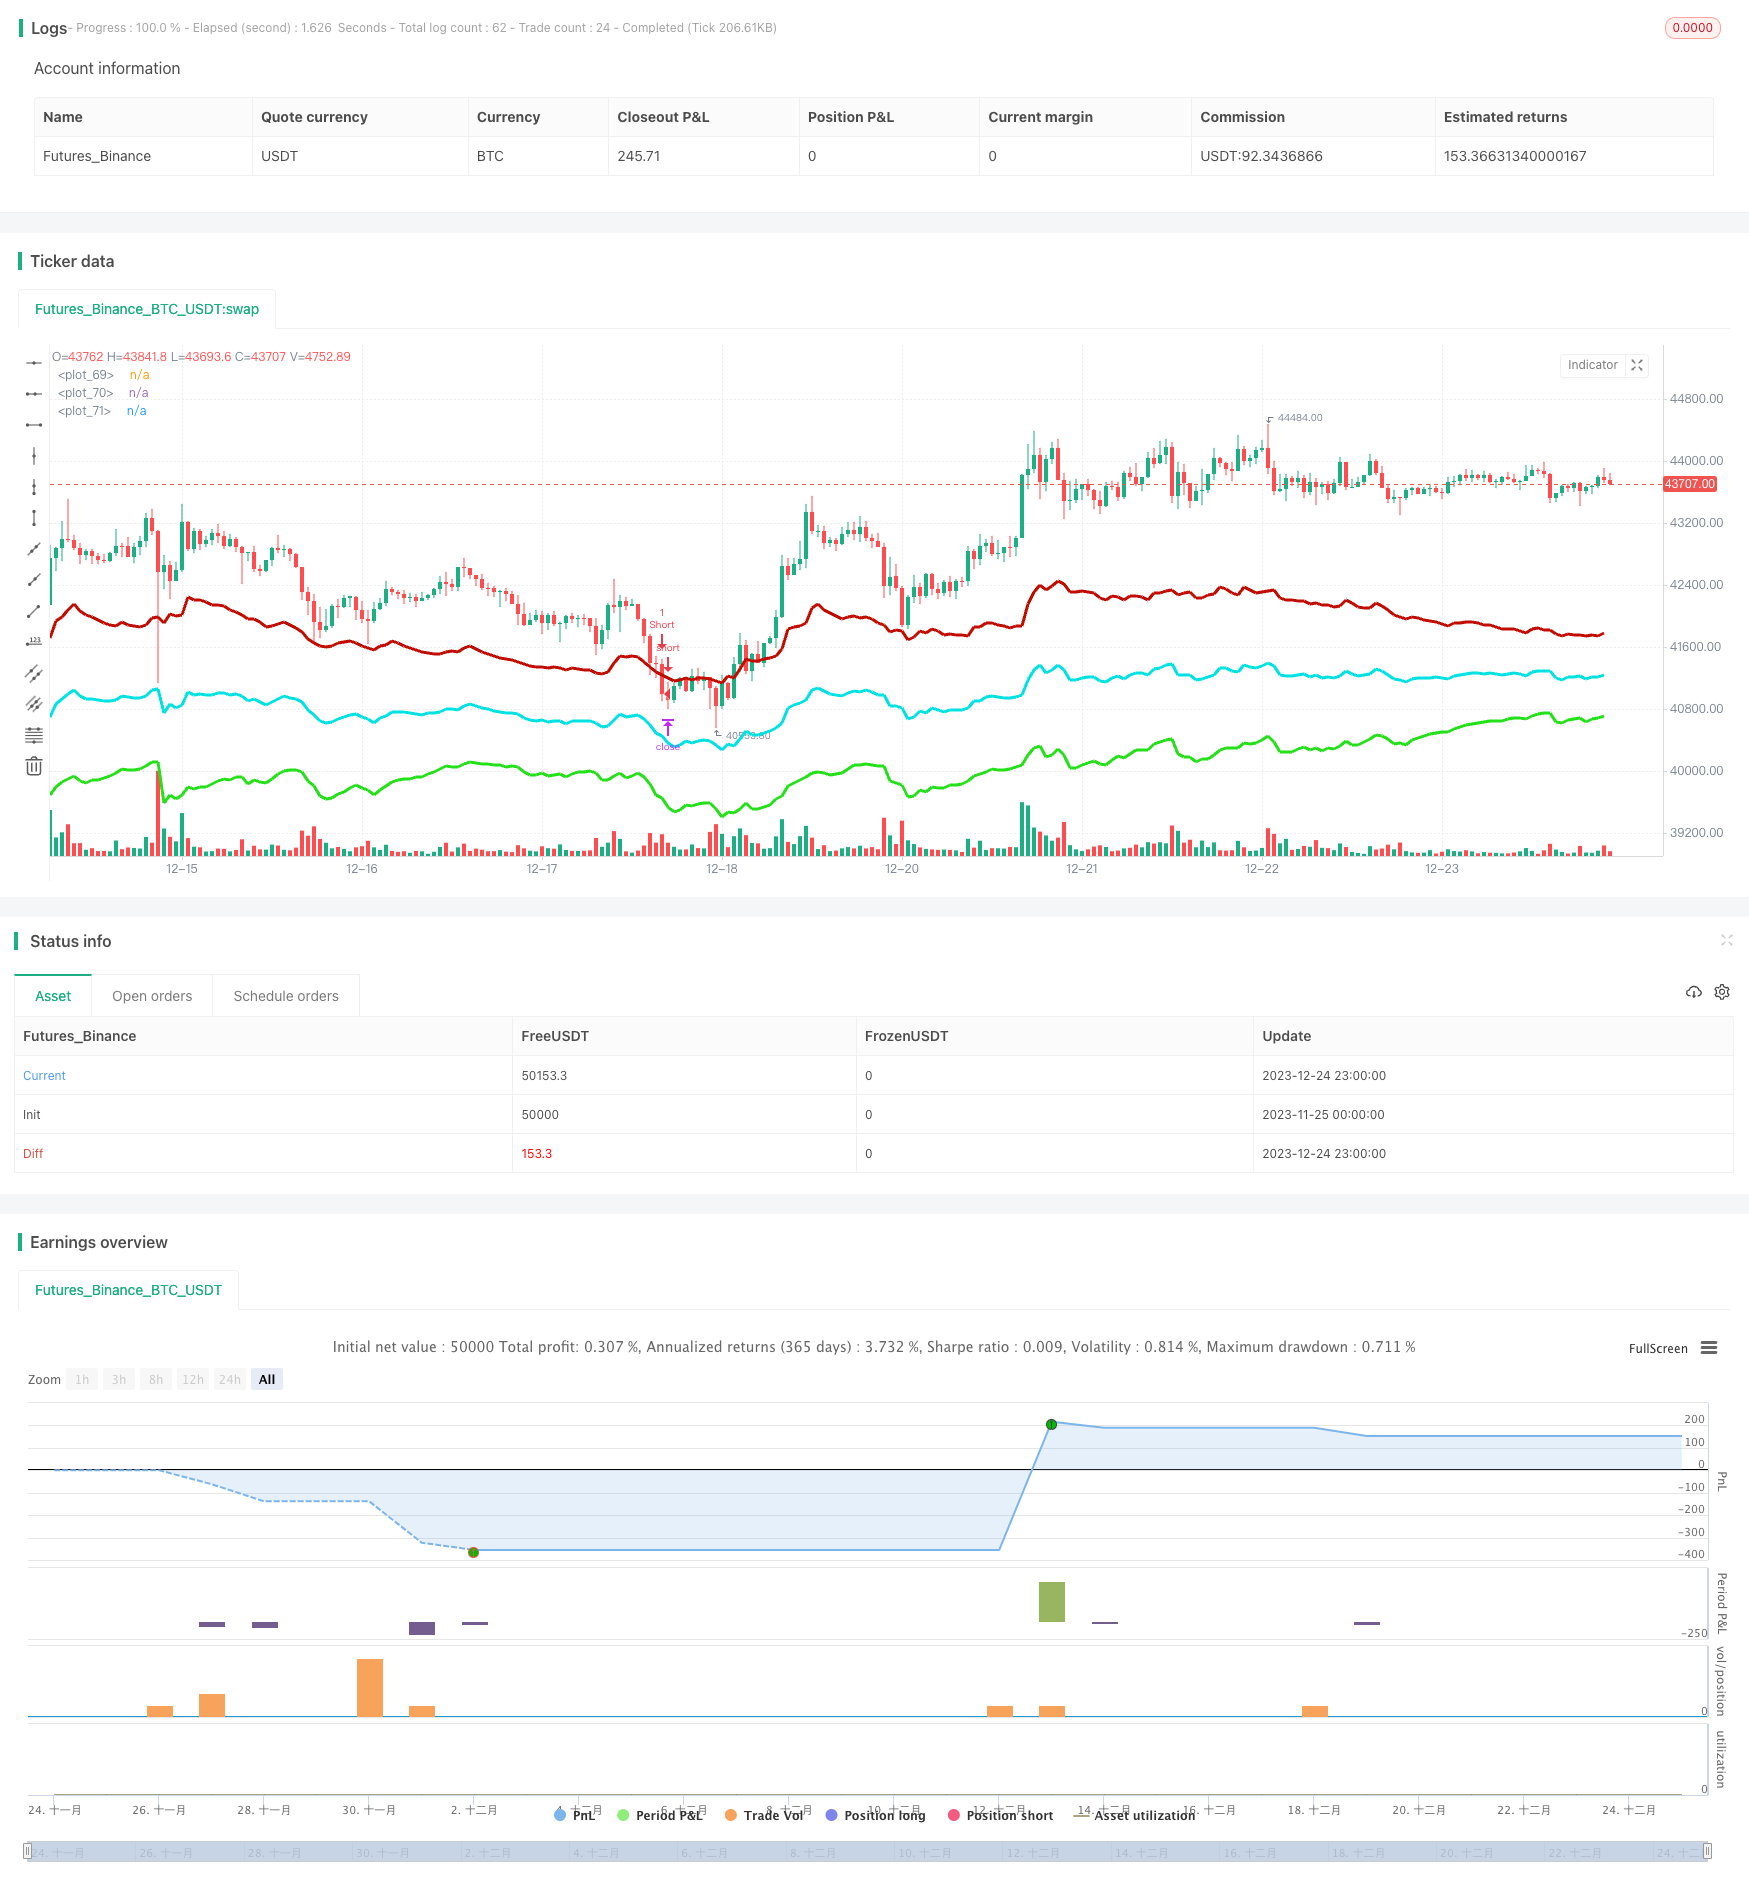
A estratégia forma um eixo central dinâmico, combinando os preços mais altos e mais baixos dos últimos períodos de tempo com os preços atuais. Em seguida, é gerado um canal descendente vermelho e um canal ascendente verde com base na flutuação mais recente.
Princípio da estratégia
- Calcula os preços mais altos e mais baixos dos últimos N ciclos, combinados com os preços de fechamento atuais, formando um eixo central dinâmico
- Banda de passagem dinâmica gerada de acordo com o ATR e o multiplicador, variando de acordo com a taxa de flutuação do mercado
- Fazer mais quando o preço rebenta da linha de canal inferior, fazer menos quando o preço rebenta da linha de canal superior
- A meta é retornar à paralisação do eixo central.
- Calcula um índice de tendência para filtrar transações que não estão em alta
Análise de vantagens
- Mudanças dinâmicas na posição da linha de canal, capturando a volatilidade do mercado em tempo real
- A probabilidade de negociação em curso é maior, o que ajuda a entender a tendência
- Controle de perda única com lógica de stop loss
Análise de Riscos
- Optimização inadequada de parâmetros pode levar a transações excessivas
- A grande tendência não pode eliminar completamente a desvantagem do comércio
- A linha de acesso unilateral pode continuar a funcionar
Direção de otimização
- Ajustar os parâmetros das linhas de passagem para que sejam mais adequadas às características de diferentes variedades
- Ajustar os parâmetros do índice de tendência para aumentar a probabilidade de tendência
- Adição de elementos de aprendizagem de máquina para otimização dinâmica de parâmetros
Resumir
A estratégia depende principalmente de características de choque do mercado para lucrar. Capturar o ponto de reversão de preço através de um canal dinâmico, e combinar a filtragem de tendência, pode efetivamente usar a negociação de reversão para lucrar, ao mesmo tempo controlar o risco. A chave está no ajuste com os parâmetros, que precisam que a linha de canal possa acompanhar os preços em tempo real, mas não seja muito sensível.
Código-fonte da estratégia
/*backtest
start: 2023-11-25 00:00:00
end: 2023-12-25 00:00:00
period: 1h
basePeriod: 15m
exchanges: [{"eid":"Futures_Binance","currency":"BTC_USDT"}]
*/

//@version=4
strategy(title="Strategy - Bobo PAPATR", overlay=true, default_qty_type = strategy.fixed, default_qty_value = 1, initial_capital = 10000)

// === STRATEGY RELATED INPUTS AND LOGIC ===
len = input(24, minval=1, title="Pivot Length, defines lookback for highs and lows to make pivots")
length = input(title="ATR lookback (Lower = bands more responsive to recent price action)", type=input.integer, defval=22)
myatr = atr(length)
dailyatr = myatr[1]
atrmult = input(title="ATR multiplier (Lower = wider bands)", type=input.float, defval=3)
pivot0 = (high[1] + low[1]  + close[1]) / 3

// PIVOT CALC
h = highest(len)
h1 = dev(h, len) ? na : h
hpivot = fixnan(h1)
l = lowest(len)
l1 = dev(l, len) ? na : l
lpivot = fixnan(l1)
pivot = (lpivot + hpivot + pivot0) / 3
upperband1 = (dailyatr * atrmult) + pivot
lowerband1 = pivot - (dailyatr * atrmult)
middleband = pivot

// == TREND CALC ===
i1=input(2, "Momentum Period", minval=1) //Keep at 2 usually
i2=input(20, "Slow Period", minval=1)
i3=input(5, "Fast Period", minval=1)
i4=input(3, "Smoothing Period", minval=1)
i5=input(4, "Signal Period", minval=1)
i6=input(50, "Extreme Value", minval=1)
hiDif = high - high[1]
loDif = low[1] - low
uDM = hiDif > loDif and hiDif > 0 ? hiDif : 0
dDM =  loDif > hiDif and loDif > 0 ? loDif : 0
ATR = rma(tr(true), i1)
DIu = 100 * rma(uDM, i1) / ATR
DId = 100 * rma(dDM, i1) / ATR
HLM2 =  DIu - DId
DTI = (100 * ema(ema(ema(HLM2, i2), i3), i4)) /  ema(ema(ema(abs(HLM2), i2), i3), i4)
signal = ema(DTI, i5)


// === RISK MANAGEMENT INPUTS ===
inpTakeProfit   = input(defval = 0, title = "Take Profit (In Market MinTick Value)", minval = 0)
inpStopLoss     = input(defval = 100, title = "Stop Loss (In Market MinTick Value)", minval = 0)

// === RISK MANAGEMENT VALUE PREP ===
// if an input is less than 1, assuming not wanted so we assign 'na' value to disable it.
useTakeProfit   = inpTakeProfit  >= 1 ? inpTakeProfit  : na
useStopLoss     = inpStopLoss    >= 1 ? inpStopLoss    : na

// === STRATEGY - LONG POSITION EXECUTION ===
enterLong = (((low<=lowerband1) and (close >lowerband1)) or ((open <= lowerband1) and (close > lowerband1))) and (strategy.opentrades <1) and (atr(3) > atr(50)) and (signal>signal[3])
exitLong = (high > middleband)
strategy.entry(id = "Long", long = true, when = enterLong)
strategy.close(id = "Long", when = exitLong)

// === STRATEGY - SHORT POSITION EXECUTION ===
enterShort = (((high>=upperband1) and (close < upperband1)) or ((open >= upperband1) and (close < upperband1))) and (strategy.opentrades <1) and (atr(3) > atr(50)) and (signal<signal[3])
exitShort = (low < middleband)
strategy.entry(id = "Short", long = false, when = enterShort)
strategy.close(id = "Short", when = exitShort)

// === STRATEGY RISK MANAGEMENT EXECUTION ===
strategy.exit("Exit Long", from_entry = "Long", profit = useTakeProfit, loss = useStopLoss)
strategy.exit("Exit Short", from_entry = "Short", profit = useTakeProfit, loss = useStopLoss)

// === CHART OVERLAY ===
plot(upperband1, color=#C10C00, linewidth=3)
plot(lowerband1, color=#23E019, linewidth=3)
plot(middleband, color=#00E2E2, linewidth=3)
//plot(strategy.equity, title="equity", color=red, linewidth=2, style=areabr)