Estratégia de rastreamento de tendências
Autora:ChaoZhang, Data: 2024-01-24 14:17:28Tags:

Resumo
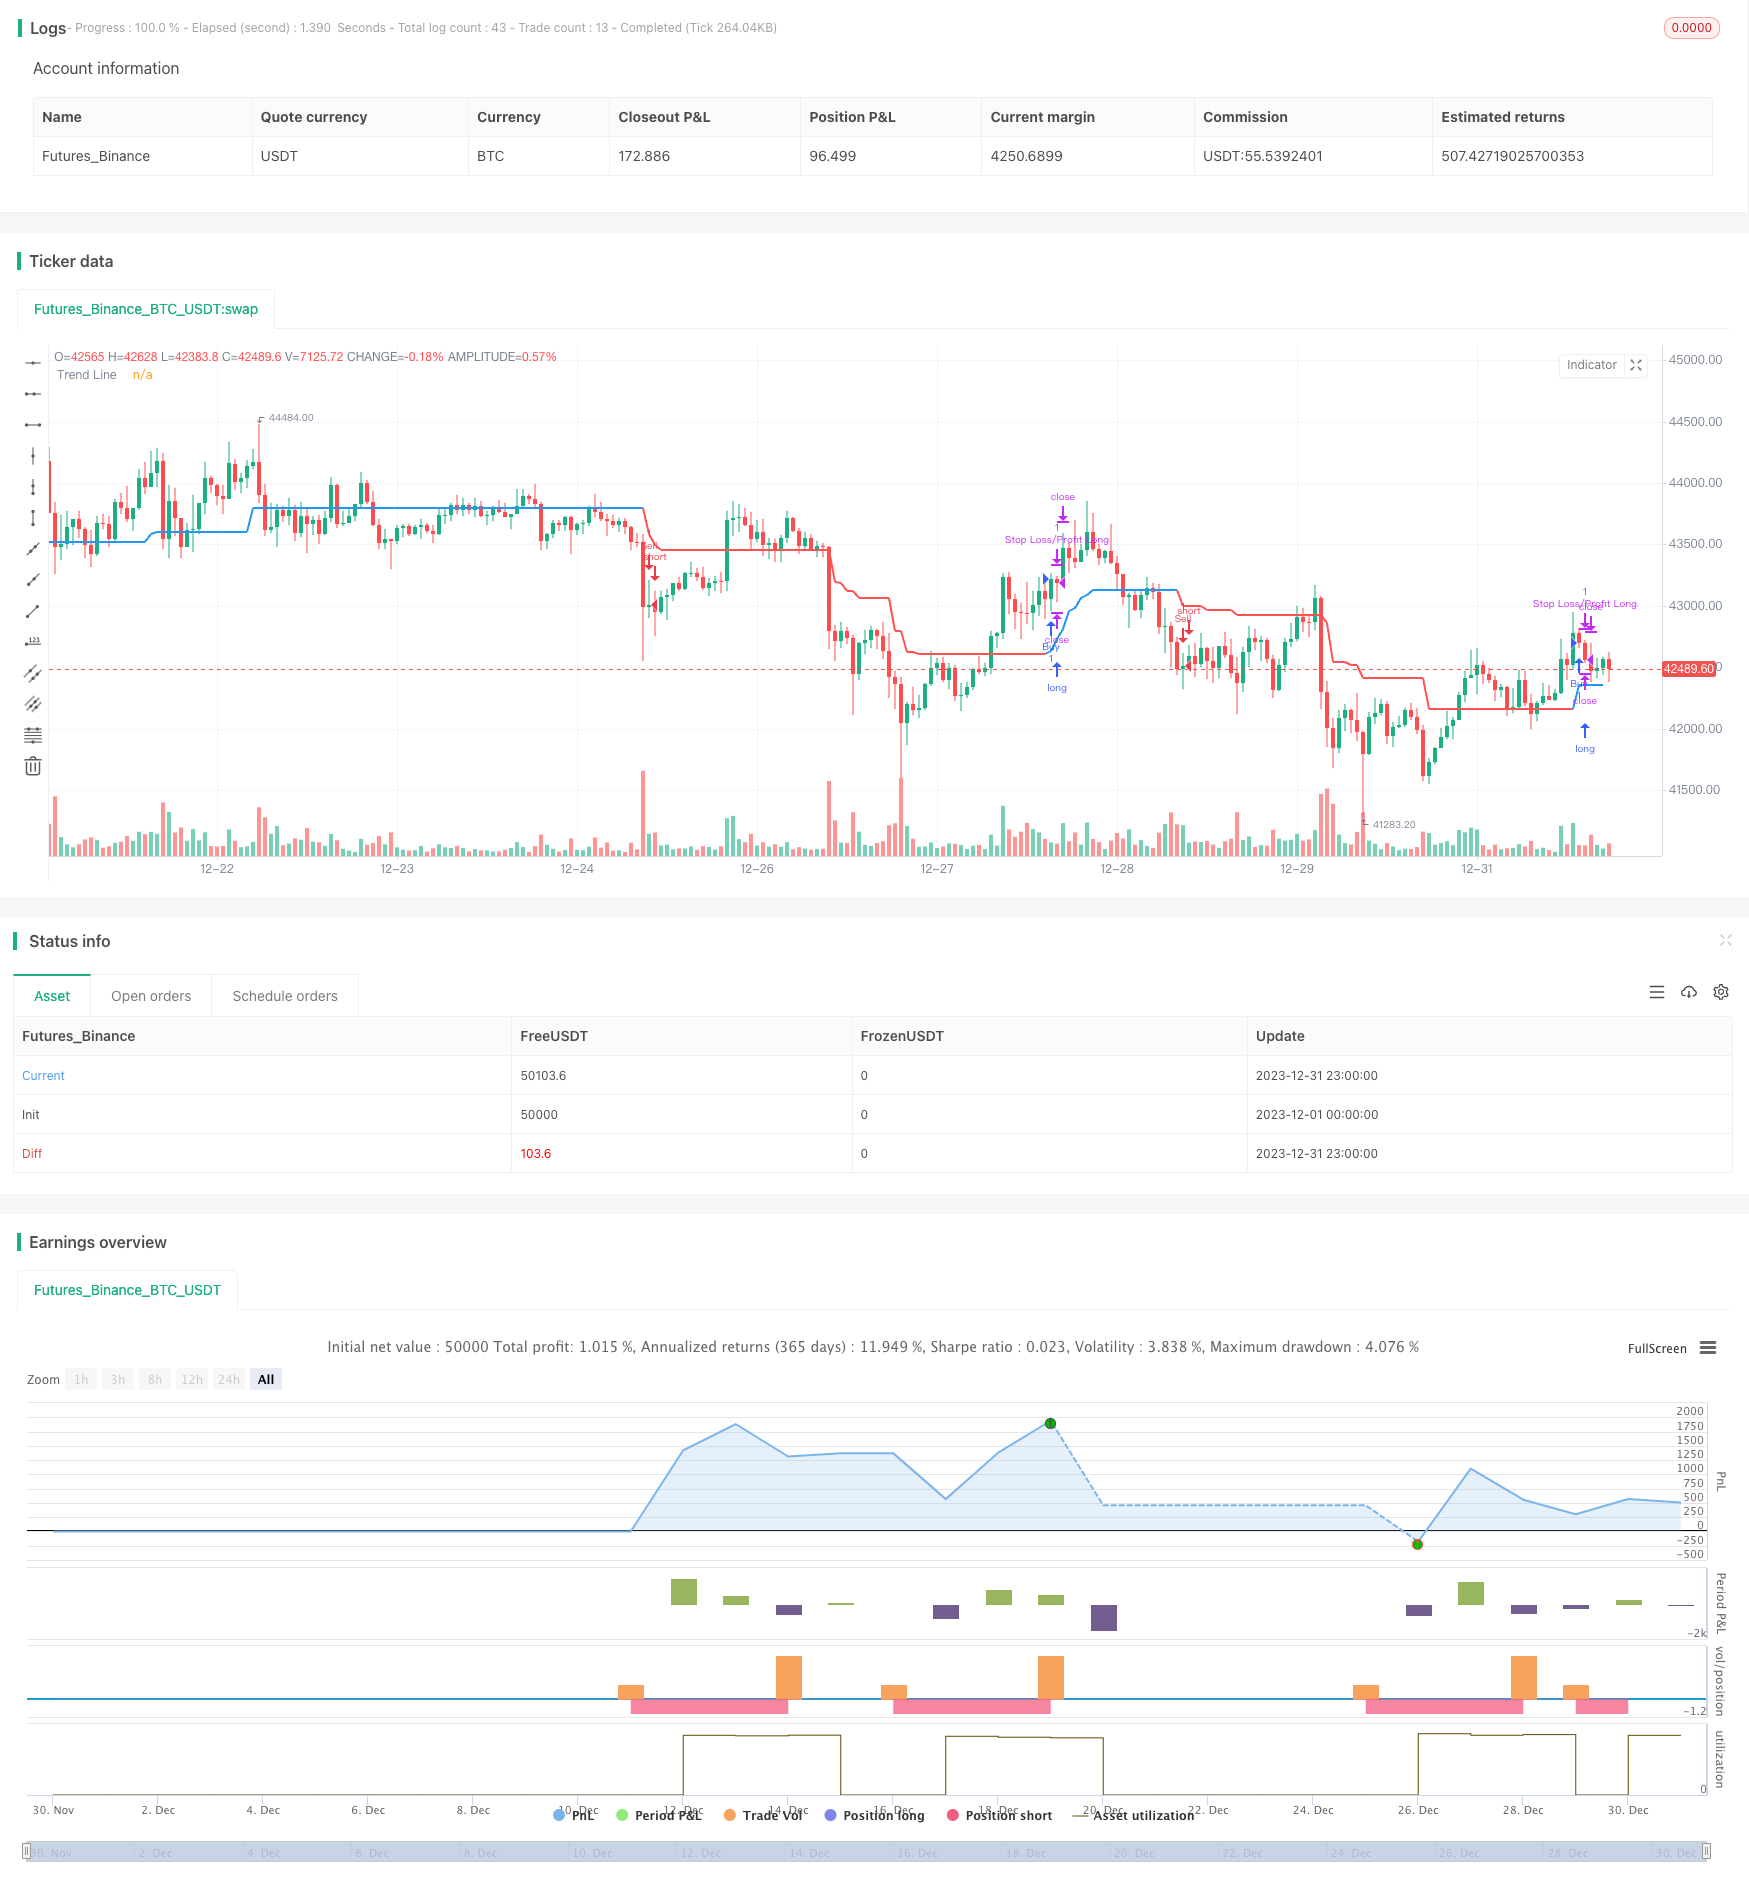
Esta é uma estratégia de rastreamento de tendências que usa Bandas de Bollinger para determinar a tendência e ATR para definir stop loss e take profit.
Estratégia lógica
- Calcule os trilhos superior e inferior das Bandas de Bollinger.
- Julgue se o preço de fechamento está acima do trilho superior ou abaixo do trilho inferior.
- Se for um mercado em tendência, calcule a linha de tendência. A linha de tendência baseia-se no preço mais baixo menos o valor ATR (mercado alcista) ou no preço mais alto mais o valor ATR (mercado de baixa).
- Se não for um mercado em tendência, mantenha a linha de tendência igual à barra anterior.
- Compare a linha de tendência para determinar a direção da tendência.
- Gerar sinais de compra/venda quando a direção da linha de tendência mudar.
- Estabelecer stop loss e take profit: a distância de stop loss fixa é 100 vezes do preço de entrada; o take profit flutuante é 1,1 vezes (bull) ou 0,9 vezes (bear) do preço de entrada.
Análise das vantagens
- Pode determinar a tendência do mercado, evitar falsos negócios de fuga.
- Coloque a linha de tendência para evitar ser preso.
- A definição de um "stop loss" e "take profit" razoáveis para controlar o risco e garantir o lucro.
Análise de riscos
- Ajustes de parâmetros incorretos podem perder oportunidades de negociação.
- As bandas de Bollinger têm uma grande probabilidade de julgar erroneamente em mercados de intervalo.
- A perda de paragem muito próxima pode ser interrompida facilmente.
Orientações de otimização
- Otimizar os parâmetros das bandas de Bollinger para diferentes produtos.
- Otimizar os métodos de cálculo da linha de tendência, por exemplo, introduzindo outros indicadores.
- Teste e otimize as configurações do parâmetro stop loss e take profit.
Conclusão
Esta é uma estratégia que usa Bollinger Bands para determinar a tendência e define stop loss e take profit com base na linha de tendência. As principais vantagens são o julgamento claro da tendência, o stop loss razoável e as configurações de take profit para controlar efetivamente os riscos. Os principais riscos vêm do julgamento errado da tendência e da stop loss estar muito perto.
/*backtest
start: 2023-12-01 00:00:00
end: 2023-12-31 23:59:59
period: 1h
basePeriod: 15m
exchanges: [{"eid":"Futures_Binance","currency":"BTC_USDT"}]
*/

// This Pine Script™ code is subject to the terms of the Mozilla Public License 2.0 at https://mozilla.org/MPL/2.0/
// © zhuenrong

// © Dreadblitz
//@version=4
strategy(shorttitle="FLI", title="Follow Line Indicator", overlay=true)
//
BBperiod      = input(defval = 21,     title = "BB Period",    type = input.integer, minval = 1)
BBdeviations  = input(defval = 1.00,     title = "BB Deviations",    type = input.float, minval = 0.1, step=0.05)
UseATRfilter  = input(defval = true, title = "ATR Filter",  type = input.bool)
ATRperiod     = input(defval = 5,     title = "ATR Period",    type = input.integer, minval = 1)
hl            = input(defval = false, title = "Hide Labels",  type = input.bool)
//
BBUpper=sma (close,BBperiod)+stdev(close, BBperiod)*BBdeviations
BBLower=sma (close,BBperiod)-stdev(close, BBperiod)*BBdeviations
//
TrendLine = 0.0
iTrend = 0.0
buy = 0.0
sell = 0.0
//
BBSignal = close>BBUpper? 1 : close<BBLower? -1 : 0
//
if BBSignal == 1 and UseATRfilter == 1
    TrendLine:=low-atr(ATRperiod)
    if TrendLine<TrendLine[1]
        TrendLine:=TrendLine[1]
if BBSignal == -1 and UseATRfilter == 1
    TrendLine:=high+atr(ATRperiod)
    if TrendLine>TrendLine[1]
        TrendLine:=TrendLine[1]
if BBSignal == 0 and UseATRfilter == 1
    TrendLine:=TrendLine[1]
//
if BBSignal == 1 and UseATRfilter == 0
    TrendLine:=low
    if TrendLine<TrendLine[1]
        TrendLine:=TrendLine[1]
if BBSignal == -1 and UseATRfilter == 0
    TrendLine:=high
    if TrendLine>TrendLine[1]
        TrendLine:=TrendLine[1]
if BBSignal == 0 and UseATRfilter == 0
    TrendLine:=TrendLine[1]
//
iTrend:=iTrend[1]
if TrendLine>TrendLine[1]
    iTrend:=1
if TrendLine<TrendLine[1]
    iTrend:=-1
//
buy:=iTrend[1]==-1 and iTrend==1 ? 1 : na
sell:=iTrend[1]==1 and iTrend==-1? 1 : na
//
plot(TrendLine, color=iTrend > 0?color.blue:color.red ,style=plot.style_line,linewidth=2,transp=0,title="Trend Line")
plotshape(buy == 1 and hl == false? TrendLine-atr(8) :na, text='💣', style= shape.labelup, location=location.absolute, color=color.blue, textcolor=color.white, offset=0, transp=0,size=size.auto)
plotshape(sell == 1 and hl == false ?TrendLine+atr(8):na, text='🔨', style=shape.labeldown, location=location.absolute, color=color.red, textcolor=color.white, offset=0, transp=0,size=size.auto)
//
alertcondition(sell == 1 ,title="Sell",message="Sell")
alertcondition(buy == 1 ,title="Buy",message="Buy")
alertcondition(buy == 1 or sell == 1 ,title="Buy/Sell",message="Buy/Sell")
if (buy==1)
    strategy.entry("Buy", strategy.long)
if (sell==1)
    strategy.entry("Sell", strategy.short)
// === Stop LOSS ===

if strategy.position_size>0
    strategy.exit("Stop Loss/Profit Long","Buy", stop=strategy.position_avg_price*100, limit=strategy.position_avg_price*1.1)
if strategy.position_size<0
    strategy.exit("Stop Loss/Profit Short","Sell", stop=strategy.position_avg_price*100, limit=strategy.position_avg_price*0.9)
Mais.
- Contrarian Donchian Channel Touch Entry Strategy com pausa de perda pós-stop e perda de stop de tração
- Combo de estratégia de negociação de curto prazo de indicador de vela única intradiária
- Estratégia de negociação cruzada de média móvel
- RSI Bollinger Bands Estratégia de negociação
- Tendência de seguir uma estratégia baseada na dupla EMA
- Estratégia de ruptura de média móvel dupla
- RSI e estratégia de ruptura da média móvel
- Estratégia de acompanhamento da EMA
- Tendência de seguir uma estratégia baseada na média móvel
- SMA Crossover Ichimoku Estratégia de negociação quantitativa baseada em volume de profundidade de mercado
- Estratégia de ensaio posterior do indicador Qstick de cruzamento bidirecional do eixo zero
- Estratégia de negociação cruzada de média móvel
- Estratégia de divergência da média móvel
- Estratégia de negociação de alta frequência de inversão baseada na linha sombra
- Estratégia de negociação quantitativa baseada no RSI de regressão linear
- Esta estratégia é uma estratégia bidirecional de rastreamento de impulso de filtragem de intervalo adaptativo
- Estratégia de acompanhamento da tendência de média móvel dupla
- Estratégia de Força
- RSI CCI Williams%R Estratégia de negociação quantitativa
- Estratégia de negociação dinâmica ajustada para o risco e para o momento