Estratégia de negociação de reversão do índice do canal de commodities
Autora:ChaoZhang, Data: 2024-01-29Tags:

Resumo
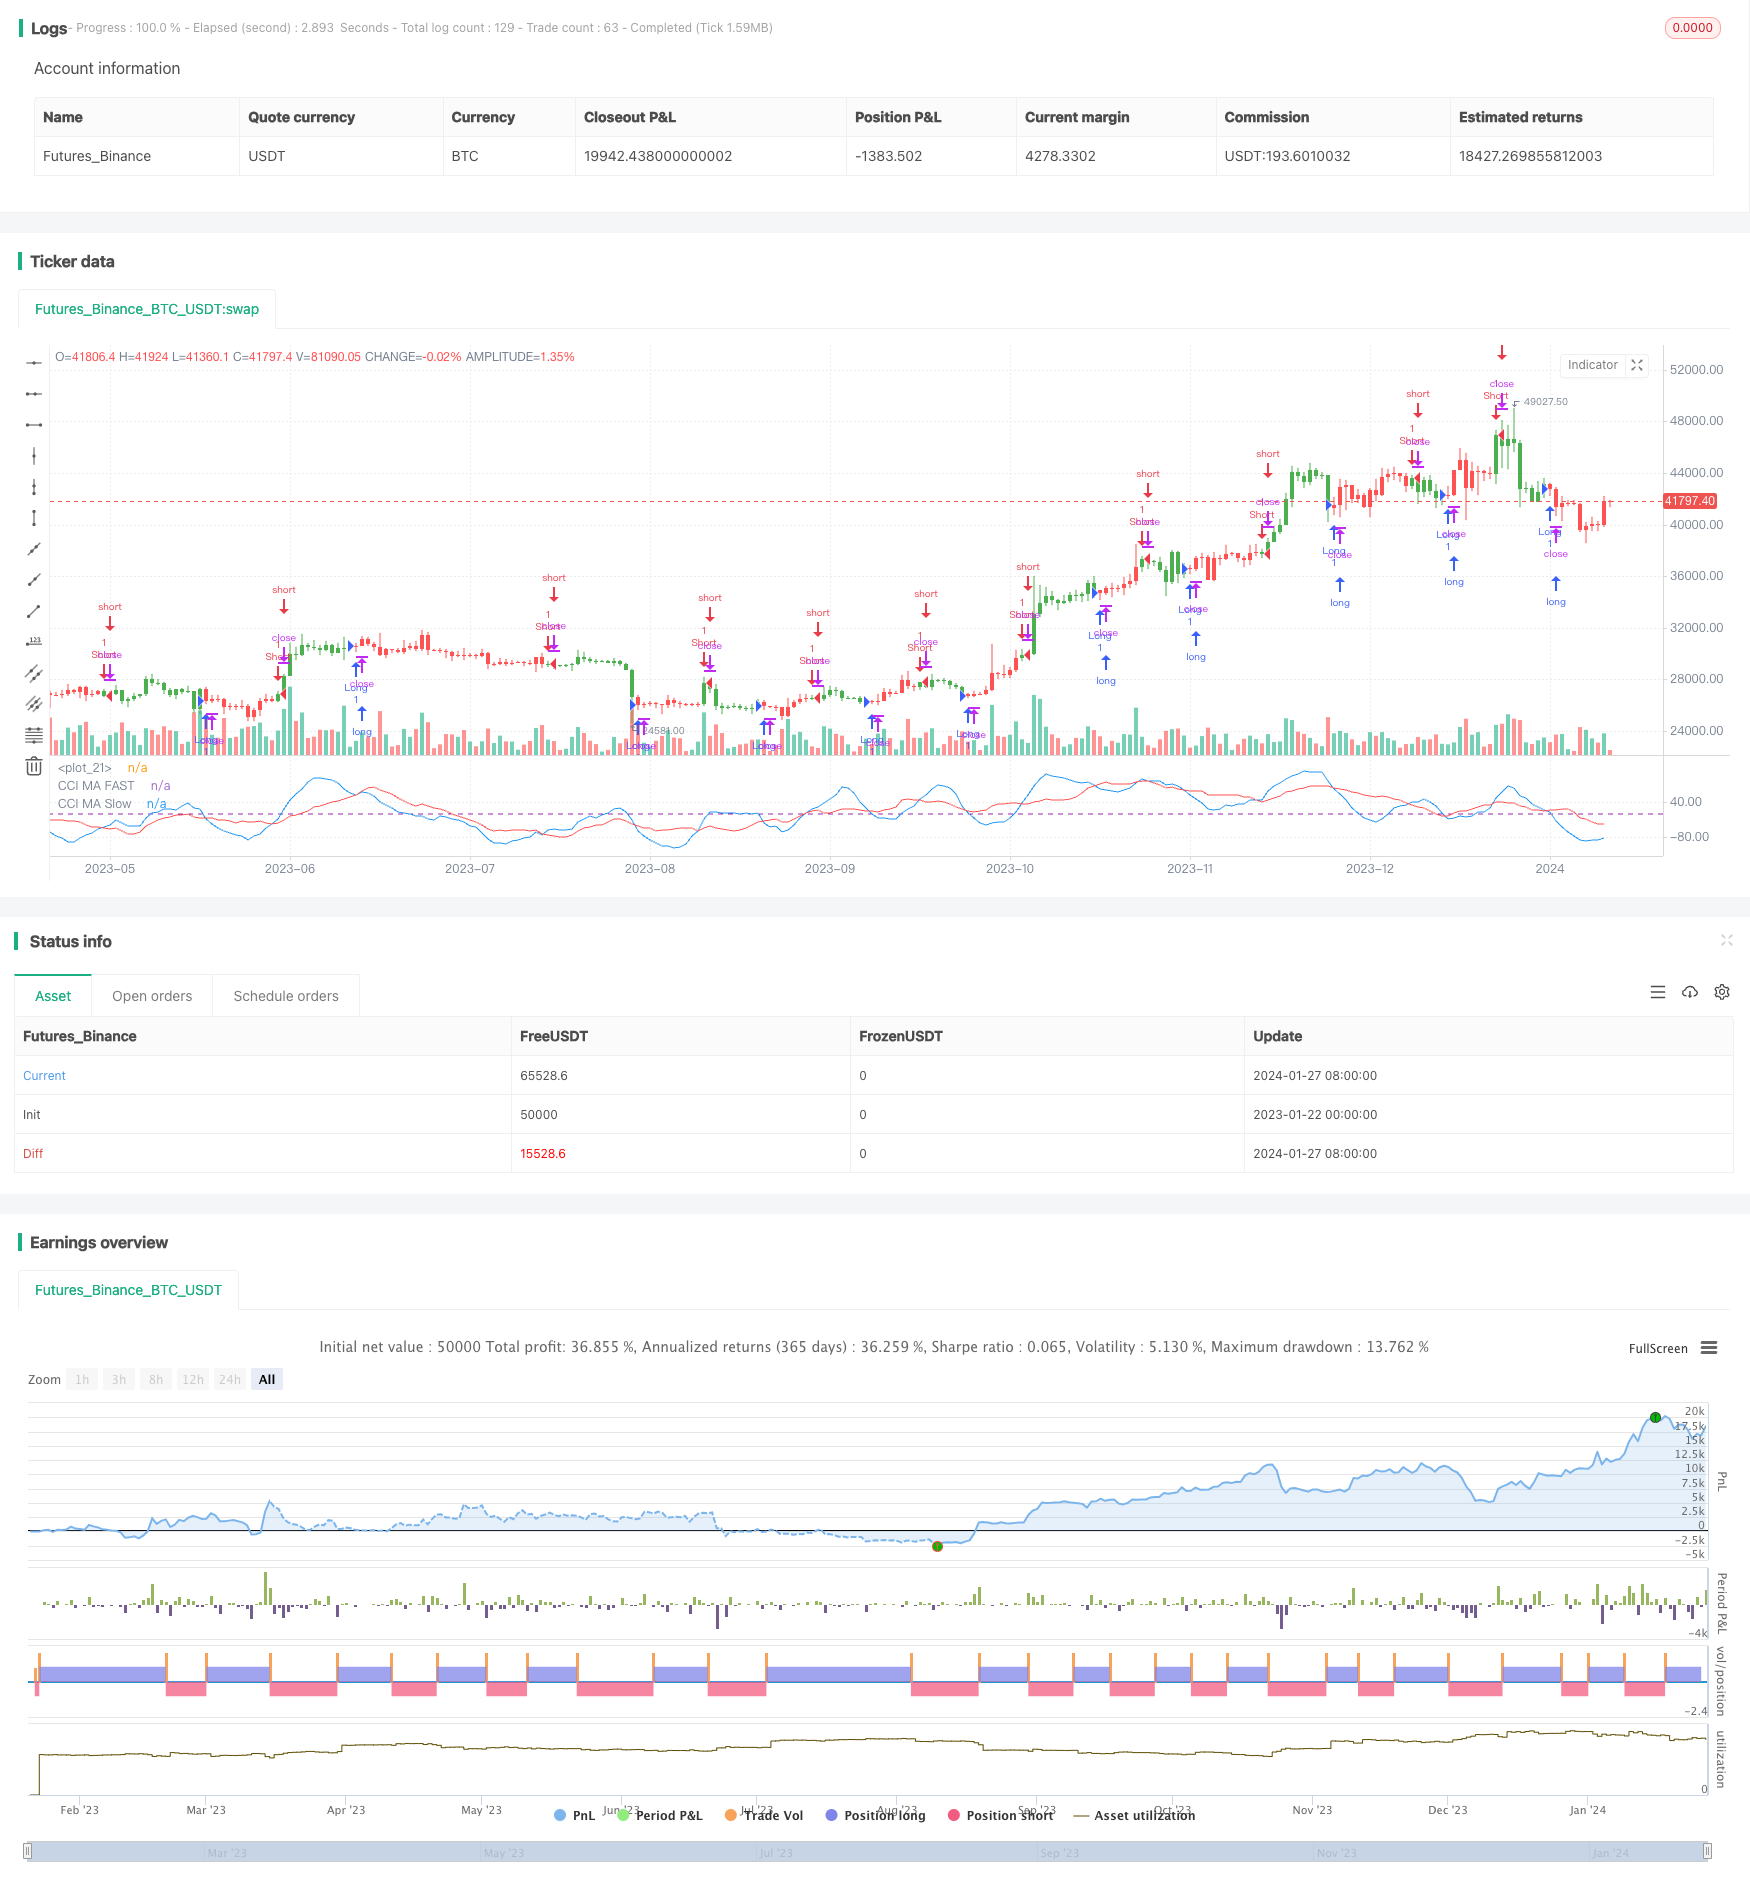
Esta estratégia identifica as características cíclicas e sazonais no mercado com base no Índice de Canal de Commodities (CCI) para detectar o início e o fim dos ciclos.
Estratégia lógica
O valor do Índice de Canal de Commodities (CCI) mostra como o instrumento está sendo negociado em relação ao seu preço médio. Quando o valor do CCI é alto, isso significa que os preços são superiores ao preço médio. Quando o valor do CCI é baixo, isso significa que os preços são inferiores ao preço médio. O valor do CCI geralmente não cai fora da faixa de -300 a 300.
Esta estratégia usa o indicador CCI com comprimento 10 e suas médias móveis simples com comprimento 10 e 20.
Análise das vantagens
- O indicador CCI pode identificar eficazmente as características cíclicas e os pontos de inflexão
- Filtrado por médias móveis duplas para reduzir os falsos sinais
- Permite a selecção da direcção longa ou curta para diferentes ambientes de mercado
- Riscos controláveis com níveis claros de stop loss
Análise de riscos
- O CCI pode não funcionar bem para ações com grandes flutuações de preços
- As médias móveis estão atrasadas e podem perder pontos de virada
- Nenhuma consideração dos fundamentos, incapaz de julgar se o preço está subvalorizado ou sobrevalorizado
- O stop loss pode ser interrompido em prazos mais longos
A otimização pode ser feita ajustando os parâmetros CCI ou períodos de média móvel, ou adicionando outros indicadores técnicos para julgar os fundamentos.
Orientações de otimização
- Otimizar os parâmetros do CCI para diferentes ciclos e volatilidade
- Otimizar os períodos de média móvel para equilibrar atraso e ruído
- Adicionar indicadores como volume para julgar a verdadeira ruptura
- Determinar a tendência geral em prazos mais longos
Resumo
Esta estratégia identifica tendências de curto prazo usando o CCI e médias móveis duplas para julgar as características cíclicas. Suas vantagens são regras simples e claras, ajuste flexível de parâmetros e riscos controláveis. Mas ainda há possibilidades de atraso e julgamento errado. Melhores resultados podem ser alcançados ajustando parâmetros de indicadores e incorporando mais análise técnica ou fundamental.
/*backtest
start: 2023-01-22 00:00:00
end: 2024-01-28 00:00:00
period: 1d
basePeriod: 1h
exchanges: [{"eid":"Futures_Binance","currency":"BTC_USDT"}]
*/

//@version = 2
////////////////////////////////////////////////////////////
//  Copyright by HPotter v1.0 30/11/2016
// The Commodity Channel Index (CCI) is best used with markets that display cyclical or
// seasonal characteristics, and is formulated to detect the beginning and ending of these
// cycles by incorporating a moving average together with a divisor that reflects both possible
// and actual trading ranges. The final index measures the deviation from normal, which indicates
// major changes in market trend.
// To put it simply, the Commodity Channel Index (CCI) value shows how the instrument is trading
// relative to its mean (average) price. When the CCI value is high, it means that the prices are
// high compared to the average price; when the CCI value is down, it means that the prices are low
// compared to the average price. The CCI value usually does not fall outside the -300 to 300 range
// and, in fact, is usually in the -100 to 100 range.
// You can change long to short in the Input Settings
// Please, use it only for learning or paper trading. Do not for real trading.
////////////////////////////////////////////////////////////
strategy(title="CCI Strategy Reversed Backtest", shorttitle="CCI Strategy")
FastMA = input(10, minval=1)
SlowMA = input(20, minval=1)
reverse = input(true, title="Trade reverse")
hline(0, color=purple)
xCCI = cci(close, 10)
xSMA = sma(xCCI,SlowMA)
xFMA = sma(xCCI,FastMA)
pos = iff(xSMA < xFMA , 1,
	   iff(xSMA > xFMA, -1, nz(pos[1], 0)))
possig = iff(reverse and pos == 1, -1,
         iff(reverse and pos == -1, 1, pos))
if (possig == 1)
    strategy.entry("Long", strategy.long)
if (possig == -1)
    strategy.entry("Short", strategy.short)
barcolor(pos == -1 ? red: pos == 1 ? green : blue)
plot(xSMA, color=red, title="CCI MA Slow")
plot(xFMA, color=blue, title="CCI MA FAST")
- As bandas de Bollinger e a estratégia de combinação do RSI
- Estratégia de barra e tendência dupla
- Estratégia incrível de ruptura de preço
- Estratégia de prossecução da tendência robusta
- Estratégia de cruzamento da média móvel de rastreamento de tendências
- Modelo de reversão de ruptura baseado na estratégia de negociação de tartarugas
- Estratégia de tendência de impulso
- O valor da posição em risco deve ser calculado em função do valor da posição em risco.
- Estratégia de negociação de ações equilibrada baseada no RSI
- Estratégia de faixa de volatilidade suave
- Estratégia baseada no tempo com ATR Take Profit
- Estratégia de rastreamento de tendências de impulso
- Estratégia de fechamento de velas da EMA
- Estratégia de negociação quantitativa cruzada da EMA
- Estratégia dinâmica de média móvel de stop-loss
- Reversão média com estratégia de entrada incremental
- Estratégia dinâmica de acompanhamento do preço médio
- Fractals de Williams combinados com o indicador ZZ para estratégias quantitativas de negociação
- Estratégia de negociação de tendências de vários fatores
- Estratégia de negociação cruzada de média móvel dupla