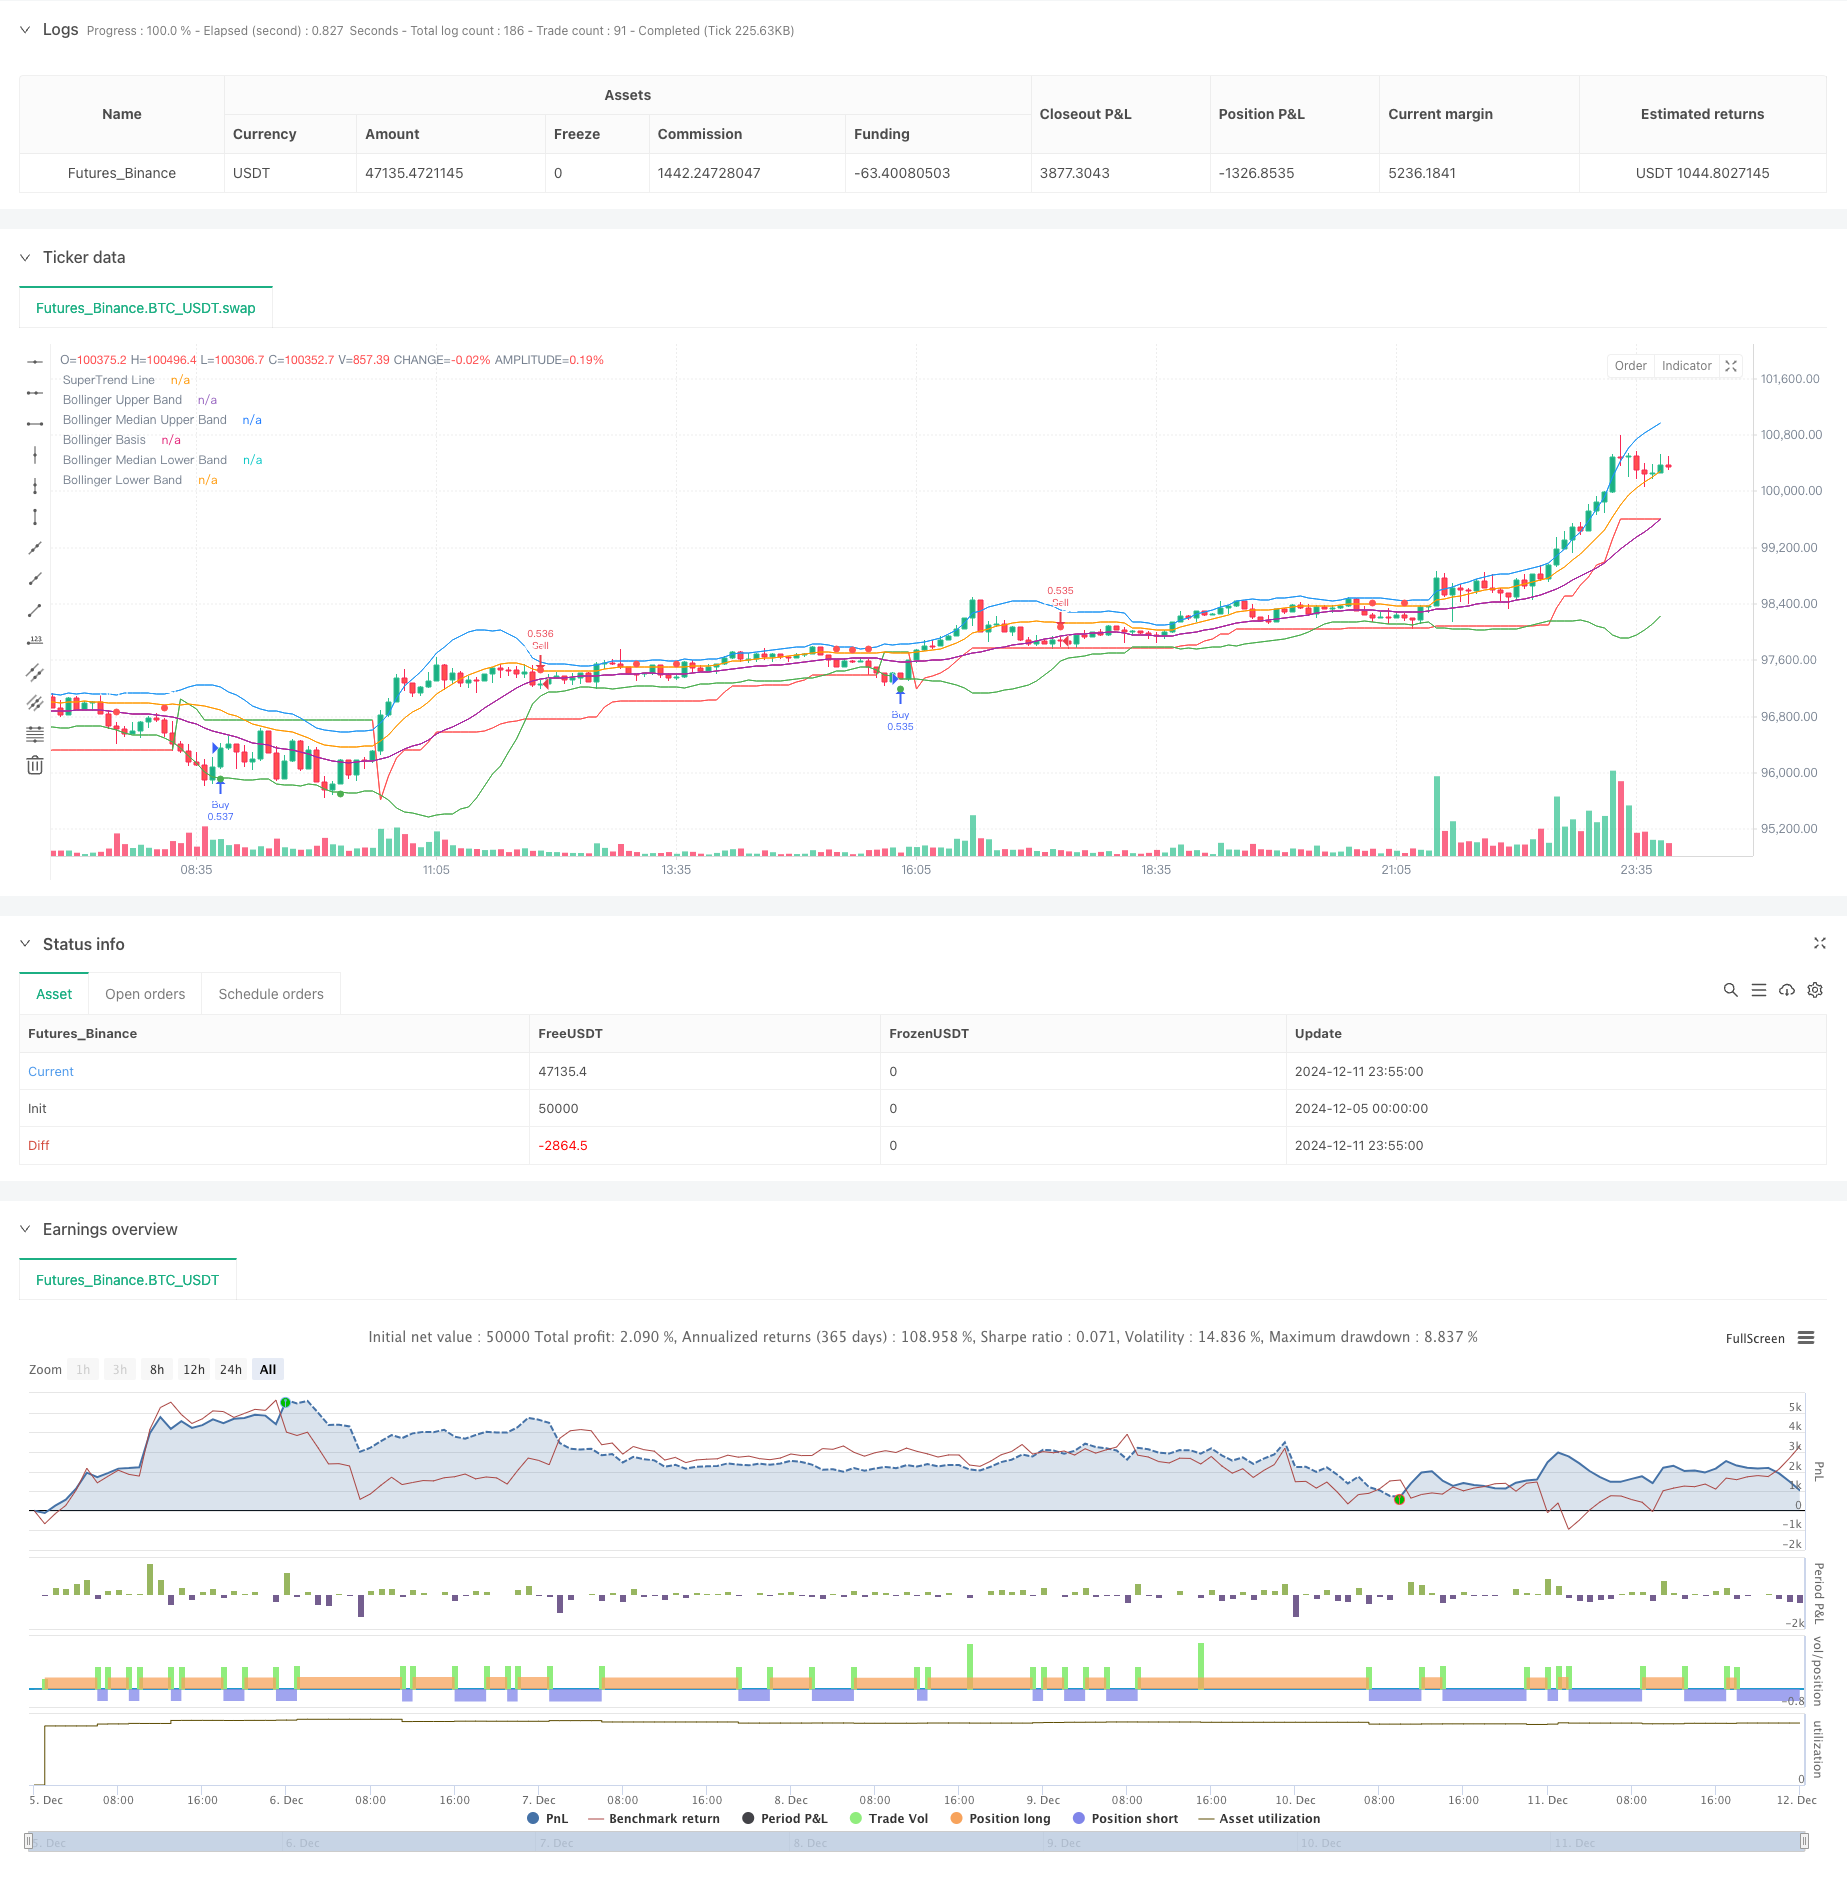
Visão geral da estratégia
Trata-se de uma estratégia de negociação inteligente que combina a faixa de Brin e o indicador de tendência superficial. A estratégia identifica principalmente os intervalos de flutuação do mercado através do Brin, enquanto usa o indicador de tendência superficial para confirmar a direção da tendência do mercado, para negociar em posições de alta probabilidade. A estratégia foi projetada para ser usada em vários tipos de negociação e períodos de tempo, especialmente em períodos de 30 minutos e 2 horas.
Princípio da estratégia
A lógica central da estratégia é baseada nos seguintes elementos-chave:
- A banda de Brin, com 20 ciclos, com 2 bandas padrão de diferença, é construída com um carril superior, um carril intermediário, um carril inferior e duas linhas médias
- Indicador de super tendências com 10 ATR de ciclo e um factor de multiplicação de 3
- Sinal de entrada:
- Entrada multi-cabeça: quando o preço toca a descida do Brin e o indicador de super-trend é multi-cabeça
- Entradas de cabeça baixa: quando o preço toca a linha de Brin e o indicador de tendência super é na direção de cabeça baixa
- Sinais de saída:
- Saída múltipla: quando o preço de fechamento cai abaixo da linha de tendência super e a tendência se transforma em zero
- Saída de cabeça vazia: quando o preço de fechamento quebra a linha de tendência super e a tendência se transforma em cabeça alta
Vantagens estratégicas
- Mecanismos de dupla confirmação aumentam a confiabilidade das negociações: combinando os intervalos de flutuação da faixa de Bryn e a orientação da tendência super, reduz o risco de falsas rupturas
- Adaptação às flutuações do mercado: A banda de Brin ajusta automaticamente a banda de acordo com as flutuações do mercado, permitindo uma boa adaptabilidade da estratégia
- Sinais de negociação claros: condições de entrada e saída claras, fáceis de executar e de rastrear
- Configuração de parâmetros flexíveis: comprimento de banda de Brin, multiplicador de banda de largura e parâmetros de super tendência podem ser ajustados de acordo com as diferentes condições do mercado
- Excelente visualização: sinais de negociação marcados em diferentes cores e formas para facilitar a análise e monitoramento
Risco estratégico
- Risco de mercado de choque: Falso sinal frequente pode ser gerado em situações de choque horizontal
- Risco de atraso: os Brinks e Supertrends são indicadores de atraso, podendo perder os melhores pontos de entrada em corridas rápidas
- Sensibilidade dos parâmetros: diferentes configurações de parâmetros podem levar a grandes diferenças no desempenho da estratégia Recomenda-se que a estratégia tenha os seguintes controles de risco:
- Estabelecer uma posição de stop loss para controlar o risco individual
- Considere suspender a negociação durante a forte volatilidade
- Optimizar periodicamente os parâmetros para se adaptar às mudanças do mercado
Direção de otimização da estratégia
- Aumentar os filtros de volatilidade do mercado:
- Ajustar o tamanho da posição em um ambiente de alta volatilidade
- Adição de filtros ATR para evitar transações durante períodos de excesso de volatilidade
- A melhor forma de evitar perdas:
- Posicionamento de stop loss baseado na largura de banda Brin
- Estratégias de stop-loss dinâmicas de design em combinação com a inclinação da super tendência
- Aumentar o tempo de filtragem:
- Evitar a divulgação de dados importantes
- Configurar diferentes parâmetros para diferentes períodos de tempo
- Mecanismos de confirmação de sinais:
- Aumentar a confirmação do volume
- Considere aumentar os indicadores de intensidade da tendência
Resumir
Trata-se de um sistema de negociação completo, combinado com indicadores clássicos de análise técnica, que pode funcionar bem em tendências e flutuações por meio da sinergia das bandas de Bryn e das supertrends. A visualização do design e a flexibilidade dos parâmetros da estratégia a tornam muito prática.
/*backtest
start: 2024-12-05 00:00:00
end: 2024-12-12 00:00:00
period: 5m
basePeriod: 5m
exchanges: [{"eid":"Futures_Binance","currency":"BTC_USDT"}]
*/

//@version=5
strategy("Bollinger Band & SuperTrend Strategy (Standard Chart)", overlay=true, default_qty_type=strategy.percent_of_equity, default_qty_value=100)

// Bollinger Bands Settings
length_bb = input.int(20, title="Bollinger Band Length")
mult_bb = input.float(2.0, title="Bollinger Band Multiplier")
[bb_upper, bb_basis, bb_lower] = ta.bb(close, length_bb, mult_bb)

// Median Bands
bb_median_upper = (bb_upper + bb_basis) / 2
bb_median_lower = (bb_lower + bb_basis) / 2

// SuperTrend Settings
atr_length = input.int(10, title="ATR Length")
factor = input.float(3.0, title="SuperTrend Factor")

// SuperTrend Calculation based on standard chart OHLC data
[supertrend, direction] = ta.supertrend(factor, atr_length)

// Plotting Bollinger Bands
plot(bb_upper, color=color.red, title="Bollinger Upper Band")
plot(bb_median_upper, color=color.orange, title="Bollinger Median Upper Band")
plot(bb_basis, color=color.blue, title="Bollinger Basis")
plot(bb_median_lower, color=color.purple, title="Bollinger Median Lower Band")
plot(bb_lower, color=color.green, title="Bollinger Lower Band")

// Plotting SuperTrend
supertrend_color = direction > 0 ? color.green : color.red
plot(supertrend, color=supertrend_color, style=plot.style_line, title="SuperTrend Line")

// Customizable Signal Shape Inputs
buy_shape = input.string("shape_triangle_up", title="Buy Signal Shape", options=["shape_triangle_up", "shape_circle", "shape_cross", "shape_diamond", "shape_flag"])
sell_shape = input.string("shape_triangle_down", title="Sell Signal Shape", options=["shape_triangle_down", "shape_circle", "shape_cross", "shape_diamond", "shape_flag"])

// Entry Conditions
buy_condition = ta.crossover(low, bb_lower) and direction > 0
sell_condition = ta.crossunder(high, bb_upper) and direction < 0

// Exit Conditions
exit_buy_condition = ta.crossunder(close, supertrend) and direction < 0
exit_sell_condition = ta.crossover(close, supertrend) and direction > 0

// Strategy Logic
if buy_condition
    strategy.entry("Buy", strategy.long)
if sell_condition
    strategy.entry("Sell", strategy.short)

if exit_buy_condition
    strategy.close("Buy")
if exit_sell_condition
    strategy.close("Sell")

// Plot Buy Signal Shape
plotshape(series=buy_condition, title="Buy Signal", location=location.belowbar, color=color.green, style=buy_shape, text="BUY", textcolor=color.white)

// Plot Sell Signal Shape
plotshape(series=sell_condition, title="Sell Signal", location=location.abovebar, color=color.red, style=sell_shape, text="SELL", textcolor=color.white)