Хейн Ашу и стратегия супертренда

Обзор
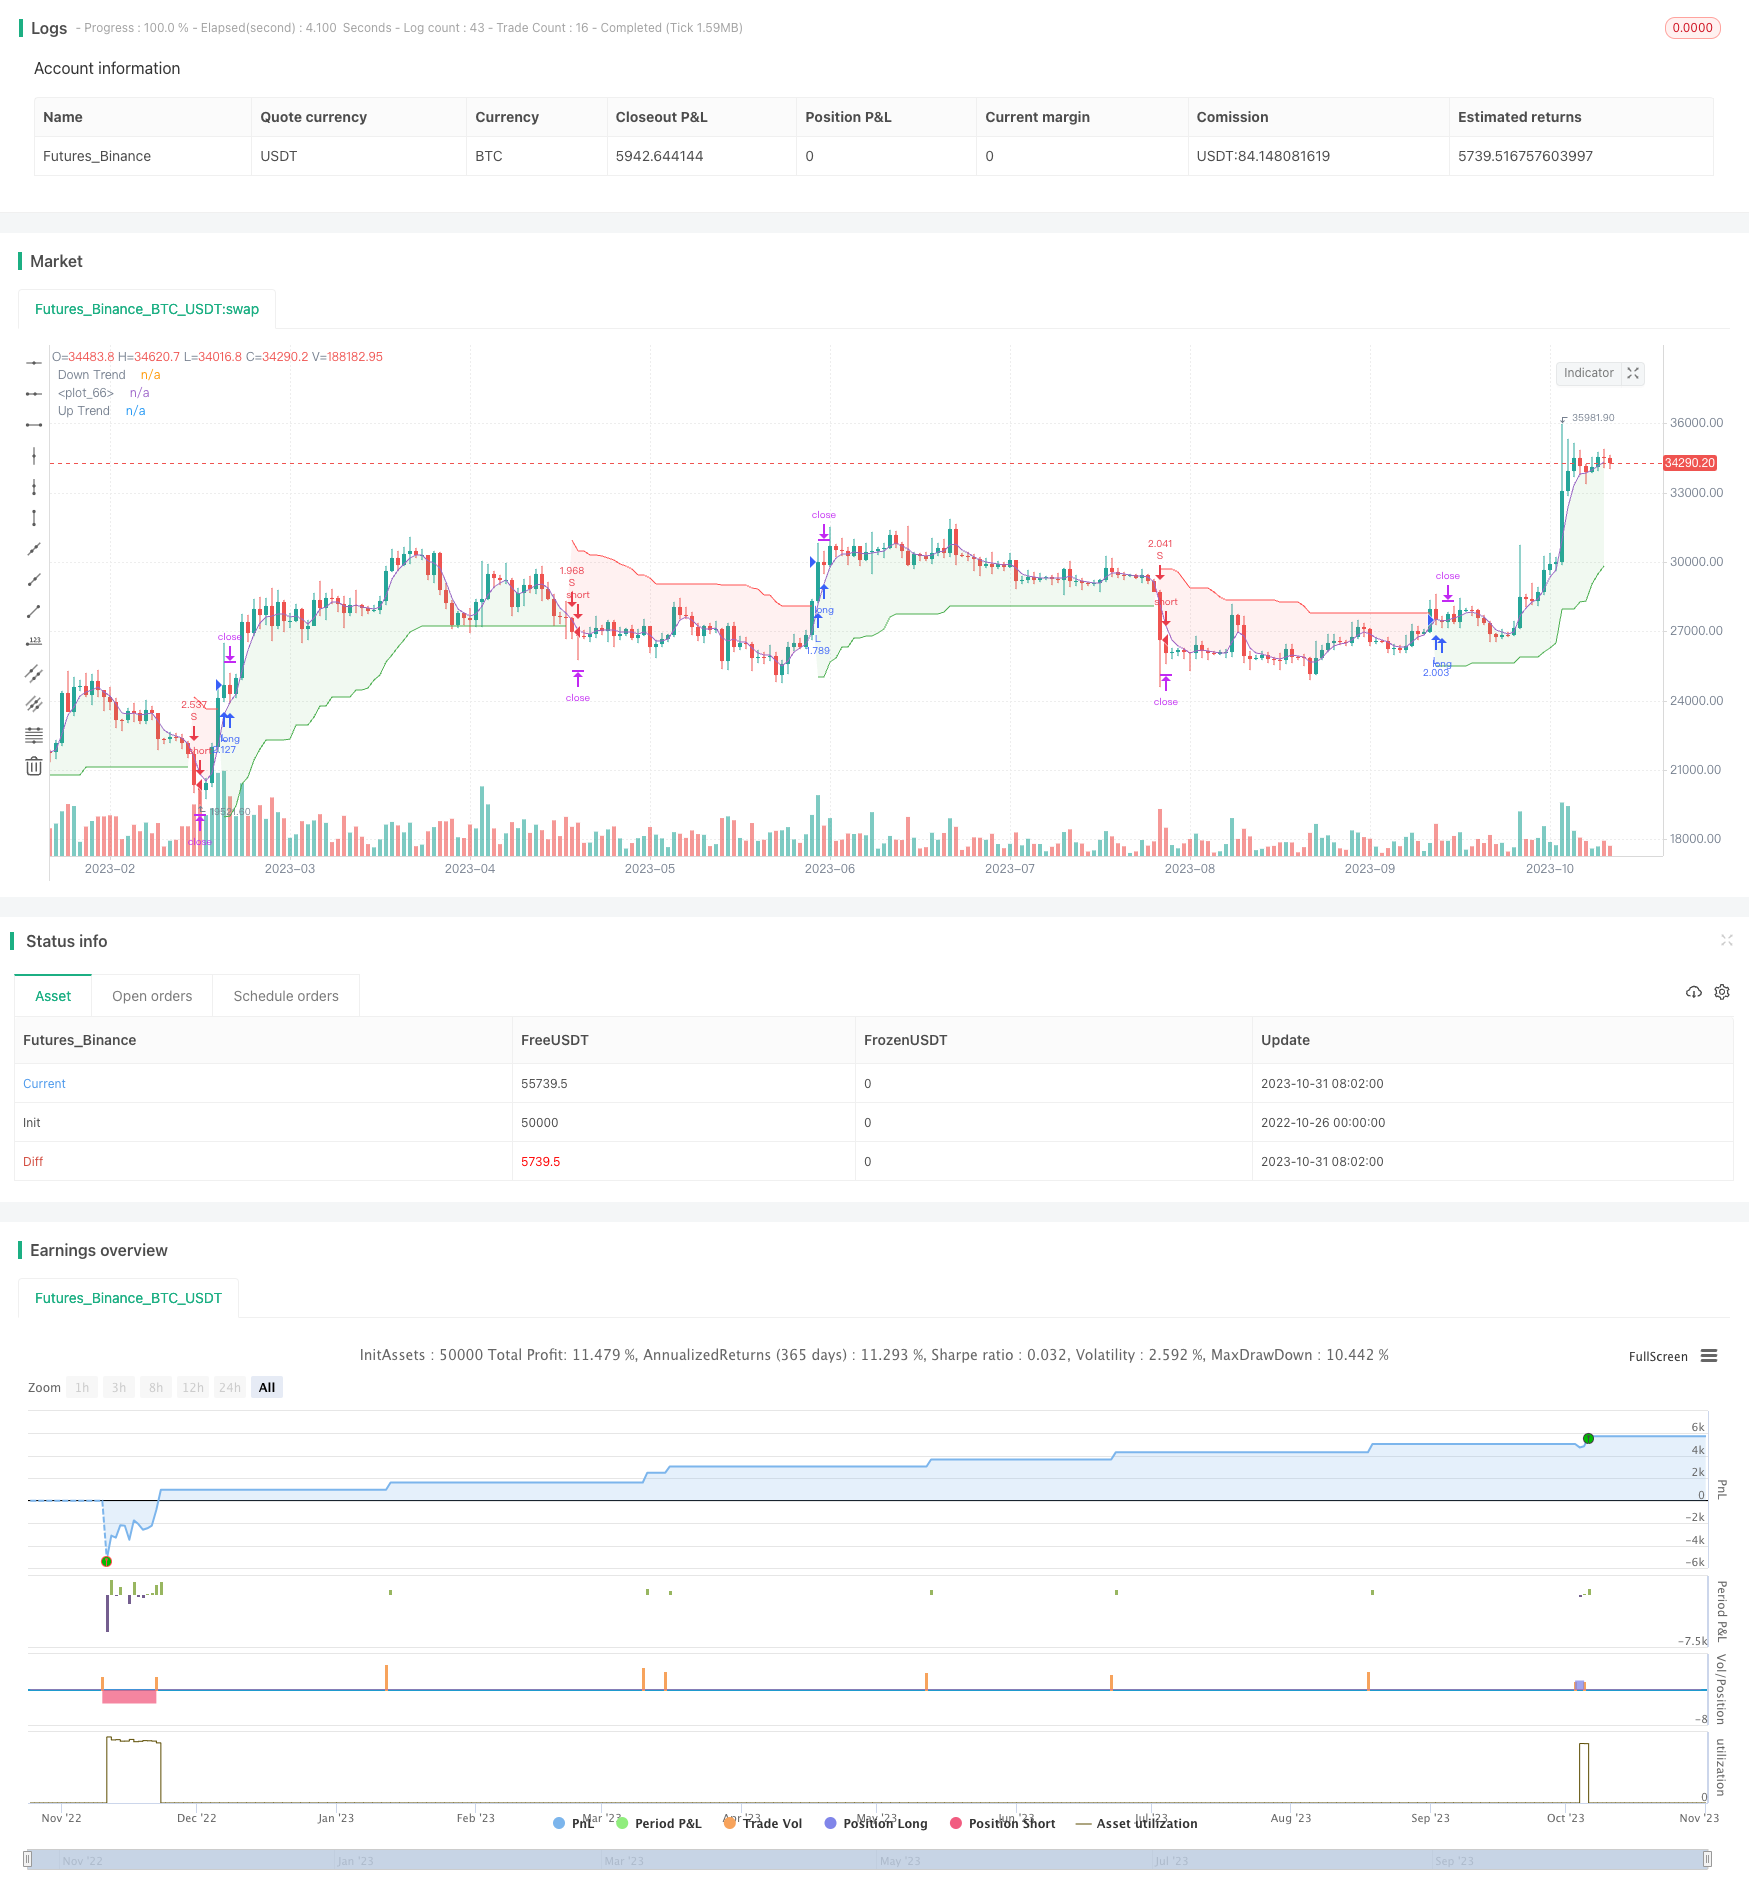
Стратегия Хайн-Атю и Супертенденции - это стратегия отслеживания трендов, объединяющая гипертенденционные диаграммы и индикаторы супертенденций. Эта стратегия предназначена для определения направления тренда, торговли в трендовых зонах и быстрого выхода из них при обратном тренде, чтобы максимально снизить потери, вызванные не трендовыми сделками.
Стратегический принцип
Хайн-Ашуйский график - это специальный K-линейный график, который использует средние значения цены открытия, закрытия, максимума и минимума для отображения криптовалютных объектов, что позволяет отфильтровать рыночный шум и сделать график более четким. Супертенденционный индикатор состоит из двух кривых, которые определяют направление тренда с помощью динамических линий поддержки и сопротивления.
Эта стратегия сначала рассчитывает гипертензивный график Хайна Асия, а затем на основе гипертензивной K-линии рассчитывает супертенденционный индикатор. Когда цена пробивает гипертензивный индикатор, генерируется торговый сигнал. В частности, эта стратегия использует гипертензивную K-линию Хайна Асия для вычисления реальной волны, а затем объединяет волну и среднюю цену, чтобы получить верхнюю и нижнюю линии супертенденции.
Стратегия также оптимизировала параметры супертенденционных индикаторов, используя оптимальную комбинацию параметров, что повышает чувствительность индикаторов. Кроме того, стратегия включает в себя механизм остановки убытков, который позволяет контролировать риск, гарантируя прибыль.
Анализ преимуществ
- Используя карту Хайна-Ашу, можно отфильтровывать шум, чтобы сделать сигнал более четким.
- Супертенденциальный индикатор позволяет быстро улавливать изменения в тренде и своевременно подавать торговые сигналы.
- Оптимизация параметров повышает надежность показателя.
- Встроенный механизм остановки убытков позволяет эффективно контролировать риски.
- Высокий уровень автоматизации в сочетании с отслеживанием тенденций и механической системой торговли.
Анализ рисков
- Система торговли имеет высокий уровень автоматизации и требует тщательного мониторинга для предотвращения аномалий.
- Несмотря на то, что карты Хайн-Ати фильтруют шум, они также пропускают очень маленький обратный сигнал.
- Супертенденционный индикатор может создавать ошибочные сигналы, приводящие к преждевременному вхождению или остановке.
- Неправильная установка стоп-пойнтов также может привести к ненужным потерям.
- Недостаточные данные отслеживания могут привести к пересчёту.
Направление оптимизации
- Испытание большего количества комбинаций параметров для дальнейшей оптимизации индикатора супертенденции.
- Попробуйте другие индикаторы, чтобы подтвердить сигнал индикатора супертенденции и снизить ошибочную частоту сигналов.
- Оптимизация стратегии по устранению убытков с целью уменьшения ненужных убытков при сохранении прибыли.
- Повышение способности алгоритмов машинного обучения определять реальные тенденции с помощью обучения большим объемам данных.
- Для повышения надежности используются более длительные временные периоды и исторические данные для более разных рынков.
Подвести итог
Стратегия Хайнц-Атю и супертенденции - это стратегия для отслеживания тенденций. Она позволяет идентифицировать направление тенденции, торговать в условиях большой тенденции и быстро останавливаться при обратном движении. Стратегия включает в себя шумовую фильтрацию на карте Хайнц-Атю и способность быстро улавливать изменения тенденции в индикаторе супертенденции.
/*backtest
start: 2022-10-26 00:00:00
end: 2023-11-01 00:00:00
period: 1d
basePeriod: 1h
exchanges: [{"eid":"Futures_Binance","currency":"BTC_USDT"}]
*/

//@version=5

strategy("Heiken Ashi & Super Trend_ARM", overlay=true,  pyramiding=1,initial_capital = 10000, default_qty_type= strategy.percent_of_equity, default_qty_value = 100, calc_on_order_fills=false, slippage=0,commission_type=strategy.commission.percent,commission_value=0.02)

///////////////////////////////////////////////////
////////////////////Function///////////////////////
///////////////////////////////////////////////////


heikinashi_open = request.security(ticker.heikinashi(syminfo.tickerid), timeframe.period, open)
heikinashi_high = request.security(ticker.heikinashi(syminfo.tickerid), timeframe.period, high)
heikinashi_low  = request.security(ticker.heikinashi(syminfo.tickerid), timeframe.period, low)
heikinashi_close= request.security(ticker.heikinashi(syminfo.tickerid), timeframe.period, close)
heikinashi_color = heikinashi_open < heikinashi_close ? #53b987 : #eb4d5c
// plotbar(heikinashi_open, heikinashi_high, heikinashi_low, heikinashi_close, color=heikinashi_color)

x_sma(x, y) =>
    sumx = 0.0
    for i = 0 to y - 1
        sumx := sumx + x[i] / y
    sumx

x_rma(src, length) =>
	alpha = 1/length
	sum = 0.0
	sum := na(sum[1]) ? x_sma(src, length) : alpha * src + (1 - alpha) * nz(sum[1])

x_atr(length) =>
    trueRange = na(heikinashi_high[1])? heikinashi_high-heikinashi_low : math.max(math.max(heikinashi_high - heikinashi_low, math.abs(heikinashi_high - heikinashi_close[1])), math.abs(heikinashi_low - heikinashi_close[1]))
    //true range can be also calculated with ta.tr(true)
    x_rma(trueRange, length)

x_supertrend(factor, atrPeriod) =>
	src = (heikinashi_high+heikinashi_low)/2
	atr = x_atr(atrPeriod)
	upperBand = src + factor * atr
	lowerBand = src - factor * atr
	prevLowerBand = nz(lowerBand[1])
	prevUpperBand = nz(upperBand[1])

	lowerBand := lowerBand > prevLowerBand or heikinashi_close[1] < prevLowerBand ? lowerBand : prevLowerBand
	upperBand := upperBand < prevUpperBand or heikinashi_close[1] > prevUpperBand ? upperBand : prevUpperBand
	int direction = na
	float superTrend = na
	prevSuperTrend = superTrend[1]
	if na(atr[1])
		direction := 1
	else if prevSuperTrend == prevUpperBand
		direction := heikinashi_close > upperBand ? -1 : 1
	else
		direction := heikinashi_close < lowerBand ? 1 : -1
	superTrend := direction == -1 ? lowerBand : upperBand
	[superTrend, direction]


///////////////////////////////////////////////////
////////////////////Indicators/////////////////////
///////////////////////////////////////////////////

factor = input.float(3.0, "Factor", step = 0.01)
atrPeriod = input(10, "ATR Length")


[supertrend, direction] = x_supertrend(factor, atrPeriod)

bodyMiddle = plot((heikinashi_open + heikinashi_close) / 2, display=display.none)
upTrend = plot(direction < 0 ? supertrend : na, "Up Trend", color = color.green, style=plot.style_linebr)
downTrend = plot(direction < 0? na : supertrend, "Down Trend", color = color.red, style=plot.style_linebr)

fill(bodyMiddle, upTrend, color.new(color.green, 90), fillgaps=false)
fill(bodyMiddle, downTrend, color.new(color.red, 90), fillgaps=false)

///////////////////////////////////////////////////
////////////////////Strategy///////////////////////
///////////////////////////////////////////////////

var bool longCond                    = na, var bool shortCond                   = na, longCond := nz(longCond[1]), shortCond := nz(shortCond[1])
var int CondIni_long                 = 0, var int CondIni_short                 = 0, CondIni_long := nz(CondIni_long[1]), CondIni_short := nz(CondIni_short[1])
var float open_longCondition         = na, var float open_shortCondition   = na


long  = ta.change(direction) < 0
short = ta.change(direction) > 0


longCond        :=                                                              long
shortCond       :=                                                              short

CondIni_long    :=                                                              longCond[1] ? 1 : shortCond[1] ? -1 : nz(CondIni_long[1])
CondIni_short   :=                                                              longCond[1] ? 1 : shortCond[1] ? -1 : nz(CondIni_short[1])
longCondition   =                                                               (longCond[1] and nz(CondIni_long[1]) == -1)
shortCondition  =                                                               (shortCond[1] and nz(CondIni_short[1]) == 1)


open_longCondition             :=                                          long ? close[1] :                                                      nz(open_longCondition[1])
open_shortCondition            :=                                          short ? close[1] :                                                     nz(open_shortCondition[1])


//TP
tp                    = input.float(1.1  , "TP [%]",                      step = 0.1)

//BACKTESTING inputs --------------------------------------------------------------------------------------------------------------------------------------------------------------------------------------------------------------------------------------------------------------------------------------------------------

testStartYear       =                   input.int(2000,                             title="start year",                                         minval = 1997, maxval = 3000,                                                   group= "BACKTEST")
testStartMonth      =                   input.int(01,                               title="start month",                                        minval = 1, maxval = 12,                                                        group= "BACKTEST")
testStartDay        =                   input.int(01,                               title="start day",                                          minval = 1, maxval = 31,                                                        group= "BACKTEST")
testPeriodStart     =                   timestamp(testStartYear,testStartMonth,testStartDay,0,0)
testStopYear        =                   input.int(3333,                             title="stop year",                                          minval=1980, maxval = 3333,                                                     group= "BACKTEST")
testStopMonth       =                   input.int(12,                               title="stop month",                                         minval=1, maxval=12,                                                            group= "BACKTEST")
testStopDay         =                   input.int(31,                               title="stop day",                                           minval=1, maxval=31,                                                            group= "BACKTEST")
testPeriodStop      =                   timestamp(testStopYear, testStopMonth, testStopDay, 0, 0)
testPeriod          =                   time >= testPeriodStart and time <= testPeriodStop ? true : false

// Backtest  ==================================================================================================================================================================================================================================================================================================================================


if longCond
    strategy.entry("L", strategy.long, when=testPeriod)

if shortCond
    strategy.entry("S", strategy.short, when=testPeriod)


strategy.exit("TP_L", "L", profit =((open_longCondition   *       (1+(tp/100))) - open_longCondition)/syminfo.mintick)

strategy.exit("TP_S", "S", profit =((open_shortCondition  *       (1+(tp/100))) - open_shortCondition)/syminfo.mintick)