概述
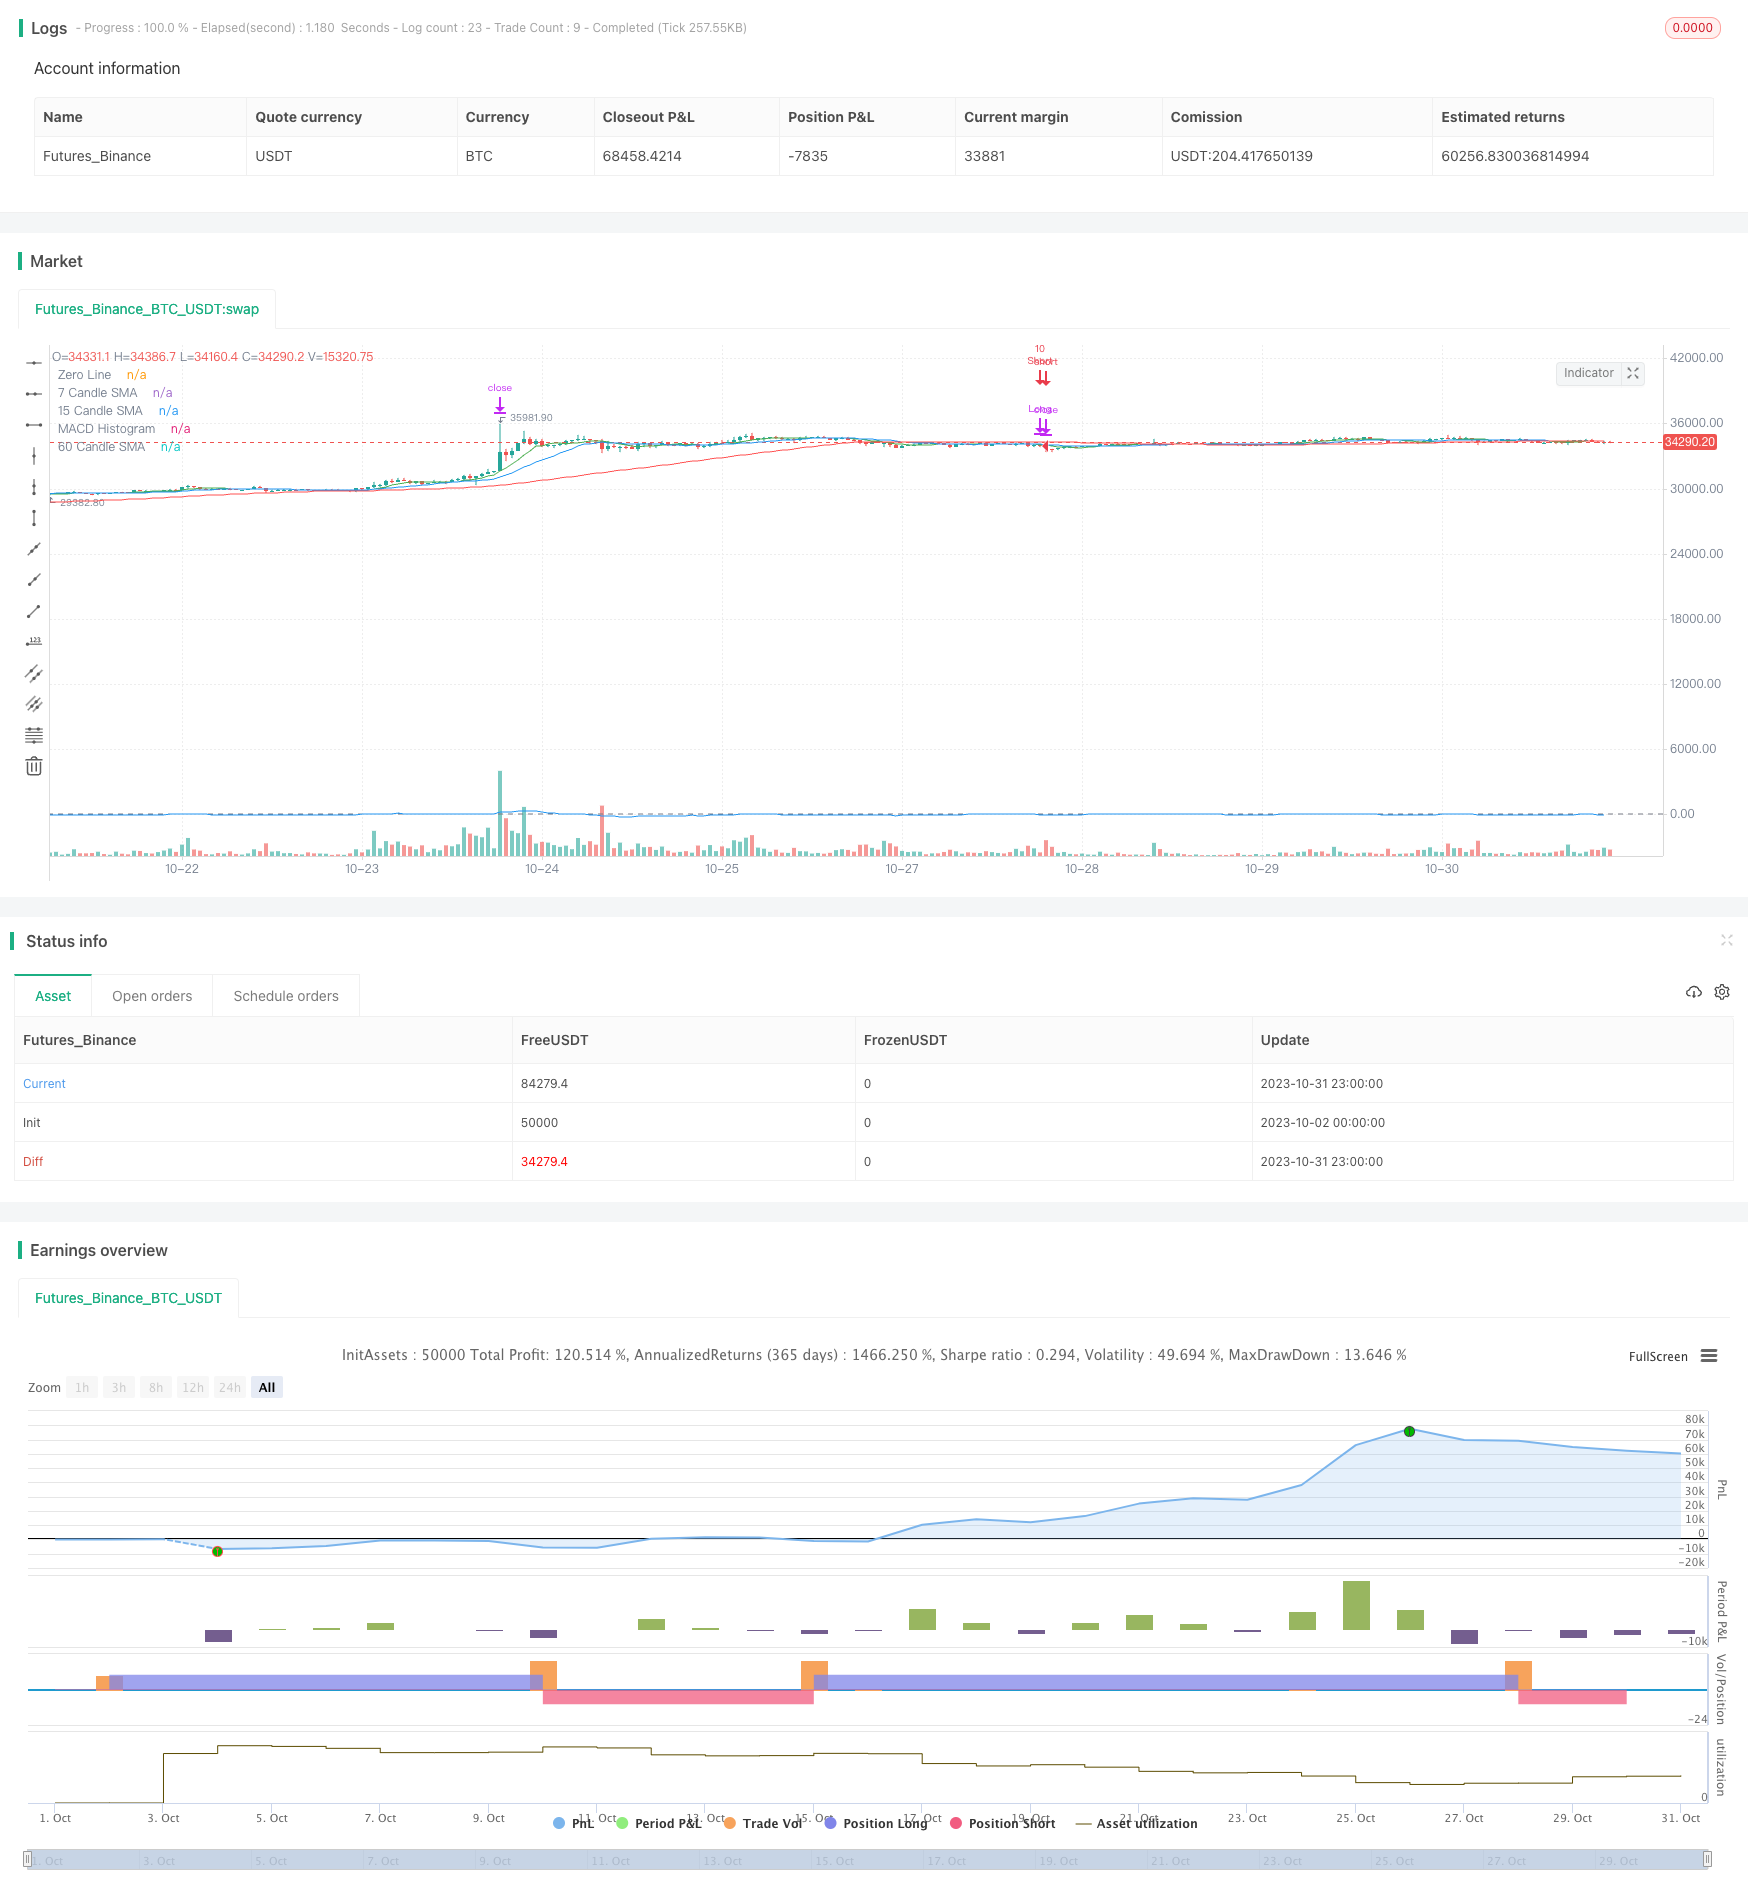
双重指标策略(Dual Indicator Strategy)是一个同时结合简单移动平均线(SMA)和移动平均收敛散发指标(MACD)的量化交易策略。该策略运用多种技术指标确认交易信号,旨在提高交易决策的准确性。
策略原理
双重指标策略主要基于两个技术指标:SMA和MACD。策略采用7根、15根和60根K线的SMA,以及标准12/26/9参数设置的MACD。
当7根SMA高于15根和60根SMA,15根SMA也高于60根SMA时,视为SMA指标给出的看涨信号,概率为0.5。
同时,当MACD指标的MACD线上穿信号线时,也视为MACD指标给出的看涨信号,概率为0.5。
当两个指标的看涨信号概率相加达到1时,就进行买入开仓。
相反,当7根SMA低于15根和60根SMA,15根SMA也低于60根SMA时,视为SMA指标给出的看跌信号,概率为0.5。
同时,当MACD指标的MACD线下穿信号线时,也视为MACD指标给出的看跌信号,概率为0.5。
当两个指标的看跌信号概率相加达到1时,就进行卖出开仓。
此外,策略采用两个不同的止盈点:价格上涨或下跌9%时,平仓50%的头寸;价格上涨或下跌21%时,平仓剩余所有头寸。
如果产生与当前持仓方向相反的信号,会先平掉之前的持仓,再按照新的信号开仓。
优势分析
双重指标策略最大的优势在于可以同时利用SMA和MACD两个指标的优点。SMA可以有效跟踪价格趋势变化,过滤市场噪音;而MACD可以发现短期的趋势反转时机。两者结合可以提高交易信号的可靠性。
此外,采用不同参数设置的多组SMA有助于辨识中长期趋势;而止盈策略可以锁定部分利润,控制风险。
风险分析
双重指标策略也存在一些潜在风险需要注意。由于仅依赖技术指标,可能出现指标发出错误信号的情况。此外,止盈设置不当也可能导致过早离场,错过大涨大跌。
可以通过调整SMA周期参数或者增加其他滤波指标来优化策略,确保交易信号更可靠。同时,止盈水平也需要根据市场波动程度进行动态调整,保证可以持续捕获趋势行情。
优化方向
双重指标策略还有一些可优化的空间:
测试添加其他技术指标,如RSI、布林带等,形成多重指标过滤;
尝试机器学习算法,利用多变量建立交易信号判断模型;
根据不同品种、周期参数进行策略调优;
增加止损策略,严格控制单笔损失;
优化止盈策略,在趋势中持续获利。
通过系统的回测和优化,可以不断提升策略的稳定性和盈利能力。
总结
双重指标策略综合运用SMA和MACD两个指标的优势,在提高信号准确性的同时,有效控制交易风险。该策略有良好的优化空间和扩展性,是一种可靠、适应性强的量化交易策略。通过持续的数据驱动和策略调优,该策略可以逐步发展成一个强大的量化交易系统。
/*backtest
start: 2023-10-02 00:00:00
end: 2023-11-01 00:00:00
period: 1h
basePeriod: 15m
exchanges: [{"eid":"Futures_Binance","currency":"BTC_USDT"}]
*/

//@version=5
strategy("SMA & MACD Dual Direction Strategy", shorttitle="SMDDS", overlay=true, initial_capital=1000)

// SMA settings
sma7_length = input.int(7, title="7 Candle SMA Length")
sma15_length = input.int(15, title="15 Candle SMA Length")
sma60_length = input.int(60, title="60 Candle SMA Length")

// MACD settings
fast_length = input.int(12, title="Fast Length")
slow_length = input.int(26, title="Slow Length")
signal_length = input.int(9, title="Signal Length")

// Leverage
leverage = 10

// Calculate the SMAs
sma7 = ta.sma(close, sma7_length)
sma15 = ta.sma(close, sma15_length)
sma60 = ta.sma(close, sma60_length)

// Calculate the MACD line and Signal line
[macdLine, signalLine, _] = ta.macd(close, fast_length, slow_length, signal_length)

// SMA-based Probabilities
smaBullishProb = (sma7 > sma15 and sma7 > sma60 and sma15 > sma60) ? 0.5 : 0.0
smaBearishProb = (sma7 < sma15 and sma7 < sma60 and sma15 < sma60) ? 0.5 : 0.0

// MACD-based Probabilities
macdBullishProb = ta.crossover(macdLine, signalLine) ? 0.5 : 0.0
macdBearishProb = ta.crossunder(macdLine, signalLine) ? 0.5 : 0.0

// Combined Probabilities
combinedBullishProb = smaBullishProb + macdBullishProb
combinedBearishProb = smaBearishProb + macdBearishProb

// Trade logic using `if` conditions
if combinedBullishProb == 1.0
    strategy.close("Short")
    strategy.entry("Long", strategy.long, qty=leverage)

if combinedBearishProb == 1.0
    strategy.close("Long")
    strategy.entry("Short", strategy.short, qty=leverage)

// Exit conditions based on profit points
longTargetProfit1 = close * 1.09
longTargetProfit2 = close * 1.21

shortTargetProfit1 = close * 0.91
shortTargetProfit2 = close * 0.79

strategy.exit("Long TP1", from_entry="Long", limit=longTargetProfit1, qty_percent=0.5)
strategy.exit("Long TP2", from_entry="Long", limit=longTargetProfit2)

strategy.exit("Short TP1", from_entry="Short", limit=shortTargetProfit1, qty_percent=0.5)
strategy.exit("Short TP2", from_entry="Short", limit=shortTargetProfit2)

// Visualization (optional)
plot(sma7, color=color.green, title="7 Candle SMA")
plot(sma15, color=color.blue, title="15 Candle SMA")
plot(sma60, color=color.red, title="60 Candle SMA")
hline(0, "Zero Line", color=color.gray)
plot(macdLine - signalLine, color=color.blue, title="MACD Histogram")