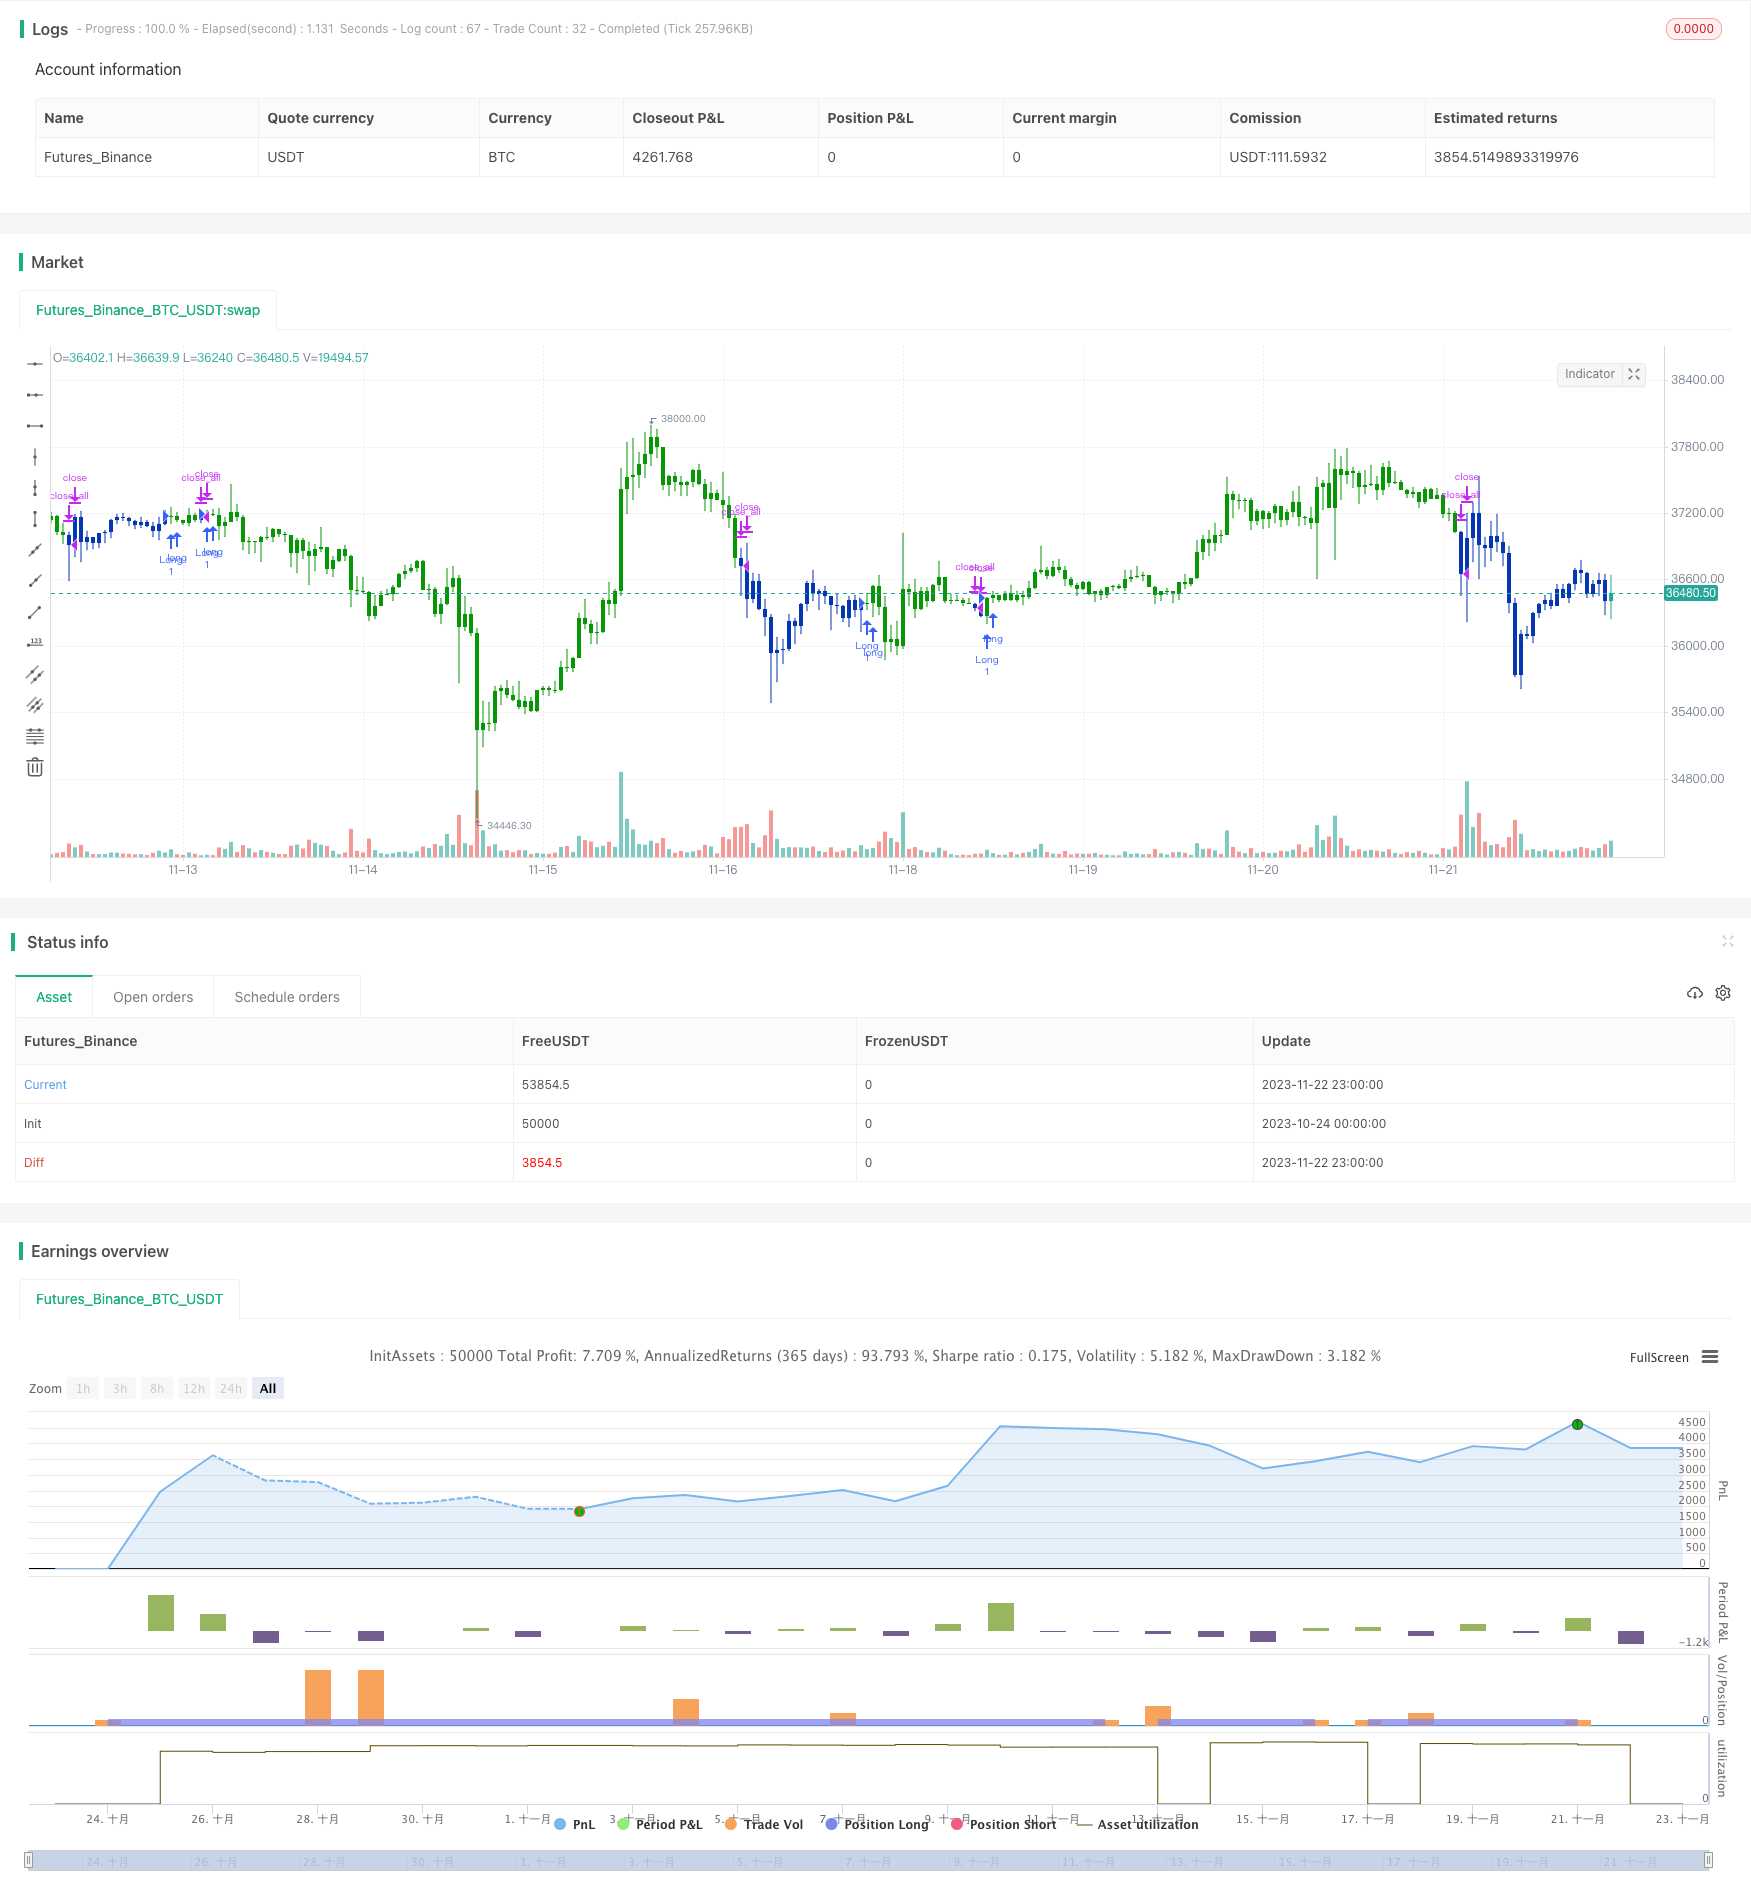
Стратегия двойного парного движения Momentum Reversation

Обзор
Эта стратегия использует несколько технических показателей для создания торгового сигнала. Стратегия использует 123 формы, чтобы определить обратную точку, чтобы создать параллельный сигнал с ergodic CSI, чтобы отслеживать тренд. Эта стратегия предназначена для захвата средне-короткой линии, чтобы получить более высокую прибыль.
Стратегический принцип
Стратегия состоит из двух частей:
- 123 Переломный момент в формальном суждении
- ergodic CSI-индикатор генерирует сигналы пары
Форма 123 - это оценка обратного ценового отсчета, основанная на последних трех K-линиях. Логика определения: Если после закрытия первых двух K-линий цены выросли, и в настоящее время индекс быстрого и медленного стока ниже 50, это является сигналом для покупки. Если после закрытия первых двух K-линий цена снизится, а текущий индикатор быстрого и медленного стока превысит 50, это будет сигналом о продаже.
Показатель ergodic CSI учитывает множество факторов, таких как цена, реальная волна и индикатор тренда, чтобы сопоставить движение рынка и создать зоны покупок и продаж. Сигналы о покупке появляются, когда индекс выше зоны покупки, и сигналы о продаже, когда индекс ниже зоны продажи.
Наконец, обратный сигнал формы 123 выполняется в комбинации с орбитальным сигналом ergodic CSI, получая окончательный стратегический сигнал.
Стратегические преимущества
- Поймать короткую линию в тренде, с большим потенциалом для дохода
- Обратная форма суждения, эффективное использование переломных моментов
- Двухколесная парность снижает количество ложных сигналов
Стратегический риск
- В частности, на рынке акций может возникнуть отклонение, которое приведет к остановке убытков.
- Вращающиеся формы подвержены воздействию рынка.
- Ограниченное пространство для оптимизации параметров и большие колебания в эффекте
Направление оптимизации
- Оптимизация параметров, повышение эффективности стратегии
- Увеличение логики стоп-лорда и снижение одиночных убытков
- Повышение качества выбора акций с использованием многофакторной модели
Подвести итог
Эта стратегия позволяет эффективно отслеживать тенденции коротких линий в паре с помощью обратной формы и двойного трека. Она имеет более высокий уровень стабильности и прибыльности по сравнению с одним техническим показателем. Следующим шагом будет дальнейшая оптимизация параметров, а также добавление модулей остановки и выбора акций для уменьшения отказов и повышения общей эффективности.
/*backtest
start: 2023-10-24 00:00:00
end: 2023-11-23 00:00:00
period: 1h
basePeriod: 15m
exchanges: [{"eid":"Futures_Binance","currency":"BTC_USDT"}]
*/

//@version=4
////////////////////////////////////////////////////////////
//  Copyright by HPotter v1.0 22/07/2020
// This is combo strategies for get a cumulative signal.
//
// First strategy
// This System was created from the Book "How I Tripled My Money In The
// Futures Market" by Ulf Jensen, Page 183. This is reverse type of strategies.
// The strategy buys at market, if close price is higher than the previous close
// during 2 days and the meaning of 9-days Stochastic Slow Oscillator is lower than 50.
// The strategy sells at market, if close price is lower than the previous close price
// during 2 days and the meaning of 9-days Stochastic Fast Oscillator is higher than 50.
//
// Second strategy
// This is one of the techniques described by William Blau in his book
// "Momentum, Direction and Divergence" (1995). If you like to learn more,
// we advise you to read this book. His book focuses on three key aspects
// of trading: momentum, direction and divergence. Blau, who was an electrical
// engineer before becoming a trader, thoroughly examines the relationship between
// price and momentum in step-by-step examples. From this grounding, he then looks
// at the deficiencies in other oscillators and introduces some innovative techniques,
// including a fresh twist on Stochastics. On directional issues, he analyzes the
// intricacies of ADX and offers a unique approach to help define trending and
// non-trending periods.
// This indicator plots Ergotic CSI and smoothed Ergotic CSI to filter out noise.
//
// WARNING:
// - For purpose educate only
// - This script to change bars colors.
////////////////////////////////////////////////////////////
Reversal123(Length, KSmoothing, DLength, Level) =>
    vFast = sma(stoch(close, high, low, Length), KSmoothing)
    vSlow = sma(vFast, DLength)
    pos = 0.0
    pos := iff(close[2] < close[1] and close > close[1] and vFast < vSlow and vFast > Level, 1,
	         iff(close[2] > close[1] and close < close[1] and vFast > vSlow and vFast < Level, -1, nz(pos[1], 0)))
	pos

fADX(Len) =>
    up = change(high)
    down = -change(low)
    trur = rma(tr, Len)
    plus = fixnan(100 * rma(up > down and up > 0 ? up : 0, Len) / trur)
    minus = fixnan(100 * rma(down > up and down > 0 ? down : 0, Len) / trur)
    sum = plus + minus
    100 * rma(abs(plus - minus) / (sum == 0 ? 1 : sum), Len)

ECSI(r,Length,BigPointValue,SmthLen,SellZone,BuyZone) =>
    pos = 0
    source = close
    K = 100 * (BigPointValue / sqrt(r) / (150 + 5))
    xTrueRange = atr(1)
    xADX = fADX(Length)
    xADXR = (xADX + xADX[1]) * 0.5
    nRes = iff(Length + xTrueRange > 0, K * xADXR * xTrueRange / Length,0)
    xCSI = iff(close > 0,  nRes / close, 0)
    xSMA_CSI = sma(xCSI, SmthLen)
    pos := iff(xSMA_CSI > BuyZone, 1,
             iff(xSMA_CSI <= SellZone, -1, nz(pos[1], 0)))
    pos

strategy(title="Combo Backtest 123 Reversal & Ergodic CSI", shorttitle="Combo", overlay = true)
Length = input(14, minval=1)
KSmoothing = input(1, minval=1)
DLength = input(3, minval=1)
Level = input(50, minval=1)
//-------------------------
r = input(32, minval=1)
LengthECSI = input(1, minval=1)
BigPointValue = input(1.0, minval=0.00001)
SmthLen = input(5, minval=1)
SellZone = input(0.06, minval=0.00001)
BuyZone = input(0.02, minval=0.001)
reverse = input(false, title="Trade reverse")
posReversal123 = Reversal123(Length, KSmoothing, DLength, Level)
posECSI = ECSI(r,LengthECSI,BigPointValue,SmthLen,SellZone,BuyZone)
pos = iff(posReversal123 == 1 and posECSI == 1 , 1,
	   iff(posReversal123 == -1 and posECSI == -1, -1, 0))
possig = iff(reverse and pos == 1, -1,
          iff(reverse and pos == -1 , 1, pos))
if (possig == 1)
    strategy.entry("Long", strategy.long)
if (possig == -1)
    strategy.entry("Short", strategy.short)
if (possig == 0)
    strategy.close_all()
barcolor(possig == -1 ? #b50404: possig == 1 ? #079605 : #0536b3 )